Abstract

Due to lactose intolerance, there is a growing need for lactose-free or low-lactose dairy products. Herein, a combination of three membrane technologies (UF, electrodialysis (ED), and nanofiltration (NF)) was used as a novel green technology to replace the enzymatic preparation of low-lactose milk powder in the traditional industry. In which, large molecules such as proteins and fats are first retained using UF, mineral salt was intercepted and re-added into milk by electrodialysis, and finally, lactose is recovered by NF. Finally, low-lactose milk powder with a lactose content of less than 0.2% was obtained; meanwhile, the high purity (95.7%) of lactose powder could be effectively reclaimed from the NF concentrate (lactose concentrate). The whole membrane process is based on the physical pore size screening mechanism, without adding any chemical reagents with minimal impact on the physical and chemical properties of milk. These results indicate that process development and optimization coupling of three membrane technologies is very promising in preparing low-lactose milk powder and recovering lactose.
1. Introduction
Dairy products significantly contribute to a balanced diet because of their beneficial macro- and micronutrient composition, including high-quality proteins and high calcium content. In addition, among the 20 kinds of amino acids constituting human proteins, there are 8 essential amino acids that the human body cannot synthesize (the baby is lacking 9 kinds). The protein in milk contains all the essential amino acids and is called whole protein. However, the presence of lactose intolerance affects the patient’s consumption of milk-based dairy products. Lactose intolerance is a common genetic condition connected to the deficiency of functional lactase in adulthood (lactase nonsustainability), and it is estimated that the proportion of the global population showing this disease is approximately 65%. Lactose intolerance may cause some abdominal pain, flatulence, and diarrhea when ingesting lactose-containing dairy products. It is worth mentioning that lactose intolerance does not mean that lactose cannot be absorbed. Consumption of low-lactose dairy products can increase the amount of lactase in the small intestine and help to alleviate lactose intolerance.1
Low-lactose and even lactose-free dairy products provide a way for people who cannot digest lactose to absorb nutrients such as calcium and vitamins. In some European countries, the lactose-free threshold is <0.01% (w/w), while low lactose means <1% (w/w) and lactose-reduced implies that the lactose concentration must be less than 2.0% (w/w).2 Currently, industrial lactose-free or low-lactose products are usually predigested by the addition of exogenous lactase, β-galactosidase.3−5 However, enzymatic methods can only be recycled as a one-time technique, and lactose hydrolysis produces extra sweetness, which is not suitable for special populations, such as patients with hyperglycemia. On the other hand, various membrane technologies have been widely used in dairy-related research.6 For example, ultrafiltration is suitable for separating compounds with a molecular weight of 103–106 Da. Protein and fat are blocked, while lactose and small molecular substances are allowed to pass. Baldasso and co-workers studied ultrafiltration intermediate discontinuous diafiltration (DF) in concentrated whey. The protein concentrate weight (dry basis) is greater than 70%.7 Mohammad found that all fouling mechanisms were present during ultrafiltration but dominated by complete blocking, followed by a standard, intermediate blocking and cake layer formation.8 Also, Zhang’s AGS size study showed that the largest membrane fouling exists at the critical size.9 Meanwhile, nanofiltration has a smaller molecular weight cutoff (MWCO) (100 and 500 Da) than ultrafiltration. Therefore, in addition to desalting for whey and ultrafiltration permeate,10−12 nanofiltration is a technology suitable for the concentration of high-value substances such as whey protein and lactose.13,14 Wang et al. combined the continuous volume DF (CVVD) in the nanofiltration (NF) process for the concentration and desalting of white cheese whey (acid whey) and optimized the parameters to achieve a 90% salt rejection rate.15
However, nanofiltration requires desalting of whey at higher pressures and more steps, which means higher energy consumption, more uptime, and lower economics. By contrast, electrodialysis (ED) is based on charge difference rather than the particle size difference,16 which are very mature in whey desalination technology. Canadian scientist Casademont et al. combined a pulsed electric field with ED to prevent the fouling of ion-exchange membranes (IEMs) and enhance their efficiencies. Finally, 79.5% whey salt rejection was achieved, and there was no membrane contamination compared with other treatment methods.17,18
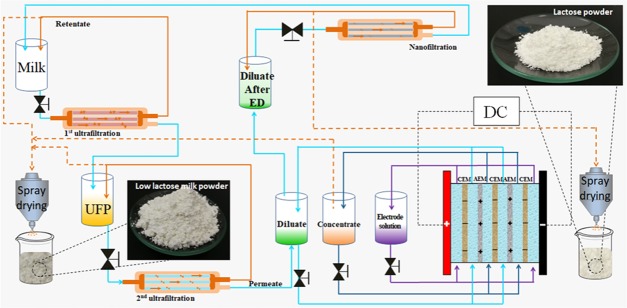
In this study, the combination of UF, ED, and NF technologies as a new green technology to replace the enzymatic preparation of low-lactose milk powder. Macromolecules such as proteins and fats are retained by UF, and then highly desalted and concentrated by ED. Finally, lactose is recovered by NF, and NF permeate is reused in the UF process. In addition, the parameters in each membrane process are optimized. The feasibility of the method is verified by a third-party testing institution with a CMA certification.
2. Results and Discussion
2.1. Effect of DF on Lactose Concentration in UF Process
The ultrafiltration process is divided into two parts: the hollow fiber membrane filtration (100 kDa) and the second flat membrane filtration (3–20 kDa). In the first UF process, most of the protein was transported through the UF and fat and larger protein aggregates were rejected. In the second UF process, the purpose is to effectively retain the remaining proteins. Meanwhile, the role of the ultrafiltration process is to retain the macromolecular substances in the milk to reduce membrane fouling during electrodialysis. This experiment was to prepare low-lactose milk powder, so it is necessary to reduce the lactose content in the retentate as much as possible in the ultrafiltration process. The DF process is created to achieve this requirement.
The effect of DF on lactose concentration was investigated during both UF processes. The DF process could change the ionic environment due to the removal of salts. This can affect the physicochemical properties of casein micelles (CMs), as well as the characteristics of concentration polarization (CP) and fouling.19 In particular, casein micelle (CM) properties are heavily dependent on the equilibrium between ionic calcium in milk serum and the colloidal calcium phosphate (CCP) in micelles. Lactose is generally not considered as a foulant and does not contribute to the flux decline.20 However, lactose interacts with metal ions and proteins, and these interactions could indirectly influence filtration behavior. Lactose can form complex with calcium and iron ions21 and is reported to have a stabilizing effect on protein structure.22 Since interactions of lactose with calcium and proteins are present, its removal during DF may have an impact on UF behavior.
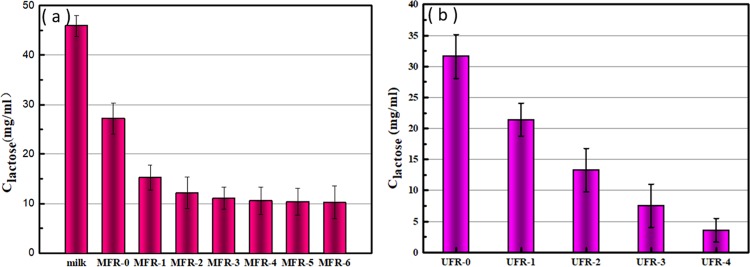
The first UF process is to retain fat and protein colloids. However, due to the interaction of lactose with protein, a DF process is required to reduce the concentration of lactose in the retentate. In this intermittent DF process, 900 mL of deionized water was added to the retentate per 900 mL of permeate. It can be seen from Figure 1a that as the number of DF increases, the concentration of lactose in the retentate decreases with expectation. The UFR is the concentration of lactose in the 100 mL retentate after one filtration of milk, and the DF-1 is the concentration of lactose when it is filtered again to 100 mL of the retentate after adding 900 mL of deionized water. However, it was found that the tendency of the lactose concentration to decrease gradually became smooth after six times of addition of DF. This is due to the increasing interaction of the continuously concentrated protein with low content of lactose.
Figure 1.
Effect of DF frequency on lactose concentration. (a) First hollow fiber membrane UF. (b) Second flat membrane UF.
As can be seen from Figure 1b, the lactose content decreased after each DF process. Although the concentration decreased slowly, the lactose decrease of 44.4% was observed during the second DF, which was much higher than the previous lactose reduction of 30.7%. This phenomenon can be explained by Kenneth’s study. Flux improvement and the corresponding resistance reduction (especially due to concentration polarization) are almost completely affected by mineral removal.23 As the membrane resistance decreases, the flux increases and more lactose can pass through. After only four DF cycles, the lactose concentration in the retentate was only 3.571 mg/mL. Combine the lactose concentration of 10.249 mg/mL in the first ultrafiltration retentate. It can be calculated that the concentration of lactose in the mixture is 0.935 g/L, which is in line with the expected value.
2.2. UF Membrane Optimization
After reducing the lactose content in ultrafiltration, UF membranes with different molecular weight cutoffs must be optimized to pursue effective protein retention and optimal flux. In this experiment, a poly(ether sulfone) (PES) ultrafiltration membrane with a molecular weight cutoff of 3–20 kDa was selected for testing.
As depicted in Figure 2, 3–10 kDa PES ultrafiltration membrane has a high protein retention rate. The 3 kDa ultrafiltration membrane reaches a protein rejection of 99.05%. However, the protein retention rate of the 20 kDa ultrafiltration membrane is only 93.88%. This is because the molecular weights of α-lactalbumin and β-lactoglobulin are 14 and 18–36 kDa, respectively, which allow them to pass the 20 kDa ultrafiltration membrane. Since the molecular weight of lactose is only 342 Da, the ultrafiltration membrane has little effect on lactose retention theoretically. However, we can still observe the difference in lactose penetration when using UF membranes with different MWCO. The larger aperture yields a greater flux, thus more lactose can pass through the membrane. The 20 kDa ultrafiltration membrane has a maximum lactose transmission rate of 97.97%. However, the 10 kDa ultrafiltration membrane also achieved a transmittance of 95.89%. Therefore, based on a comprehensive consideration of protein retention and lactose penetration, the 10 kDa PES ultrafiltration membrane is optimal. In combination with the reticular fluid after several cycles of the DF process in Section 2.1, a portion of lactose still exists. The previous study of Baldasso et al. also gave similar results. Twenty-nine percent lactose content remained in the retentate after six cycles of the DF process (VFC = 6) using a 10 kDa PES ultrafiltration membrane.7,24
Figure 2.
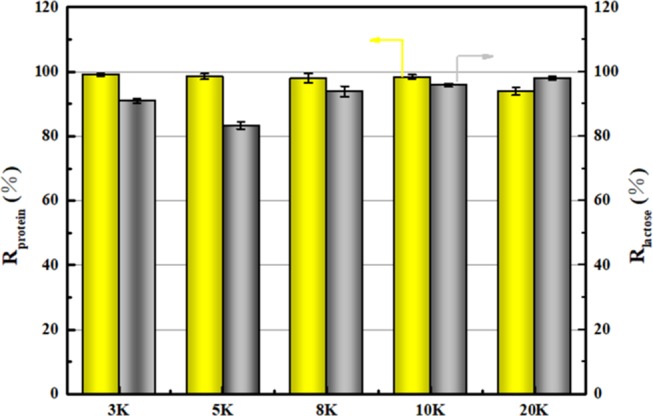
Protein retention rate and lactose transmission rate of different pore size ultrafiltration membranes (3k is 3 kDa PES ultrafiltration membrane).
2.3. Pressure and Flow Rate Optimization
Pressure is a key factor in the UF process, which directly affects the flux and the penetration of proteins, lactose, salt, and water. Therefore, it is especially important to choose a suitable pressure. A large number of literatures have examined the effects of pressure on the flux in the ultrafiltration process. Although different fluxes are caused by differences in device and solution, flux variations can be seen therein. In this experiment, the pressure range of 1–4 bar was selected, and two better pressure values were selected and the effect of flow rate on flux was compared.
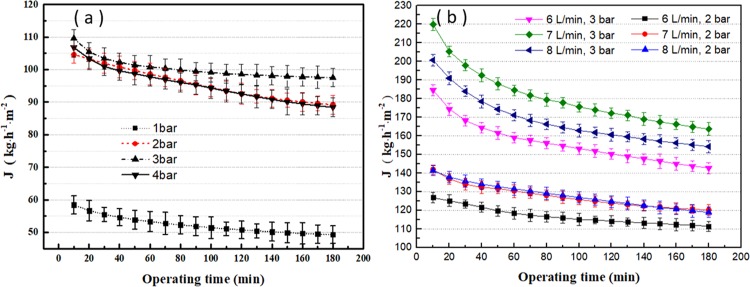
As can be seen from Figure 3a, with extending running time, the permeate flux first decreased and then stabilized. This could be explained by the concentration polarization (CP) phenomenon. Due to the formation of the concentration polarization layer, the protein concentration near the membrane surface increases as the pressure increases. With a continuous permeation of lactose, salt, and water, the concentration of protein gradually increases. After reaching a sufficient concentration, a gel layer is formed, which results in additional resistance for the permeate flux.8,25 An increase in pressure results in a thicker gel layer, so the permeate flux does not increase. It is worth mentioning that pressure and flux are not positively correlated within the pressure range of 1–4 bar. The effect of pressure is very pronounced in the range of 1–3 bar. However, since the excessive pressure exacerbates the concentration polarization, the flux at 4 bar is slightly lower than that at 2 bar. This can be explained by the blockage of membrane pores by the surface gel layer.26,27
Figure 3.
(a) Permeate flux of ultrafiltration under different pressures (10 kDa PES, 7 L/min flow rate). (b) Permeate flux of ultrafiltration at different material flow rates (10 kDa PES, 2–3 bar).
The flow rate optimization test was carried out by selecting two optimal pressures (2 and 3 bar) from the pressure optimization experiment. As can be seen from Figure 3b, regardless of the flow rate, the flux first decreases with time and then reaches a stable value. This phenomenon can be explained by the equilibrium of the concentration polarization. At 2 bar, the flux increases with the circulation flow rate. With a higher flow rate, the deposited macromolecules are continuously removed from the membrane surface. This could reduce the hydraulic resistance of the fouling layer. As a result, the concentration polarization decreases and the pressure flux balance point increases.7 However, it is worth noting that, at 3 bar, the higher flux is observed at a flow rate of 7 L/min than that at the flow rate of 8 L/min, which is inconsistent with Kessler’s explanation. This may be due to the use of a cross-flow device. Some fluids do not follow the cross-flow flow path under the influence of high pressure and high flow rate, thus increasing the concentration polarization phenomenon.
2.4. Membrane Fouling Characterization
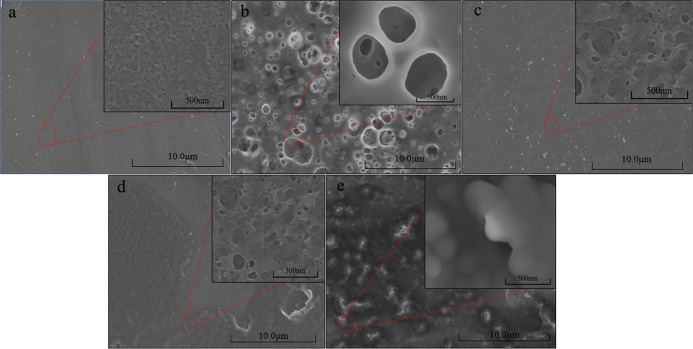
Membrane fouling has always been an important factor in the application of separation membranes; herein, the membrane fouling phenomenon was characterized by scanning electron microscopy (SEMs) (shown in Figure 4). In contrast to the pristine membrane (Figure 4a), the UF membranes after use exhibit obviously fouling layers (Figure 4b–e). As described by Mohammad et al.,8 the fouling mechanisms were present during the ultrafiltration but dominated by complete blocking, followed by standard, intermediate blocking and cake layer formation. Comparing Figure 4b,c, it can be found that the filter cake layer on the membrane surface is greatly reduced after cleaning, and only a small part remains. In addition, a 57.9% flux recovery rate also provides evidence. It is worth mentioning that in the SEM, the flat membrane is used to filter the milk, and in the process of preparing lactose-free milk powder, the first ultrafiltration is performed through a hollow fiber membrane. Also, in the cleaning of aerial fiber membranes, back-flushing can be used to increase the flux recovery. Also, that is exactly what happened. In this experiment, the service life of hollow fiber membranes is six months. Back-flushing can solve most membrane fouling problems. For example, in Zhang’s research on bionic dynamic membrane (BDM), backwashing technology was used to eliminate inactive bionic layers and remanufacture new BDM.28 On the other hand, as seen in Figure 4d,e, it can be found that most of the effective membrane surface is exposed to 0.5% NaOH (w/w) cleaning, which is inconsistent with 71.3% flux recovery rate.
Figure 4.
SEM images of (a) pristine membrane, (b) first-step UF fouling membrane, (c) cleaning membrane after first UF, (d) second-step UF fouling membrane, and (e) cleaning membrane after second UF.
2.5. Effect of Voltage during Electrodialysis
The purpose of the electrodialysis process is to remove and recover the mineral salt in the ultrafiltration permeate. As a relatively mature technique, electrodialysis has been widely used in the desalination of whey, protein, and brackish water.29 There is a problem here. Since nanofiltration can also be used for desalination, why add a step of electrodialysis in the middle? This takes into account the high-concentration of electrodialysis and the inevitable DF process of nanofiltration. First, for the general NF membrane retaining Ca2+ and Mg2+, the electrodialysis can effectively reclaim the mineral salt to be added into milk powder products and can also increase the purity of the recovered lactose powder. Second, the removal of Ca2+ and Mg2+ can reduce the membrane fouling in the NF process. Meanwhile, because the special NF can separate the mineral salt and lactose, the process without ED will greatly increase the cost of spray drying. Similar to Figure 1, the NF permeate solution after the DF process must be added into the mixed solution for spray drying, which will immensely increase the volume of the feed solution. For instance, approximately 10 L of UF permeate can be concentrated into 1 L at high magnification during electrodialysis, whereas the use of NF requires an increase to at least 20 L. Therefore, it is necessary to use ED for high concentration to reduce the volume of the solution during spray drying, further reducing energy consumption.
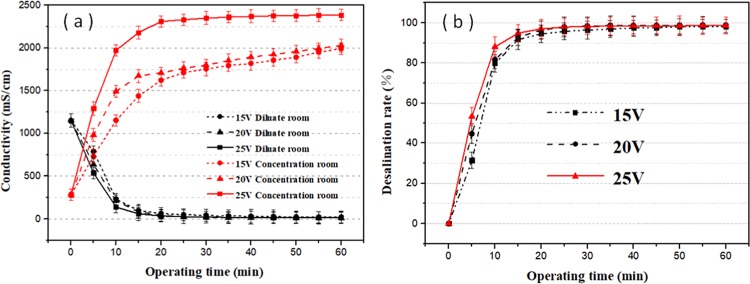
Figure 5 shows the desalination process of the UF permeate solution, which exhibits the change of conductivity and desalination rate as a function of time. The desalination rate is calculated according to eq 1. Due to the influence of the experimental setup, the current density used herein is very small (32.2 A/m2). However, the high efficiency of electrodialysis is still demonstrated as seen in Figure 5a. By comparing the performances at different voltages, it can be observed that a higher voltage leads to a higher salt rejection rate and a shorter desalination time. This is because the higher voltage corresponds to a larger current density, which enhances the desalination rate. In addition, the conductivities of the desalination chamber and the concentration chamber gradually become constant after 20 min. This is because the ions in the desalting solution gradually migrate into the concentrate, and the concentration difference increases the membrane resistance and reduces the current density. Finally, the ion content in the desalination chamber is very low. The effect of electrodialysis at this stage does not allow ions to migrate into the concentration chamber. In addition, the conductivity in the desalination chamber can be as low as 13.49 mS/cm, further illustrating the excellent performance of electrodialysis. It is worth mentioning that the salt content can be controlled by the desalting time. In Figure 5b, the salt content is calculated based on the demineralization rate. It can be clearly found that a 98% desalination rate is achieved when the time reaches 30 min.
Figure 5.
(a) Concentrations of concentrate and desalinated liquid at different voltages. (b) Different voltage desalination rate graph.
2.6. Effect of Pressure Selection during Nanofiltration
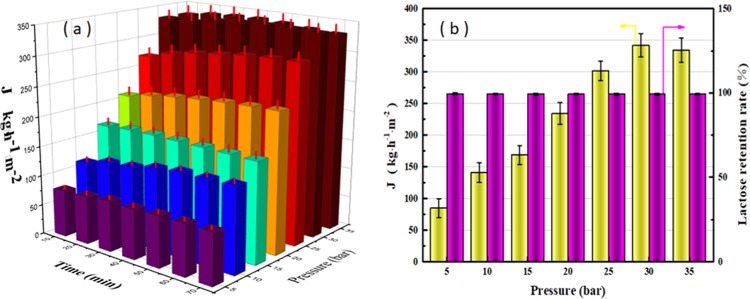
The purpose of nanofiltration is mainly to recover lactose and achieve zero discharge from a green environment point of view; the permeate (low-salinity water) obtained by nanofiltration is recycled in the ultrafiltration process. After the previous UF and ED processes, only small amounts of sodium salts and vitamins with a molecular weight similar to lactose remained in the nanofiltration feed liquid. Therefore, DF is not required for the NF process. It is found from Figure 6a that the flux does not substantially change with time. On the one hand, the nanofiltration membrane is substantially compacted after a preload of 1 h. On the other hand, the feed liquid contains only small amounts of low-molecular-weight polypeptide and cellulose (in addition to lactose and a small amount of sodium salt), which have little effect on membrane resistance. However, pressure has a very significant effect on flux. The flux increases almost linearly with pressure in the range of 5–30 bar and then tends to equilibrate after 35 bar. This is similar to the ultrafiltration process and in line with expectations because both ultrafiltration and nanofiltration are pressure-based membrane processes governed by pore size screening mechanisms. The flux is positively correlated with the pressure between 0 and 30 bar. However, when the pressure is 35 bar, the flux decreased because excessive pressure results in greater concentration polarization. The dirt on the membrane surface is squeezed to form a dense cake layer, resulting in greater membrane resistance. Cheryan also reported this phenomenon. Although a higher permeate flux is expected at higher pressure, increasing pressure leads to membrane compaction, which reduces subsequent permeate flux.30 In addition, pressure has little effect on the retention of lactose, as shown in Figure 6b, the retention rate of lactose all exceeds 99%. This fully illustrates the feasibility of NF for concentrating lactose.
Figure 6.
(a) Flux of different pressures in the NF process. (b) Flux of NF process with 1 h and lactose rejection rate (10 kDa PES, 7 L/min).
2.7. Coupling Test
As shown in Figure 7, the whole separation and purification system is developed for preparing a low-lactose milk powder, which combines a four membrane filtration process. The system was optimized by controlling the types of membranes and operational parameters. The retentate of the first UF hollow fiber membrane is mixed with the second UF retentate and the ED concentrate. Milk was passed through a 100 kDa hollow fiber membrane with DF (six times) in the first ultrafiltration process. The first ultrafiltration permeate was then filtered through a 10 kDa PES ultrafiltration membrane at a pressure of 3 bar and a flow rate of 7 L/min during the second ultrafiltration. Third, pass the 20 V electrodialysis process. Fourth, pass the nanofiltration process at a pressure of 30 bar and a flow rate of 7 L/min. Finally, the low-lactose milk powder having a lactose content of less than 0.2% and the lactose powder having a purity of 95.7% were obtained by spray drying. Figure 1 shows low-lactose milk powder and high-purity lactose powder, respectively. Low-lactose milk powder ingredients are shown in Table 1.
Figure 7.
Schematic flow diagram of the laboratory.
Table 1. Low-Lactose Milk Powder Ingredient Lista.
| ingredient | protein | fat | ash | lactose |
|---|---|---|---|---|
| concentration (w/w) | 39.8 | 44.4 | 15.2 | 0.2 |
Herein, ash is inorganic salt in the milk powder, which contains: calcium content (1.10%), magnesium (0.01%), potassium (0.50%), sodium (0.60%), and other components.
In addition, the process developed in this study has the following advantages:
-
(a)
Since the membrane-based separation process was employed throughout the process, there was hardly any effect on the composition of the milk.
-
(b)
The absence of extra chemicals ensured unaffected physicochemical properties of milk.
-
(c)
The recycling process avoids the generation of waste liquid and ensures the greenness of the process.
However, there are also deficiencies. In the ultrafiltration process, membranes and equipment must be cleaned due to membrane fouling. The long-term operation cannot be carried out, and membranes need to be periodically replaced due to irreversible membrane fouling, making it difficult to achieve industrial mass production. In addition, trace amounts of plant fibers similar in molecular weight to lactose cannot be separated. However, it can be seen from the 95.7% purity of the lactose powder that its content is very low.
3. Conclusions
In this study, a new method combining three membrane technologies (ultrafiltration, electrodialysis, and nanofiltration) was proposed to prepare a low-lactose milk powder instead of enzymatically decomposing lactose. By optimizing the operating parameters, low-lactose milk powder with a lactose content of less than 0.2 and 95.7% of lactose powder can be prepared. This membrane-based approach has an intuitive advantage over conventional methods of producing low-lactose milk powder, such as without adding any chemicals and green cycles throughout the process. However, there are also some shortcomings: due to the presence of membrane fouling, membranes and equipment must be cleaned and cannot be operated for a long time; plant fibers with a molecular weight similar to lactose cannot be isolated.
4. Experimental Section
4.1. Materials
Pasteurized milk (Hangzhou Meijian Co., Ltd.), NaOH, anhydrous Na2SO4, HCl, and other reagents are analytical grade. PES ultrafiltration membrane (3, 5, 8, 10, 20 kDa was from Beijing Zhongke Ruiyang Technology Co., Ltd.), 100 kDa PVC hollow fiber membrane was from Zhejiang Saite Film Technology Co., Ltd., and thin-film composite NF membranes denoted as NF270 were from Dow FilmTec. Commercial CEM-Type II and AEM-Type II were obtained from FUJI Film Corp., Japan.
4.2. UF Process Test
The purpose of ultrafiltration is to retain large molecules such as proteins and fats in the milk. To ensure high flow and low pollution, ultrafiltration is divided into two steps. First, pasteurized milk was filtered through a 100 kDa PVC hollow fiber ultrafiltration membrane with a flow rate of 2 L/min and a pressure of 1 bar to remove fat and casein micelles at room temperature (25 ± 2 °C). The retentate is stored for the preparation of the low-lactose milk powder (all of the samples are refrigerated in a refrigerator at 4 °C). Multiple intermittent discontinuous DF with nine volume concentration factor (VFC) was used to reduce the lactose concentration in the retentate.
Second, permeate obtained in the first step was passed through a food-grade ultrafiltration nanofiltration membrane test system (Hangzhou Parkson Environmental Engineering Co., Ltd., China). Each ultrafiltration cell has an effective area of 67 cm2 and a total of 10 membrane cells. Permeate obtained in the first step was filtered through a membrane test system to retain small-molecule proteins and to filter small molecules like lactose and minerals. Multiple intermittent discontinuous DF with 4 VFC was used to reduce the lactose concentration in the retentate. In addition, pressure (1, 2, 3, and 4 bar) and flow rate (5.6, 6, 7, 8, and 9 L/min), (3, 5, 8, 10, and 20 kDa) PES ultrafiltration membranes were used to investigate to get the optimum flux at room temperature (25 ± 2 °C).
4.3. ED Process Test
The purpose of electrodialysis is for efficient and rapid desalination. The electrodialysis cell used for this experiment was an MP type cell manufactured by Electro Cell Systems AB Company (Zhejiang Saite Film Technology Co., Ltd.) with six CEM and six AEM (Commercial CEM-Type II and AEM-Type II). The effective surface of the ion-exchange membrane is 189 cm2, with one side in contact with the MUP solution (dilute) and the other side in contact with the ionized water (concentrate). Each closed loop is connected to a separate external plastic container, allowing for continuous recirculation. Three percent anhydrous Na2SO4 solution was used as a polar solution, and deionized water was used as a concentrated solution. The flow rate of the concentrating chamber desalination chamber and the polar chamber was 40 L/h, and electrodialysis desalination was performed at room temperature. The relationship between current density and voltage was compared, the desalination effect of the feed liquid at 15–30 V was studied, the conductivity was measured, and the salt rejection rate was calculated by conductivity.
4.4. NF Process Test
The NF equipment, like the second operating unit of the ultrafiltration process, is a food grade NF/UF patch tester with an ultrafiltration process. The purpose of NF is to recover lactose and use only small amounts of sodium salt permeate for the UF process. Due to the high rejection of lactose by nanofiltration, only the effect on membrane flux at a pressure of 5–35 bar is compared here.
4.5. Protein and Lactose Test Analytical Method
In Experimental Section, the protein concentration of emulsifiers was determined by Coomassie Brilliant Blue G-250 and absorbance measurements at UV 595 nm using a 1 cm quartz cuvette.
In Experimental Section, the protein concentration of emulsifiers was determined by GB 5009.8-2016 acid hydrolysis–Rhein–Eaon’s method. Take 20 g of the liquid sample and add protein precipitant (5 mL of zinc acetate and potassium ferrocyanide) in a 250 mL volumetric flask.
4.6. Conductivity
Conductivity was measured using a conductivity meter (model DDBJ-350). Conductivity allows the calculation of the salt rejection rate. The salt rejection rate can be calculated as
| 1 |
where DR is the demineralization rate expressed as a percentage and Xi and Xf are the initial and final conductivities of the diluent, respectively.
Statistical significance: analysis of variance (ANOVA) single factor test with P < 0.05 was used to determine if the differences in a particular set of measured parameters were statistically significant. Each experiment was averaged three times to reduce the error.
Acknowledgments
This research was supported by the National Key Research and Development Plan (No. 2017YFD0400604) and the National Natural Science Foundation of China (No. 21706232).
The authors declare no competing financial interest.
References
- Johnson A. O.; Semenya J. G.; Buchowski M. S.; Enwonwu C. O.; Scrimshaw N. S. Correlation of lactose maldigestion, lactose intolerance, and milk intolerance. Am. J. Clin. Nutr. 1993, 57, 399–401. 10.1093/ajcn/57.3.399. [DOI] [PubMed] [Google Scholar]
- van Scheppingen W. B.; van Hilten P. H.; Vijverberg M. P.; Duchateau L. L. Selective and sensitive determination of lactose in low-lactose dairy products with HPAEC-PAD. J. Chromatogr. B 2017, 1060, 395–399. 10.1016/j.jchromb.2017.06.024. [DOI] [PubMed] [Google Scholar]
- Dekker P. J. T.; Koenders D.; Bruins M. Low lactose milk powder Dairy Products: Market Developments, Production, Nutrition and Health Benefits. Nutrients 2019, 11, 551 10.3390/nu11030551. [DOI] [PMC free article] [PubMed] [Google Scholar]
- Troise A. D.; Bandini E.; Donno R. D.; Meijer G.; Trezzi M.; Fogliano The quality of low lactose milk is affected by the side proteolytic activity of the lactase used in the production process. Food Res. Int. 2016, 89, 514–525. 10.1016/j.foodres.2016.08.021. [DOI] [PubMed] [Google Scholar]
- Rugh S. A comparison of the formation of intermediary products during lactose hydrolysis with free and immobilized thermophilic lactase. Appl. Biochem. Biotechnol. 1982, 7, 27–29. 10.1007/BF02798615. [DOI] [PubMed] [Google Scholar]
- Nath A.; Chakraborty S.; Bhattacharjee C.; Chowdhury R. Studies on the separation of proteins and lactose from casein whey by cross-flow ultrafiltration. Desalin. Water Treat. 2015, 54, 481–501. 10.1080/19443994.2014.888685. [DOI] [Google Scholar]
- Baldasso C.; Barros T. C.; Tessaro I. C. Concentration and purification of whey proteins by ultrafiltration. Desalination 2011, 278, 381–386. 10.1016/j.desal.2011.05.055. [DOI] [Google Scholar]
- Ng C. Y.; Mohammad A. W.; Ng L. Y.; Jahim J. M. Membrane fouling mechanisms during ultrafiltration of skimmed coconut milk. J. Food Eng. 2014, 142, 190–200. 10.1016/j.jfoodeng.2014.06.005. [DOI] [Google Scholar]
- Zhang W.; Jiang F. Membrane fouling in aerobic granular sludge (AGS)-membrane bioreactor (MBR): effect of AGS size. Water Res. 2019, 157, 445–453. 10.1016/j.watres.2018.07.069. [DOI] [PubMed] [Google Scholar]
- Xu Y.; Lebrun R. E. Investigation of the solute separation by charged nanofiltration membrane: effect of pH, ionic strength and solute type. J. Membr. Sci. 1999, 158, 93–104. 10.1016/S0376-7388(99)00005-8. [DOI] [Google Scholar]
- Mohammad A. W.; Takriff M. S. Predicting flux and rejection of multicomponent salts mixture in nanofiltration membranes. Desalination 2003, 157, 105–111. 10.1016/S0011-9164(03)00389-8. [DOI] [Google Scholar]
- Garba Y.; Taha S.; Gondrexon N.; Dorange G. Ion transport modelling through nanofiltration membranes. J. Membr. Sci. 1999, 160, 187–200. 10.1016/S0376-7388(99)00085-X. [DOI] [Google Scholar]
- Atra R.; Vatai G.; Bekassy-Molnar E.; Balint A. Investigation of ultra- and nanofiltration for utilization of whey protein and lactose. J. Food Eng. 2005, 67, 325–332. 10.1016/j.jfoodeng.2004.04.035. [DOI] [Google Scholar]
- Rektor A.; Vatai G. Membrane filtration of Mozzarella whey. Desalination 2004, 162, 279–286. 10.1016/S0011-9164(04)00052-9. [DOI] [Google Scholar]
- Román A.; Wang J.; Csanádi J.; Hodúr C.; Vatai G. Partial demineralization and concentration of acid whey by nanofiltration combined with diafiltration. Desalination 2009, 241, 288–295. 10.1016/j.desal.2007.12.054. [DOI] [Google Scholar]
- Bazinet L.; Lamarche F.; Ippersiel D. Bipolar-membrane electrodialysis: applications of electrodialysis in the food industry. Trends Food Sci. Technol. 1998, 9, 107–113. 10.1016/S0924-2244(98)00026-0. [DOI] [Google Scholar]
- Pan J.; Yu Z.; Ding J.; Gao C.; Bruggen B. V. D.; Shen J. Fluoride removal from water by membrane capacitive deionization with monovalent anion selective membrane. Ind. Eng. Chem. Res. 2018, 57, 7048–7053. 10.1021/acs.iecr.8b00929. [DOI] [Google Scholar]
- Casademont C.; Sistat P.; Ruiz B.; Pourcelly G.; Bazinet L. Electrodialysis of model salt solution containing whey proteins: Enhancement by pulsed electric field and modified cell configuration. J. Membr. Sci. 2009, 328, 238–245. 10.1016/j.memsci.2008.12.013. [DOI] [Google Scholar]
- Bouzid H.; Rabiller-Baudry M.; Paugam L.; Rousseau F.; Derriche Z.; Bettahar N. E. Impact of zeta potential and size of caseins as precursors of fouling deposit on limiting and critical fluxes in spiral ultrafiltration of modified skim milks. J. Membr. Sci. 2008, 314, 67–75. 10.1016/j.memsci.2008.01.028. [DOI] [Google Scholar]
- Kessler H. G.; Gernedel C.; Nakanishi K. The effect of low molecular weight milk constituents on the flux in ultrafiltration. Milchwissenschaft 1982, 37, 584–587. [Google Scholar]
- Charley P.; Saltman P. Chelation of Calcium by Lactose: Its Role in Transport Mechanisms. Science 1963, 139, 1205–1206. 10.1126/science.139.3560.1205. [DOI] [PubMed] [Google Scholar]
- Spiegel T. Whey protein aggregation under shear conditions – effects of lactose and heating temperature on aggregate size and structure. Int. J. Food Sci. Technol. 1999, 34, 523–531. 10.1046/j.1365-2621.1999.00309.x. [DOI] [Google Scholar]
- Ng K. S. Y.; Dunstan D. E.; Martin G. J. O. Influence of diafiltration on flux decline during skim milk ultrafiltration. Int. Dairy J. 2018, 87, 67–74. 10.1016/j.idairyj.2018.07.021. [DOI] [Google Scholar]
- Ding L.; Zhang W.; Ould-Dris A.; Jaffrin M. Y.; Bing T. Concentration of Milk Proteins for Producing Cheese Using a Shear-Enhanced Ultrafiltration Technique. Ind. Eng. Chem. Res. 2016, 55, 11130–11138. 10.1021/acs.iecr.6b02738. [DOI] [Google Scholar]
- Cancino-Madariaga B.; Ruby R.; Castro C. A.; Torrico J. S.; Riquelme M. L. Analysis of the Membrane Fouling Mechanisms Involved in Clarified Grape Juice Ultrafiltration Using Statistical Tools. Ind. Eng. Chem. Res. 2012, 51, 4017–4024. 10.1021/ie201921x. [DOI] [Google Scholar]
- Grenier A.; Meireles M.; Aimar P.; Carvin P. Analysing flux decline in dead-end filtration. Chem. Eng. Res. Des. 2008, 86, 1281–1293. 10.1016/j.cherd.2008.06.005. [DOI] [Google Scholar]
- Xu Z.; Liao J.; Hai T.; Li N. Antifouling polysulfone ultrafiltration membranes with pendent sulfonamide groups. J. Membr. Sci. 2018, 548, 481–489. 10.1016/j.memsci.2017.11.064. [DOI] [Google Scholar]
- Chen W.; Mo J.; Du X.; Zhang Z.; Zhang W. J. Biomimetic Dynamic Membrane for Aquatic Dye Removal. Water Res. 2019, 151, 243–251. 10.1016/j.watres.2018.11.078. [DOI] [PubMed] [Google Scholar]
- Poulin J. F.; Jean A.; Laurent B. Impact of feed solution flow rate on Peptide fractionation by electrodialysis with ultrafiltration membrane. J. Agric. Food Chem. 2008, 56, 2007. 10.1021/jf072813d. [DOI] [PubMed] [Google Scholar]
- Jelen P. Ultrafiltration and microfiltration handbook. Int. Dairy J. 1998, 8, 739–740. [Google Scholar]


