Abstract
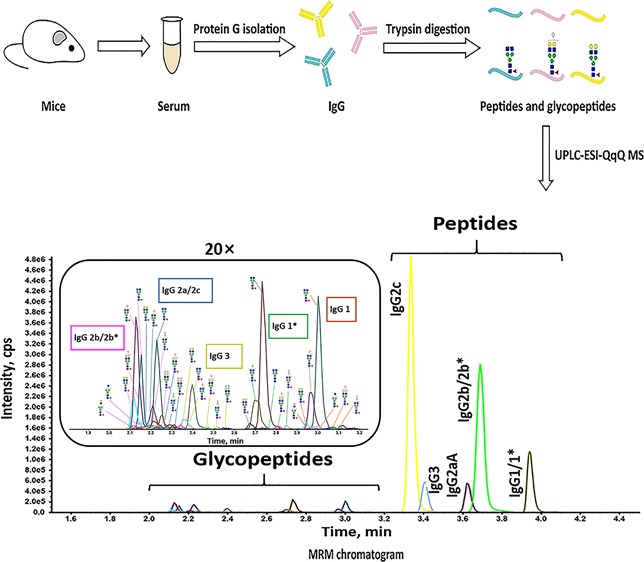
N-Linked glycosylation of the fragment crystallizable (Fc) domain of immunoglobulin G (IgG) is considered a significant modulator of antibody functions, which is known to be subclass-specific. As mice are the most widely used model organisms in immunological research, determining the variation in Fc glycosylation among each murine IgG subclass in different physiological or pathological statuses is beneficial for studying how the IgG subclass effector function is affected by Fc glycosylation. In this study, we established a method to quantify murine IgG Fc glycoforms normalized to the protein abundance at a subclass-specific level for various mouse strains using multiple reaction monitoring. The glycoform level was normalized to the subclass protein abundance (subclass-specific peptide intensity) in each IgG subclass to eliminate the contribution from the subclass protein abundance. Both good linearity and high repeatability of the method were validated by investigating a mixed mouse serum sample. The method was applied to quantify the differences in subclass-specific IgG Fc N-glycoforms between systemic sclerosis (SSc) mice and healthy control mice. The results demonstrated that each IgG subclass had its own characteristic-altered glycosylation, implying the close association of subclass-specific IgG Fc glycosylation with SSc in mice. This report demonstrates a method with great reliability and practicality that has promising potential for the relative quantitation of subclass-specific IgG Fc N-glycoforms in multiple mouse models.
Introduction
Immunoglobulin G (IgG) is a vital immune molecule for homeostasis in organisms. As the most abundant immunoglobulin in circulation, IgG participates in many physiological and pathological processes, including pregnancy,1 diabetes,2 and cancers.3 Glycosylation, an important post-translational modification, impacts the biological functions of IgG by regulating its structure and affinity.4−6 IgG has conserved glycosylation sites on its fragment crystallizable (Fc) region, and the N-linked glycans in these sites affect its interaction with FcγRs or complement.7 Although numerous studies have claimed the important role of IgG glycosylation in physiological and pathological phenomena,8,9 it remains unclear how IgG glycosylation operates.
Mice are the most commonly used experimental subjects in life science studies. Many mouse models have been developed to explore their underlying implication for human life events, such as aging,10,11 cancer,12 and autoimmune diseases.13 Furthermore, mice are often used to study the structure and function of IgG.14,15 Some mechanism studies on IgG glycosylation have been carried out in mouse models.15−17 Different IgG subclasses have different functions,18 which are influenced by the glycans attached to them.19 Thus, it is necessary to elucidate subclass-specific IgG glycosylation in order to study the functions of each murine IgG subclass. Studying the changes in the glycosylation of different IgG subclasses in various mouse models is beneficial to understand how IgG subclasses function. However, there is a lack of methods for quantifying murine IgG Fc glycoforms based on IgG subclasses.
Multiple reaction monitoring (MRM) technology has great capacity for accurate quantitation of low-abundance components in complex mixtures owing to its high sensitivity and selectivity.20 The MRM technology has been applied to the quantitation of subclass-specific human IgG Fc N-glycoforms.21,22 However, murine IgG is different from human IgG in several aspects because of species difference, such as amino acid sequence, spatial structure, subclass type, and glycoform. Human IgG is composed of four types of subclasses: IgG1, IgG2, IgG3, and IgG4. In contrast to human IgG subclasses, the murine IgG subclasses include IgG1, IgG2a/2c, IgG2b, and IgG3.23 IgG1 and IgG2b have their sequence variants IgG1* and IgG2b*, respectively. IgG2a contains two allotypes: IgG2a A allotype (IgG2aA) and IgG2a B allotype (IgG2aB). IgG2a and IgG2c were reported as the allelic variants in most mouse strains.24 The allotypes of IgG subclasses may be different in different murine strains.23,25 For example, IgG2c was observed in the C57BL/6 mouse serum, while the BALB/c mouse serum had IgG2aA but not IgG2c.23 In addition, Swiss Webster mice may secrete only IgG2a or IgG2c or both IgG2a and IgG2c.24 Mice mainly express IgG with N-glycolylneuraminic acid, but the sialic acid on human IgG is solely N-acetylneuraminic acid.25,26 In addition, α-1,3-galactosylation is a special trait of murine IgG Fc glycosylation.25,27 Therefore, the development of MRM methods suitable for the determination of Fc N-glycoform levels for murine IgG subclasses is yet needed.
The level of IgG glycosylation is determined by the abundance of both proteins and attached glycans. To quantify the glycoform at the subclass protein level, it is essential to separate out the contribution from subclass protein abundance. In this study, we developed a subclass-specific IgG Fc N-glycoform quantitation method for various mouse strains based on MRM. Subclass-specific peptides and Fc N-glycopeptides of almost all the reported murine IgG subclasses could be monitored in this method. First, peptides specific to each murine IgG subclass were identified by quadrupole time-of-flight (QTOF) mass spectrometry (MS). Then, the MRM method was built by monitoring the subclass-specific IgG peptides and Fc N-glycopeptides simultaneously. The subclass-specific IgG Fc N-glycoform level is gained after normalization of glycopeptide intensity to the subclass-specific peptide intensity by eliminating the contribution from the subclass protein abundance. In this way, each subclass- and site-specific N-glycoform of IgG can be compared independently in different samples. The trypsin digest of IgG was directly analyzed by the MRM method without any purification. The protocol displayed high repeatability and good linearity. Furthermore, the quantitation method was successfully applied to the investigation of the subclass-specific IgG Fc N-glycoform changes in a bleomycin (BLM)-induced systemic sclerosis (SSc) mouse model compared to healthy control mice.
Results and Discussion
Identification of Peptides Specific to Murine IgG Subclasses
To elucidate the peptides specific to each murine IgG subclass, we first measured the peptides from the trypsin digestion of mouse IgG standard by nanohigh performance liquid chromatography (NanoHPLC)-electrospray ionization (ESI)-QTOF MS/MS in the parallel accumulation-serial fragmentation (PASEF) mode. IgG1 (UniProt entry, P01868), IgG1* variant (A0A075B5P4), IgG2aA (P01863), IgG2b (P01867), and IgG2c (A0A0A6YY53) were identified in the IgG standard. Other subclasses were not detected in the mouse IgG standard. Hence, IgG from the C57BL/6 serum was detected for more subclass information, and we identified IgG1, IgG1* variant, IgG2b* variant (A0A075B5P3), IgG2c, and IgG3 (A0A075B5P5), consistent with the previously reported results.23 By combining the results obtained for the mouse IgG standard and IgG from the C57BL/6 mouse serum, specific peptide candidates for each IgG subclass were determined to be DVLTITLTPK and VNSAAFPAPIEK for IgG1/1*, DLPAPIER and NTEPVLDSDGSYFMYSK for IgG2aA, DLPSPIER and TDSFSCNVR for IgG2b/2b*, ALPSPIEK and NTATVLDSDGSYFMYSK for IgG2c, and ALPAPIER and NTPPILDSDGTYFLYSK for IgG3. In the subclass-specific peptide selection procedure, peptides containing no post-translational modifications and relatively stable amino acids were chosen,21 which promoted the repeatability of the MRM quantitation method by reducing the variations arising from sample pretreatment and MS analysis. IgG2aB (P01864) was not detected in this study or in a previous study.23
Quantitation of Subclass-Specific IgG Fc N-Glycoforms
MRM Transitions for Subclass-Specific IgG Peptides and Fc N-Glycopeptides
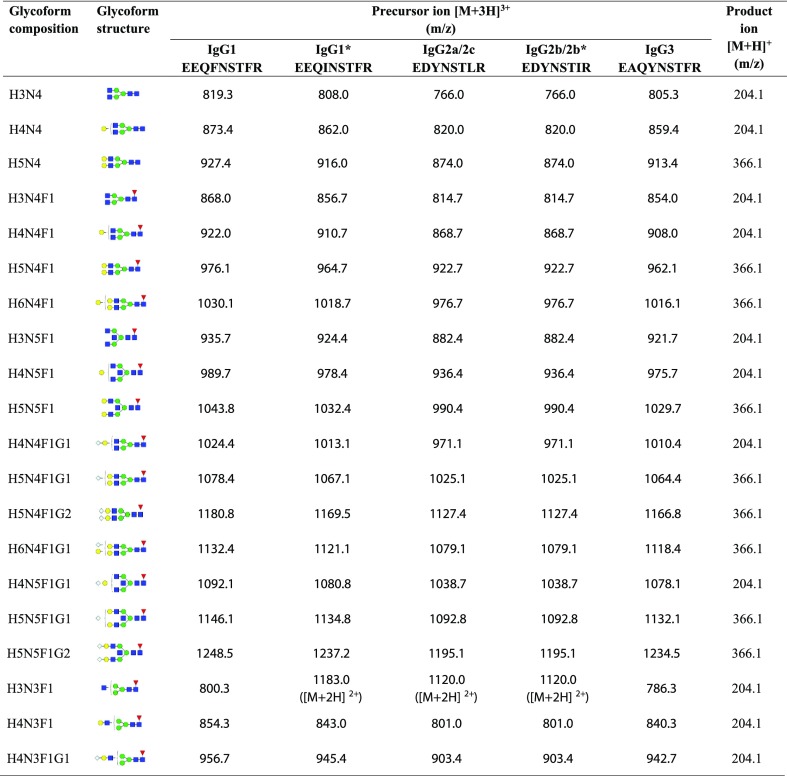
To find the optimal fragment ions with good sensitivity and specificity in the MRM mode, the fragmentation patterns of subclass-specific peptides were investigated by ultraperformance liquid chromatography (UPLC)-ESI-triple quadrupole (QqQ) MS/MS based on MRM analysis. In this analysis, the peptides DVLTITLTPK for IgG1/1*, NTEPVLDSDGSYFMYSK for IgG2aA, NTATVLDSDGSYFMYSK for IgG2c, and NTPPILDSDGTYFLYSK for IgG3 were observed to be strongly retained during LC, and they could not be removed entirely in the washing step. Moreover, the intensity of the peptide TDSFSCNVR for IgG2b/2b* was relatively weak. Threonine in these peptides can be potentially phosphorylated. For accurate quantitation, these five peptides were not involved in the MRM method. Tandem spectra of the peptides specific to IgG subclasses used for MRM analysis are shown in Figure S1. The most abundant fragment ions from the fragment ion candidates after the optimization of collision energy were selected as the product ions of these subclass-specific peptides for MRM analysis. The N-glycan compositions and the corresponding glycopeptide precursors were used according to the related references,25 and the oxonium ions were m/z 204.1 (HexNAc) or 366.1 (Hex1HexNAc1), which are typical fragment ions of glycans.21 To ensure the accuracy of the analytical results, the twenty most abundant glycoforms were involved in this study after preliminary detection and analysis. The MRM transitions for the subclass-specific IgG peptides and Fc N-glycopeptides are listed in Tables 1 and 2, respectively.
Table 1. MRM Transitions for Murine IgG Subclass Monitoring.
| IgG subclass | peptide | precursor ion [M + 2H]2+ (m/z) | product ion [M + H]+ (m/z) |
|---|---|---|---|
| IgG1/1* | VNSAAFPAPIEK | 622.3 | 654.4 |
| IgG2aA | DLPAPIER | 455.8 | 514.3 |
| IgG2c | ALPSPIEKa | 427.8 | 335.7 ([M + 2H]2+) |
| IgG2b/2b* | DLPSPIER | 463.8 | 698.4 |
| IgG3 | ALPAPIER | 433.8 | 682.4 |
ALPSPIEK exists in both IgG2c and IgG2aB.23
Table 2. MRM Transitions for Murine IgG Fc N-Glycopeptide Monitoringa.
Structure abbreviations: H, hexose; N, HexNAc; F, fucose; and G, N-glycolylneuraminic acid. Structural symbols: blue square: N-acetylglucosamine; green circle: mannose; red triangle: fucose; yellow circle: galactose; and white diamond: N-glycolylneuraminic acid.
MRM Analysis of Subclass-Specific IgG Peptides and Fc N-Glycopeptides
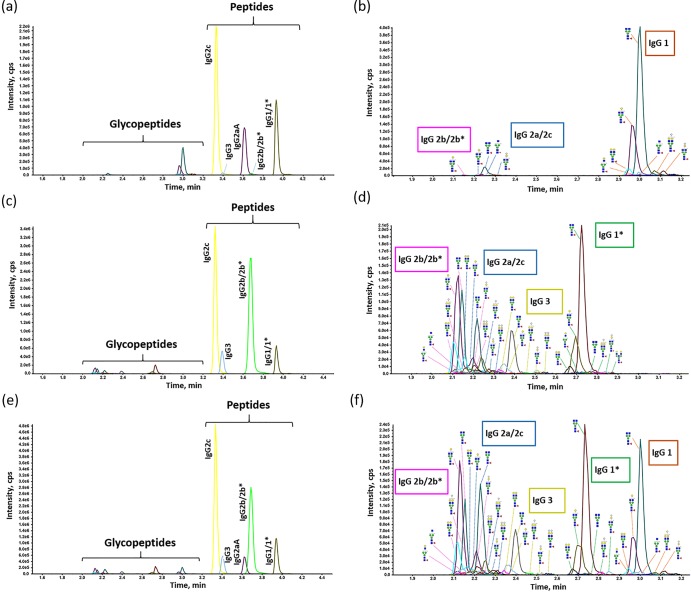
The mouse IgG standard and IgG from the C57BL/6 serum were detected by MRM analysis. Their total MRM chromatograms are shown in Figure 1a–d. The mouse IgG standard contained the peptides VNSAAFPAPIEK for IgG1/1*, DLPAPIER for IgG2aA, ALPSPIEK for IgG2c, DLPSPIER for IgG2b/2b*, and ALPAPIER for IgG3, which were not detected by NanoHPLC-ESI-QTOF MS/MS analysis. Only N-glycopeptides coming from IgG1, IgG2b/2b*, and IgG2a/2c were monitored, and IgG1 had more glycoforms than other subclasses. Compared with the mouse IgG standard, IgG from the C57BL/6 mouse serum showed differences in some parts. Except for the peptide for IgG2aA, all other peptides were detected, as well as glycopeptides from IgG1*, IgG2b/2b*, IgG2a/2c, and IgG3. Neither the mouse IgG standard nor the IgG from the C57BL/6 mouse serum covers all reported types of murine IgG subclasses. To monitor and investigate the subclass-specific peptides and Fc N-glycopeptides of all reported IgG subclasses, the mixed mouse serum was prepared by adding the mouse IgG standard to the C57BL/6 mouse serum. The MRM results revealed that the peptides and N-glycopeptides specific to almost all the reported IgG subclasses could be detected in the IgG purified from the mixed mouse serum (Figure 1e,f).
Figure 1.
MRM chromatograms for the trypsin-digested murine IgG. (a) MRM chromatograms for the subclass-specific peptides and N-glycopeptides from the trypsin-digested mouse IgG standard. (b) Enlarged detail of the glycopeptide part in (a). (c) MRM chromatograms for the subclass-specific peptides and N-glycopeptides from the trypsin-digested IgG from a C57BL/6 mouse serum sample. (d) Enlarged detail of the glycopeptide part in (c). (e) MRM chromatograms for the subclass-specific peptides and N-glycopeptides from the trypsin-digested IgG from the mixed mouse serum sample. (f) Enlarged detail of the glycopeptide part in (e). Structural symbols: blue square: N-acetylglucosamine; green circle: mannose; red triangle: fucose; yellow circle: galactose; and white diamond: N-glycolylneuraminic acid.
IgG Fc N-glycopeptides eluted earlier than most subclass-specific peptides. All the five peptides eluted in 3.2–4.2 min. Amino acid sequences of peptide moieties in N-glycopeptides are similar between IgG2a/2c and IgG2b/2b*, EDYNSTLR for IgG2a/2c, and EDYNSTIR for IgG2b/2b*, and their masses are identical. However, the IgG2a/2c and IgG2b/2b* N-glycopeptides eluted at different times because of their discrepancy in hydrophobicity. The IgG2a/2c N-glycopeptides eluted slightly later than those from IgG2b/2b*.25 The IgG2a/2c and IgG2b/2b* N-glycopeptides could not be detected individually, which was also reported by de Haan et al.25 Therefore, the same glycoforms from IgG2a/2c and IgG2b/2b* were treated as one glycoform in the following analysis, and the average elution time for IgG2 N-glycopeptides was 2.2 min. After IgG2 N-glycopeptides, the IgG3, IgG1*, and IgG1 N-glycopeptides eluted in 2.4, 2.8, and 3.0 min, respectively. Forty-two N-glycopeptides were monitored: 10 for IgG1, 9 for IgG1*, 17 for IgG2, and 6 for IgG3 (Figure 2).
Figure 2.
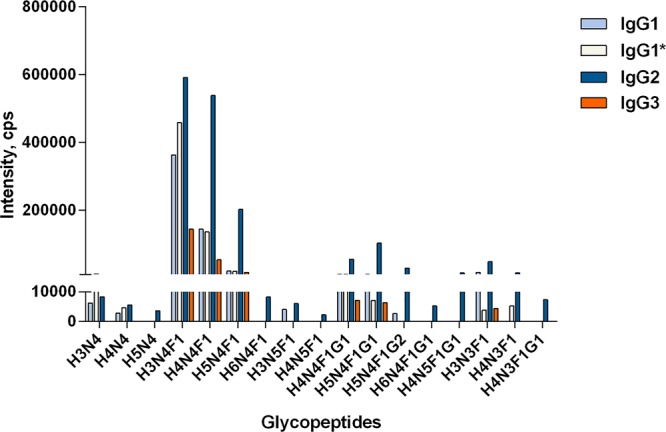
Representative profile of the subclass-specific IgG Fc N-glycopeptides from the mixed mouse serum sample. Structure abbreviations: H, hexose; N, HexNAc; F, fucose; and G, N-glycolylneuraminic acid.
Subclass-Specific IgG Fc N-Glycoform Quantitation
In this analysis, subclass-specific IgG N-glycoforms were determined by eliminating the contribution from the subclass protein abundances. The relative intensity of each glycopeptide could be calculated individually, which allowed the assessment of glycosylation differences among different samples. The subclass-specific IgG glycopeptide signals were normalized to the corresponding subclass protein abundance (signal of a specific peptide).21
The formula for glycoform quantitation calculation is shown as follows
IgG1 and IgG1* shared the same peptide, thus the sum of signals of glycopeptides, which had the identical glycoform as IgG1 and IgG1*, was normalized to the peptide signal from IgG1/1*. Despite the fact that the glycopeptides from IgG1 and IgG1* were quantified together, their response factors might be different. IgG2 glycopeptide signals were normalized to the sum of peptide signals from IgG2aA, IgG2c, and IgG2b/2b*. IgG3 glycopeptide signals were normalized to the IgG3 peptide signal.
Linearity of the Method
To evaluate the linearity of the subclass-specific peptides and N-glycopeptides in this method, a serial dilution of serum was assessed. A mixed mouse serum was diluted from 1× to 1024×. High linearity was observed for each subclass-specific peptide in a 32-fold dilution range with R2 ≥ 0.9990 (Figure S2). Glycopeptide intensities were lower than peptide intensities. The glycopeptide with H3N4F1, the most abundant N-glycopeptide in each IgG subclass, showed high linearity in a 16-fold dilution range with R2 > 0.9930 (Figure S3). The eight most abundant N-glycopeptides presented good linearity in a 16-fold dilution range with R2 > 0.9930, including IgG1-H3N4F1, IgG1-H4N4F1, IgG1*-H3N4F1, IgG1*-H4N4F1, IgG2-H3N4F1, IgG2-H4N4F1, IgG2-H5N4F1, and IgG3-H3N4F1.
Repeatability of the Method
Good method stability is critical for the quantitation in large-scale samples. To evaluate the repeatability of the method, the intraday stability of the instrument and the intraday and interday method reproducibility were estimated. Glycoform levels of IgG from the mixed mouse serum sample were analyzed in this validation, including variations from peptides as well as from glycopeptides. These 42 glycopeptides yielded 11, 17, and 6 glycoforms for IgG1/1*, IgG2, and IgG3, respectively (Figure 3). The co-efficient of variations (CVs) for glycoforms obtained during the intraday instrument assay, intraday method assay, and interday method assay ranged from 2.40 to 19.47, 2.27 to 14.49, and 1.27 to 18.97%, respectively (Table S1). The CVs were less than 15% in over 76% of the glycoforms and less than 20% in all glycoforms, demonstrating the high repeatability of the method, which ensures its accuracy.
Figure 3.
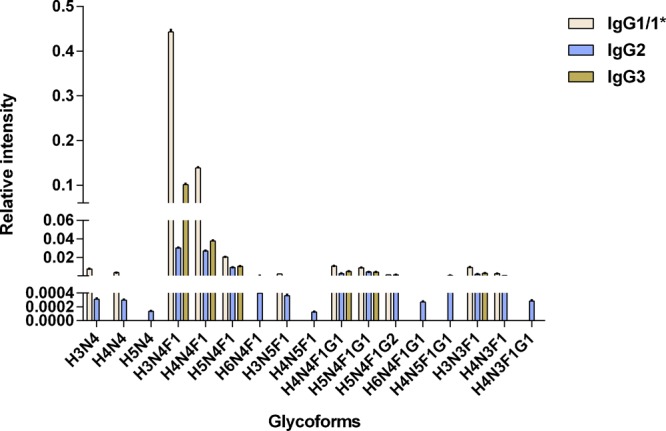
Distribution of the subclass-specific IgG Fc glycoforms (normalized glycopeptide intensities) from the mixed mouse serum samples. Structure abbreviations: H, hexose; N, HexNAc; F, fucose; and G, N-glycolylneuraminic acid.
Application in the SSc Mouse Model
SSc is an autoimmune disease causing fibrosis of the skin and internal organs. IgG, as a key component of the immune system, is involved in many autoimmune diseases.28,29 Studying the glycosylation in different IgG subclasses may provide insights into the association of IgG glycosylation with SSc.
In this study, the developed method was further applied to evaluate the differences in subclass-specific IgG Fc N-glycoform levels between the BLM group and the control group. The SSc mouse model was verified by examining the skin thickness, its collagen content, and expression levels of extracellular matrix-related genes (Figure S4), as described before.30 Ten IgG1* glycopeptides, 17 IgG2 glycopeptides, and 7 IgG3 glycopeptides were detected (Figure S5), as well as peptides specific to IgG1/1*, IgG2c, IgG2b/2b*, and IgG3. In total, 10 IgG1/1*, 17 IgG2, and 7 IgG3 glycoform levels were obtained.
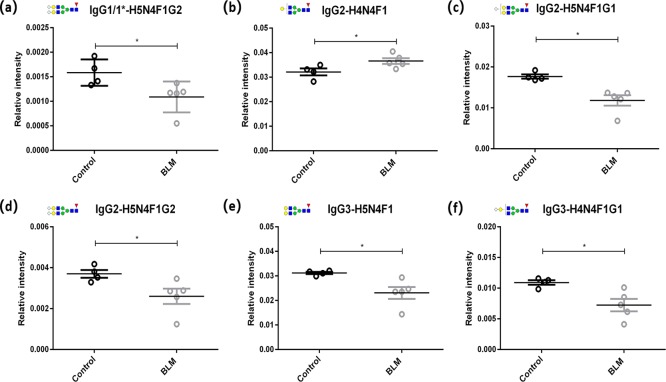
Six glycoform levels presented significant differences between the two groups (Figure 4). The relative intensity of the glycoform with H5N4F1G2 in IgG1/1* was lower in the BLM group than in the control group (Figure 4a, p = 0.0275). Compared to the control group, the BLM group showed a higher level of the H4N4F1 glycoform (Figure 4b, p = 0.0275) and lower levels of H5N4F1G1 and H5N4F1G2 glycoforms in IgG2 (Figure 4c, H5N4F1G1: p = 0.0143; Figure 4d, H5N4F1G2: p = 0.0275). Remarkable reductions in the levels of IgG3-H5N4F1 and H4N4F1G1 were observed in the BLM group compared to the control group (Figure 4e, H5N4F1: p = 0.0143; Figure 4f, H4N4F1G1: p = 0.0275). The changes in other glycoforms were not significant. In addition, the derived glycosylation traits were calculated according to the structural features (Table S2). IgG2 sialylation and IgG3 galactosylation levels were found to decrease in the BLM group (Figure S6, IgG2 sialylation: p = 0.0143; IgG3 galactosylation: p = 0.0275).
Figure 4.
Changes in IgG Fc N-glycoforms in the murine SSc model. Six glycoform levels were significantly different between the BLM group (n = 5) and the control group (n = 4). (a) H5N4F1G2 level in IgG1/1*. (b–d) H4N4F1, H5N4F1G1, and H5N4F1G2 levels in IgG2. (e,f) H5N4F1 and H4N4F1G1 levels in IgG3. Structure abbreviations: H, hexose; N, HexNAc; F, fucose; and G, N-glycolylneuraminic acid. Structural symbols: blue square: N-acetylglucosamine; green circle: mannose; red triangle: fucose; yellow circle: galactose; and white diamond: N-glycolylneuraminic acid. P-values for comparisons between the BLM group and the control group were from Mann–Whitney U tests. *P < 0.05.
The Fc N-glycosylation of different IgG subclasses exhibited differences in the SSc mouse model. IgG3 Fc galactosylation decreased in the SSc mice, which was consistent with the decrease of the IgG galactosylation level in human SSc.31 Activation of the complement and pro-inflammation is affected by IgG without terminal galactose.32 Reduced IgG Fc sialylation triggering pro-inflammation was also observed in the mouse models of rheumatoid arthritis.17 Thus, the decrease of IgG2 Fc sialylation might contribute to inflammation in SSc mice. Structures of these changed glycopeptides can be identified by MS/MS analysis for further study. These findings revealed that the N-glycosylation alteration of IgG Fc was subclass-specific, which might be related to the subclass-specific functions of IgG in SSc.
Conclusions
In this study, we presented a reliable method for subclass-specific murine IgG Fc N-glycoform quantitation using MRM. The method was designed for quantifying subclass-specific IgG Fc N-glycoforms in various mouse strains. When the subclass-specific IgG Fc N-glycopeptide intensities were normalized to the subclass-specific peptide intensities, the glycoform levels in individual samples could be compared without the contribution from the subclass protein abundance. The method showed high repeatability and good linearity, which covers almost all the reported murine IgG subclasses. We applied the method to a SSc mouse model and found some significant alterations in subclass-specific IgG Fc N-glycoforms. This quantitation method is of value in exploring IgG glycosylation and its mechanisms in multiple mouse models.
Experimental Section
Chemicals and Reagents
Mouse IgG standard, ammonium bicarbonate (NH4HCO3), dithiothreitol (DTT), and iodoacetamide (IAA) were purchased from Sigma-Aldrich (St. Louis, MO, USA). Sequencing grade-modified trypsin was purchased from Promega (Madison, WI, USA). Formic acid (FA) and acetonitrile (ACN) were purchased from Merck Millipore (Billerica, MA, USA). BLM was purchased from Nippon Kayaku (Tokyo, Japan).
Mouse Samples
A serum sample was obtained from C57BL/6 mice (aged 24–32 weeks). The 4 week-old C57BL/6 mice were purchased from Shanghai Laboratory Animal Center of Chinese Academy Sciences.
In the SSc mouse model experiment, male C57BL/6 mice were purchased from the Fudan University Animal Center. Seven week-old mice were used for the study of skin fibrosis. Mice were randomly divided into two groups: control group and BLM group. In the BLM group (n = 5), subcutaneous injections of 100 μL of BLM (1 mg/mL) were administered daily on the upper back of the mice for 4 weeks, while mice in the control group (n = 4) received equal volumes of saline. All the mice were anesthetized and killed 4 weeks after BLM administration. Histological analysis, collagen measurement, and detection of extracellular matrix-related gene expression levels were performed, as described before.30
The mice were housed under constant temperature and humidity with a 12 h light/dark cycle. Animal care and experiments were approved by the Institutional Animal Care and Use Committee of Fudan University.
Mixed Mouse Serum Preparation
Mixed mouse serum was prepared by mixing the mouse IgG standard and the C57BL/6 mouse serum at the ratio of 1:1 (μg/μL).
Isolation of IgG
IgG was captured from 10 μL of mouse serum or mixed mouse serum by Protein G Bestarose 4FF beads (Bestchrom, Shanghai, China). The mouse serum was diluted with phosphate-buffered saline (PBS) and incubated with the beads for 30 min. The beads were washed with PBS and nanopure water. IgG was eluted by 100 μL of 100 mM FA followed by vacuum drying at room temperature.
Trypsin Digestion of IgG
Mouse IgG standard or dried IgG from mouse serum was dissolved in 40 μL of 50 mM NH4HCO3 (freshly made). IgG was reduced using 2 μL of 550 mM DTT in 50 mM NH4HCO3 at 60 °C for 1 h. IgG was alkylated with 4 μL of 450 mM IAA in 50 mM NH4HCO3 at room temperature in the dark for 40 min. Then, IgG was digested with 0.5 μg of trypsin at 37 °C for 18 h.
NanoHPLC-ESI-QTOF MS Analysis
Peptides from the mouse IgG standard and the C57BL/6 mouse serum IgG were identified, respectively. After purification by Sep-Pak C18 1 cm3 Vac Cartridge (Waters, Milford, MA, USA), the peptides from trypsin digestion were measured by hybrid trapped ion mobility spectrometry—QTOF mass spectrometer (timsTOF Pro, Bruker Daltonics, Bremen, Germany) with a modified nanoelectrospray ion source (CaptiveSpray, Bruker Daltonics, Bremen, Germany) coupled to a NanoHPLC chromatography system (NanoElute, Bruker Daltonics, Bremen, Germany) equipped with a C18 column (1.7 μm, 25 cm × 75 μm, IonOpticks, Australia). A 9 min LC separation was applied using a binary gradient at 50 °C with 300 nL/min flow rate consisting of solvent A [0.1% FA in nanopure water (v/v)] and solvent B [0.1% FA in ACN(v/v)]: 0 min at 2.0% B; 2.0 min at 10.0% B; 7.0 min at 40.0% B; 8.0 min at 98.0% B; and 9.0 min at 98.0% B.
The MS acquisition was operated in the PASEF mode with the following parameters: drying gas temperature: 180 °C, drying gas flow rate: 3.0 L/min, capillary: 1.4 kV, and mass range: 100–1700 m/z. In MS/MS settings, the total cycle time for precursor ions was 1.1 s, the number of MS/MS ramps was 10 PASEF scan@100 ms, the spectral rate was >100 Hz, and active exclusion was released after 0.4 min (reconsider precursor, if the current intensity/previous intensity ≥4).
UPLC-ESI-QqQ MS Analysis
Ten microliters of the trypsin digest of IgG were used directly for UPLC-ESI-QqQ analysis with no purification. Quantitative analysis was performed on a Nexera UPLC LC-30A system (Shimadzu Corporation, Kyoto, Japan) coupled with a 6500 plus Qtrap mass spectrometer (AB Sciex, CA, USA). The analysis was controlled using AB Sciex Analyst software (version 1.6.3). A ZORBAX RRHD Eclipse Plus C18 column (1.8 μm, 2.1 mm × 100 mm, Agilent Technologies, Santa Clara, CA) was applied for UPLC separation. Peptides and glycopeptides were separated by a binary gradient at 40 °C with 0.5 mL/min flow rate consisting of solvent A [0.1% FA and 3% ACN in nanopure water (v/v/v)] and solvent B [0.1% FA and 90% ACN in nanopure water (v/v/v)]: 0 min at 2.0% B; 0.5–1.0 min at 8.0% B; 6.0 min at 35.0% B; 6.1–8.0 min at 100.0% B (washing column); and 8.1–10.0 min at 2.0% B (re-equilibration).
The MS was operated in the positive mode. Curtain gas: 30.0 psi, collision gas: high, ion spray voltage: 5500.0 V, temperature: 300.0 °C, ion source gas 1: 55.0 psi, ion source gas 2: 60.0 psi, declustering potential: 20.0 V, entrance potential: 10.0 V, and collision cell exit potential: 14 V. The scheduled MRM mode was used. Q1 and Q3 were set to unit resolution. The cycle time was fixed to 500 ms, MRM detection window was set to 30.0 s, and the target scan time was 0.5 s. CE for each MRM transition was optimized by a 5 V step followed by 2 V step fine-tuning.
Data Processing and Statistical Analysis
In NanoHPLC-ESI-QTOF MS analysis, raw data were processed by PEAKS studio (version X, Bioinformatics Solution Inc.). MS and MS/MS tolerance were set to 10 ppm and 0.02 Da, separately. Carbamidomethyl (C) was set as fixed modification, and oxidation (M) and acetylation (protein N-terminal) were set as variable modifications. A home-made database containing six IgG protein sequences was used. Search results were corrected to 1% PSM FDR.
In MRM analysis, data processing was achieved by AB Sciex MultiQuant software (version 3.0.2). Intensities of peak areas were used for quantification. The limit of quantification was set as the signal-to-noise ratio (S/N) of 10.
Statistical analysis was performed using IBM SPSS Statistics 20 and GraphPad Prism 6 in this study. Mann–Whitney U tests were used to assess the glycosylation differences. The multiple testing of glycosylation between the BLM and control mice groups was not with correction.
Acknowledgments
We gratefully acknowledge financial support from the National Key Research and Development Program of China (2016YFA0501304, 2018YFC0910300, 2016YFC1303100) and National Natural Science Foundation of China (31770858, 31630088). We gratefully thank Bruker Daltonics Company for letting us use their NanoHPLC-ESI-QTOF MS and for technical support.
Supporting Information Available
The Supporting Information is available free of charge at https://pubs.acs.org/doi/10.1021/acsomega.9b04412.
Tandem spectra of specific peptides of IgG subclasses acquired by UPLC-ESI-QqQ MS/MS, linear regression graphs for subclass-specific IgG peptide quantitation, linear regression graphs for IgG Fc glycopeptide-H3N4F1 quantitation, skin fibrosis in a BLM-induced SSc mouse model, distribution of subclass-specific IgG Fc N-glycopeptides from the murine SSc model, and changes in the derived glycosylation traits between the BLM group (n = 5) and the control group (n = 4). Tables: intraday stability of the instrument and intraday and interday reproducibility of the method; derived glycosylation trait calculations (PDF)
The authors declare no competing financial interest.
Supplementary Material
References
- Malek A. Role of IgG antibodies in association with placental function and immunologic diseases in human pregnancy. Expet Rev. Clin. Immunol. 2013, 9, 235–249. 10.1586/eci.12.99. [DOI] [PubMed] [Google Scholar]
- Nakao Y.; Matsumoto H.; Miyazaki T.; Mizuno N.; Arima N.; Wakisaka A.; Okimoto K.; Akazawa Y.; Tsuji K.; Fujita T. IgG heavy-chain (Gm) allotypes and immune response to insulin in insulin-requiring diabetes mellitus. N. Engl. J. Med. 1981, 304, 407–409. 10.1056/nejm198102123040706. [DOI] [PubMed] [Google Scholar]
- Negroni M. P.; Fiszman G. L.; Azar M. E.; Morgado C. C.; Español A. J.; Pelegrina L. T.; de la Torre E.; Sales M. E. Immunoglobulin G from breast cancer patients in stage I stimulates muscarinic acetylcholine receptors in MCF7 cells and induces proliferation. Participation of nitric oxide synthase-derived nitric oxide. J. Clin. Immunol. 2010, 30, 474–484. 10.1007/s10875-010-9370-0. [DOI] [PubMed] [Google Scholar]
- Tao M. H.; Morrison S. L. Studies of aglycosylated chimeric mouse-human IgG. Role of carbohydrate in the structure and effector functions mediated by the human IgG constant region. J. Immunol. 1989, 143, 2595–2601. [PubMed] [Google Scholar]
- Krapp S.; Mimura Y.; Jefferis R.; Huber R.; Sondermann P. Structural analysis of human IgG-Fc glycoforms reveals a correlation between glycosylation and structural integrity. J. Mol. Biol. 2003, 325, 979–989. 10.1016/s0022-2836(02)01250-0. [DOI] [PubMed] [Google Scholar]
- Ju M.-S.; Na J.-H.; Yu Y. G.; Kim J.-Y.; Jeong C.; Jung S. T. Structural consequences of aglycosylated IgG Fc variants evolved for FcgammaRI binding. Mol. Immunol. 2015, 67, 350–356. 10.1016/j.molimm.2015.06.020. [DOI] [PubMed] [Google Scholar]
- Raju T. S. Terminal sugars of Fc glycans influence antibody effector functions of IgGs. Curr. Opin. Immunol. 2008, 20, 471–478. 10.1016/j.coi.2008.06.007. [DOI] [PubMed] [Google Scholar]
- de Haan N.; Reiding K. R.; Driessen G.; van der Burg M.; Wuhrer M. Changes in Healthy Human IgG Fc-Glycosylation after Birth and during Early Childhood. J. Proteome Res. 2016, 15, 1853–1861. 10.1021/acs.jproteome.6b00038. [DOI] [PubMed] [Google Scholar]
- Ren S.; Zhang Z.; Xu C.; Guo L.; Lu R.; Sun Y.; Guo J.; Qin R.; Qin W.; Gu J. Distribution of IgG galactosylation as a promising biomarker for cancer screening in multiple cancer types. Cell Res. 2016, 26, 963–966. 10.1038/cr.2016.83. [DOI] [PMC free article] [PubMed] [Google Scholar]
- Ackert-Bicknell C. L.; Anderson L. C.; Sheehan S.; Hill W. G.; Chang B.; Churchill G. A.; Chesler E. J.; Korstanje R.; Peters L. L. Aging Research Using Mouse Models. Curr. Protoc. Mouse Biol. 2015, 5, 95–133. 10.1002/9780470942390.mo140195. [DOI] [PMC free article] [PubMed] [Google Scholar]
- Hause F.; Schlote D.; Simm A.; Hoffmann K.; Santos A. N. Accumulation of glycated proteins suggesting premature ageing in lamin B receptor deficient mice. Biogerontology 2018, 19, 95–100. 10.1007/s10522-017-9733-5. [DOI] [PubMed] [Google Scholar]
- El-Shemi A. G.; Ashshi A. M.; Na Y.; Li Y.; Basalamah M.; Al-Allaf F. A.; Oh E.; Jung B. K.; Yun C. O. Combined therapy with oncolytic adenoviruses encoding TRAIL and IL-12 genes markedly suppressed human hepatocellular carcinoma both in vitro and in an orthotopic transplanted mouse model. J. Exp. Clin. Canc. Res. 2016, 35, 74. 10.1186/s13046-016-0353-8. [DOI] [PMC free article] [PubMed] [Google Scholar]
- Mizuochi T.; Hamako J.; Nose M.; Titani K. Structural changes in the oligosaccharide chains of IgG in autoimmune MRL/Mp-lpr/lpr mice. J. Immunol. 1990, 145, 1794–1798. [PubMed] [Google Scholar]
- Tjon A. S.; van Gent R.; Geijtenbeek T. B.; Kwekkeboom J. Differences in Anti-Inflammatory Actions of Intravenous Immunoglobulin between Mice and Men: More than Meets the Eye. Front. Immunol. 2015, 6, 197. 10.3389/fimmu.2015.00197. [DOI] [PMC free article] [PubMed] [Google Scholar]
- Jones M. B.; Oswald D. M.; Joshi S.; Whiteheart S. W.; Orlando R.; Cobb B. A. B-cell-independent sialylation of IgG. Proc. Natl. Acad. Sci. U.S.A. 2016, 113, 7207–7212. 10.1073/pnas.1523968113. [DOI] [PMC free article] [PubMed] [Google Scholar]
- Kao D.; Lux A.; Schaffert A.; Lang R.; Altmann F.; Nimmerjahn F. IgG subclass and vaccination stimulus determine changes in antigen specific antibody glycosylation in mice. Eur. J. Immunol. 2017, 47, 2070–2079. 10.1002/eji.201747208. [DOI] [PubMed] [Google Scholar]
- Ohmi Y.; Ise W.; Harazono A.; Takakura D.; Fukuyama H.; Baba Y.; Narazaki M.; Shoda H.; Takahashi N.; Ohkawa Y.; Ji S.; Sugiyama F.; Fujio K.; Kumanogoh A.; Yamamoto K.; Kawasaki N.; Kurosaki T.; Takahashi Y.; Furukawa K. Sialylation converts arthritogenic IgG into inhibitors of collagen-induced arthritis. Nat. Commun. 2016, 7, 11205. 10.1038/ncomms11205. [DOI] [PMC free article] [PubMed] [Google Scholar]
- Collins A. M. IgG subclass co-expression brings harmony to the quartet model of murine IgG function. Immunol. Cell Biol. 2016, 94, 949–954. 10.1038/icb.2016.65. [DOI] [PubMed] [Google Scholar]
- Nimmerjahn F.; Ravetch J. V. Divergent immunoglobulin g subclass activity through selective Fc receptor binding. Science 2005, 310, 1510–1512. 10.1126/science.1118948. [DOI] [PubMed] [Google Scholar]
- Lange V.; Picotti P.; Domon B.; Aebersold R. Selected reaction monitoring for quantitative proteomics: a tutorial. Mol. Syst. Biol. 2008, 4, 222. 10.1038/msb.2008.61. [DOI] [PMC free article] [PubMed] [Google Scholar]
- Hong Q.; Lebrilla C. B.; Miyamoto S.; Ruhaak L. R. Absolute quantitation of immunoglobulin G and its glycoforms using multiple reaction monitoring. Anal. Chem. 2013, 85, 8585–8593. 10.1021/ac4009995. [DOI] [PMC free article] [PubMed] [Google Scholar]
- Yuan W.; Sanda M.; Wu J.; Koomen J.; Goldman R. Quantitative analysis of immunoglobulin subclasses and subclass specific glycosylation by LC-MS-MRM in liver disease. J. Proteonomics 2015, 116, 24–33. 10.1016/j.jprot.2014.12.020. [DOI] [PMC free article] [PubMed] [Google Scholar]
- Maresch D.; Altmann F. Isotype-specific glycosylation analysis of mouse IgG by LC-MS. Proteomics 2016, 16, 1321–1330. 10.1002/pmic.201500367. [DOI] [PubMed] [Google Scholar]
- Zhang Z.; Goldschmidt T.; Salter H. Possible allelic structure of IgG2a and IgG2c in mice. Mol. Immunol. 2012, 50, 169–171. 10.1016/j.molimm.2011.11.006. [DOI] [PubMed] [Google Scholar]
- de Haan N.; Reiding K. R.; Kristic J.; Hipgrave Ederveen A. L.; Lauc G.; Wuhrer M. The N-Glycosylation of Mouse Immunoglobulin G (IgG)-Fragment Crystallizable Differs Between IgG Subclasses and Strains. Front. Immunol. 2017, 8, 608. 10.3389/fimmu.2017.00608. [DOI] [PMC free article] [PubMed] [Google Scholar]
- Krištić J.; Zaytseva O. O.; Ram R.; Nguyen Q.; Novokmet M.; Vuckovic F.; Vilaj M.; Trbojevic-Akmacic I.; Pezer M.; Davern K. M.; Morahan G.; Lauc G. Profiling and genetic control of the murine immunoglobulin G glycome. Nat. Chem. Biol. 2018, 14, 516. 10.1038/s41589-018-0034-3. [DOI] [PubMed] [Google Scholar]
- Zaytseva O. O.; Jansen B. C.; Hanic M.; Mrcela M.; Razdorov G.; Stojkovic R.; Erhardt J.; Brizic I.; Jonjic S.; Pezer M.; Lauc G. MIgGGly (mouse IgG glycosylation analysis) - a high-throughput method for studying Fc-linked IgG N-glycosylation in mice with nanoUPLC-ESI-MS. Sci. Rep. 2018, 8, 13688. 10.1038/s41598-018-31844-1. [DOI] [PMC free article] [PubMed] [Google Scholar]
- Vučković F.; Kristic J.; Gudelj I.; Teruel M.; Keser T.; Pezer M.; Pucic-Bakovic M.; Stambuk J.; Trbojevic-Akmacic I.; Barrios C.; Pavic T.; Menni C.; Wang Y.; Zhou Y.; Cui L.; Song H.; Zeng Q.; Guo X.; Pons-Estel B. A.; McKeigue P.; Leslie Patrick A.; Gornik O.; Spector T. D.; Harjacek M.; Alarcon-Riquelme M.; Molokhia M.; Wang W.; Lauc G. Association of systemic lupus erythematosus with decreased immunosuppressive potential of the IgG glycome. Arthritis Rheumatol. 2015, 67, 2978–2989. 10.1002/art.39273. [DOI] [PMC free article] [PubMed] [Google Scholar]
- Schwedler C.; Haupl T.; Kalus U.; Blanchard V.; Burmester G. R.; Poddubnyy D.; Hoppe B. Hypogalactosylation of immunoglobulin G in rheumatoid arthritis: relationship to HLA-DRB1 shared epitope, anticitrullinated protein antibodies, rheumatoid factor, and correlation with inflammatory activity. Arthritis Res. Ther. 2018, 20, 44. 10.1186/s13075-018-1540-0. [DOI] [PMC free article] [PubMed] [Google Scholar]
- Liu Q.; Lu J.; Lin J.; Tang Y.; Pu W.; Shi X.; Jiang S.; Liu J.; Ma Y.; Li Y.; Xu J.; Jin L.; Wang J.; Wu W. Salvianolic acid B attenuates experimental skin fibrosis of systemic sclerosis. Biomed. Pharmacother. 2019, 110, 546–553. 10.1016/j.biopha.2018.12.016. [DOI] [PubMed] [Google Scholar]
- Liu Q.; Lin J.; Han J.; Zhang Y.; Lu J.; Tu W.; Zhao Y.; Guo G.; Chu H.; Pu W.; Liu J.; Ma Y.; Chen X.; Zhang R.; Gu J.; Zou H.; Jin L.; Wu W.; Ren S.; Wang J. Immunoglobulin G galactosylation levels are decreased in systemic sclerosis patients and differ according to disease subclassification. Scand. J. Rheumatol. 2019, 49, 146–153. 10.1080/03009742.2019.1641615. [DOI] [PubMed] [Google Scholar]
- Nimmerjahn F.; Anthony R. M.; Ravetch J. V. Agalactosylated IgG antibodies depend on cellular Fc receptors for in vivo activity. Proc. Natl. Acad. Sci. U.S.A. 2007, 104, 8433–8437. 10.1073/pnas.0702936104. [DOI] [PMC free article] [PubMed] [Google Scholar]
Associated Data
This section collects any data citations, data availability statements, or supplementary materials included in this article.


