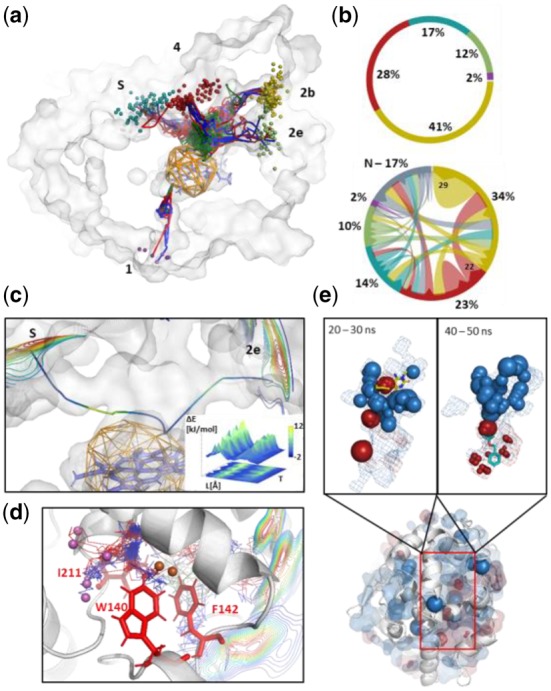
Fig. 1.

An example of AQUA-DUCT analysis. (a) Paths (lines) and entry/exit locations (small balls) of water molecules passing via cytochrome P450 3A4-binding cavity during 50-ns MD simulation. (b) Statistical data of tunnels entry utilization (upper) and flow between tunnel entries (lower part). Colors reflect ones used in (a). N indicates trajectories which start or end in protein interior. (c) Energy profile of water transportation between ‘2e’ and ‘s’ tunnel entries (shown as isolines) in cytochrome P450 3A4. The smoothed path colored according to energy scale, the energy profile calculated in 10-ns time-window. (d) Rare events analysis—detected leakage of water molecules in LinB haloalkane dehalogenase via pathway used for de novo tunnel design. Main tunnels entries are shown as isolines, leaking molecules as small balls. Modified residues indicated by red sticks. (e) Hot-spots of water (blue spheres) and DMSO (red spheres) identified by distribution analysis in human epoxide hydrolase in 50-ns simulation (middle panel). Inner pockets shown in surface representations. Overlap of detected hot-spots and inhibitors during analysis of different time frames of simulations are shown on bottom (3-[4-(benzyloxy)phenyl]propan-1-ol) and top (6-amino-1-methyl-5-(piperidin-1-yl)pyrimidine-2,4(1H,3H)-dione) panel. (Color version of this figure is available at Bioinformatics online.)
