

Abstract
Objective:
To evaluate HIV testing yield under several candidate strategies for outreach testing at venues (i.e., places where people socialize and meet new sex partners) in East Africa cross-border areas.
Design:
Population-based cross-sectional biobehavioral survey of people who had not been previously diagnosed with HIV found in venues.
Methods:
We identified participants who would have been tested for HIV under each of 10 hypothetical outreach testing strategies and calculated the proportion who would have newly tested positive for HIV under each strategy. Based on this proportion, we calculated the “number needed to test” (NNT) to identify 1 new case of HIV under each strategy. All estimates were obtained by applying survey sampling weights to account for the complex sampling design.
Results:
If testing were performed at a random sample of venues, 35 people would need to be tested to identify 1 new case of HIV, but higher yield could be found by limiting testing to venues with specific characteristics. Strategies focusing on women had higher testing yield. Testing women employed by venues would result in highest yield of all strategies examined (NNT = 15), while testing men under age 24 would result in the lowest yield (NNT = 99).
Conclusions:
Quantitatively evaluating HIV testing strategies prior to implementation using survey data presents a new opportunity to refine and prioritize outreach testing strategies for the people and places most likely to result in high HIV testing yield.
Keywords: HIV; Public Health Practice; Epidemiology; Africa, Eastern
Among people living with HIV, not knowing one’s HIV status is often the largest barrier to achieving viral suppression [1]. The UNAIDS 90–90-90 goals, which state that, by the year 2020, 90% of people living with HIV will know their status, 90% of those who know their status will be on antiretroviral therapy (ART), and 90% of those on ART will have a suppressed viral load, are a useful framework to evaluate progress towards improving survival and reducing onward transmission among those living with HIV [2]. Reports from around the world indicate that, while progress is being made towards the second and third targets, progress towards achieving the “first 90” has been slow [3–6].
Outreach HIV testing is one method to find people living with HIV who are unaware of their status. Outreach testing has been conducted in many settings around the world, and has proven to be an effective way to find new cases of HIV, particularly among key populations [7]. However, with finite resources available for testing programs, optimizing these programs requires targeting populations and locations with the highest expected yield of new HIV cases.
Here, we describe and illustrate an approach to evaluate HIV testing yield under several candidate strategies for outreach testing at venues (i.e., places where people socialize and meet new sex partners) in East Africa cross-border areas. These cross-border areas are important mixing grounds for resident and mobile populations at risk for HIV and have a high density of venues offering alcohol and sex on site [8]. In such settings, venue-based outreach testing is appealing because it provides HIV testing services (HTS) at locations where HIV transmission is likely and improves testing access for highly mobile populations who may not use traditional facility-based testing services or be easy to find for community-based testing. However, deciding where among numerous venues to provide HTS when testing resources are finite means that prioritization of venues for outreach testing is necessary. We estimate the number of tests that would need to be conducted to identify one new case of HIV under each candidate outreach testing strategy using data from the East Africa Cross Border Integrated Health Study (CBIHS). We also present software in the forms of an R package and a web application to estimate and visualize the number of tests needed to identify one new case under candidate strategies in user-specified datasets.
METHODS
Study Procedures
The CBIHS has been described in detail elsewhere [8]. Briefly, CBIHS is a population-based cross-sectional study of a wide array of health outcomes in 14 survey sites in cross-border areas in Kenya, Uganda, Tanzania, and Rwanda (Figure 1) conducted between June, 2016 and February, 2017. Of the selected sites, eight were “land border sites,” which included the area around international border posts on highways, and six were “lake border sites,” which included fishing villages on Lake Victoria that served as points of commerce for fisher folk from multiple East African countries.
Figure.

Number needed to test to identify 1 new case of HIV under 10 candidate outreach testing strategies had they been implemented in the 14 cross-border areas selected for the East Africa Cross Border Integrated Health Study, 2016. Panel A presents overall results and Panel B presents results by sex.
The study included a bio-behavioural survey among a sample of people patronizing or working in public venues in cross-border areas. The Priorities for Local AIDS Control Efforts (PLACE) method [9,10] was used to sample and recruit a stratified random sample of individuals socializing in venues in cross-border areas, as described in Appendix 1.
Sampled individuals were offered counselling and rapid HIV testing according to the algorithm approved by each country. In addition, respondents were asked to participate in an interview to gather sociodemographic information, health history, family information, sexual behaviour, health-seeking behaviour, and exposure to HIV prevention, care, and treatment programs, including antiretroviral therapy (ART). Participants who refused HIV testing were offered the option of participating in the interview. After the interview, participants who agreed to be tested received their result and post-test counselling. Participants with a positive rapid test were linked to a local health facility for confirmatory testing and HIV care.
HIV Testing Yield
The purpose of this study was to identify feasible strategies to improve HIV testing yield in East Africa cross-border areas. We define HIV testing yield as the proportion of people not previously diagnosed with HIV who test positive for HIV. We also report the number of these people who would need to be tested to identify one new case of HIV (the “number needed to test”) under each candidate strategy. The denominator for the HIV testing yield measure was people (HIV positive and negative) who had not been previously diagnosed with HIV. We identified these people from among all sampled participants through their responses in the behavioral survey. Specifically, respondents were considered to be “not previously diagnosed with HIV” if they a) reported never taking an HIV test prior to the study; b) reported taking an HIV test but not receiving the result; or c) reported taking an HIV test and receiving a negative result. The numerator for the HIV testing yield measure was people who met the criteria to be included in the denominator who also tested positive on the HIV rapid test administered during the study.
Candidate outreach testing strategies
Possible outreach testing strategies were identified by local stakeholders and researchers based on prior knowledge about HIV in the region, examination of bivariate prevalence ratios for the association between individual- and venue-level risk factors and prevalence of undiagnosed HIV, and considerations regarding implementation and feasibility. Specifically, candidate strategies included the following:
Offer testing to people found at venues in cross-border areas
Offer testing to people found at venues where HIV testing was not offered within the past 6 months
Offer testing to workers at venues in cross-border areas
Offer testing to people at venues where people have sex on site
Offer testing to young people ages 24 and under
Offer testing to people who live at a venue where people drink, socialize, or meet new sexual partners
Offer testing to people found in venues at or adjacent to truck stops
Offer testing to people found in venues in landing sites (i.e. fishing villages)
Offer testing to people found in Discos, Nightclubs, and Brothels
Offer testing to people found in and around a border crossing
HIV transmission risk behaviors
We compared the distribution of 2 behavioral attributes associated with HIV transmission between people newly diagnosed with HIV under each strategy outlined above: 1) number of sexual partners in the past 12 months; and 2) percentage reporting 2 or more sexual partners in the past 4 weeks. Both behaviors were reported by participants as part of the bio-behavioral survey.
Statistical approach
All participants who responded to the survey, completed the rapid HIV test, and indicated during the survey that they had not been previously diagnosed with HIV were included in the analysis. Each participant received a survey sampling weight designed to reweight the study sample to represent all people found in venues in the selected East Africa cross border areas. Details on the survey sampling weights may be found in Appendix 1.
To estimate HIV testing yield and the number needed to test under each strategy we first identified participants whose survey data indicated that they would be offered an HIV test under the proposed strategy. For example, to estimate HIV testing yield under the first strategy, “offer testing to people found at venues in cross-border areas,” all participants who indicated that they had not been previously diagnosed with HIV were included. However, to estimate HIV testing yield under the second strategy (“offer testing to people found at venues where HIV testing was not offered within the past 6 months”), participants were only included if they were recruited in a venue where HIV testing had not been offered in the past 6 months. Because the purpose of this analysis was to compare the HIV testing yield we would expect to see under real world conditions under each candidate strategy, for all testing strategies, we excluded participants who refused the HIV test. Appendix 2 includes details on how participants following each strategy were identified.
For each strategy, we estimated HIV testing yield by restricting to participants who would be tested under that strategy, then, among those participants, estimating the weighted proportion who tested positive for HIV during the study. Corresponding 95% confidence intervals were based on standard errors estimated using Taylor series linearization to account for the sampling design [11]. We also report the number needed to test to identify one new case of HIV, defined as the inverse of the HIV testing yield, for each strategy. For example, if the weighted proportion of people newly testing positive for HIV who would have been tested under a given strtegy was 5%, the estimated number needed to test to identify 1 new case of HIV would be 1/0.05 = 20 individuals. We report the HIV testing yield and numbers needed to test under each strategy, as well as under each strategy if focused exclusively on women or focused exclusively on men. To examine the potential for limiting onward HIV transmission under each strategy, we also compared the average number of sex partners and the percentage of respondents with 2 or more partners in the past 4 weeks among people who would have been newly diagnosed with HIV under each strategy. These calculations were also weighted by the sampling weights described above.
An R package to implement the proposed approach to estimate HIV testing yield under each strategy for user specified datasets is available on the author’s Github page at https://github.com/edwardsjk/yield and a web application is available at https://edwardsjk.shinyapps.io/yieldapp/. Instructions on use of the web application are included in Appendix 3.
RESULTS
Of the 1,769 venues identified by community informants in the 14 cross-border areas, 1,161 (66%) were sampled for verification. Of these sampled venues, 883 (76%) were successfully located, operational, and contained a venue informant who consented to participate. A total of 452 (51%) of these venues were sampled for the bio-behavioural survey, from which 11,567 individuals were sampled and asked to participate in the study. Of those, 11,410 (98.6%) agreed to participate in the interview, 11,090 (97%) of those interviewed indicated that they had not been previously diagnosed with HIV, and 10,314 (93%) of those not previously diagnosed agreed to the HIV test. The overall proportion who refused the HIV test was 7.0% and was similar across most testing strategies; numbers of refusals and proportions of those approached who refused the HIV test under each strategy are provided in Appendix 4. The lowest refusal rate was seen among people who lived at venues (3.3%), while the highest refusal rate was seen among people recruited in landing sites (10.7%).
Of the 883 venues visited during the study, 45% were bars, pubs, or restaurants and 30% were hotels, guest houses, or lodges (Table 1). Nightclubs, discos, and brothels were less common (2.5%), as were other types of commercial venues, outside venues, and transportation hubs. Informants at nearly half of the venues (49%) reported that people had sex at the venue, and nearly two-thirds (64%) reported that alcohol was sold at the venue. Female sex workers reportedly lived at 18% of venues, and about 20% of venues had had HIV testing and/or visits by outreach workers in the past 6 months.
Table 1.
Characteristics of 883 venues found in 14 cross border areas selected for the East Africa Cross Border Integrated Health Study, 2016
| Characteristics | Number of venues | Population %a |
|---|---|---|
| Type of venue | ||
| Bar/pub/restaurant | 395 | 44.8 |
| Hotel/guest house/lodge | 260 | 29.7 |
| Nightclub/disco/brothel | 22 | 2.5 |
| Commercial venueb | 64 | 8.4 |
| Outside venuec | 39 | 4.6 |
| Transportation hubd | 13 | 1.7 |
| Other | 90 | 8.2 |
| Sex occurs at the venue | 438 | 49.1 |
| Alcohol sold at the venue | 576 | 63.8 |
| Female sex workers live at the venue | 155 | 17.9 |
| HIV testing offered at the venue in the past 6 months | 185 | 22.0 |
| Outreach workers visited the venue in the past 6 months | 163 | 20.2 |
Population percentages were obtained by weighting the sampled venues to accommodate the complex sampling design
Commercial venues included markets, hair salons, shops, cinemas, recreation and game centers, and schools.
Outdoor venues included beaches, parks, construction sites, and streets.
Transportation hubs included truck stops and lorry/railway stations.
Cross border priority populations were identified by local stakeholders and are not mutually exclusive
Of people found at venues without a prior HIV diagnosis, about two-thirds were male, 34% were between the ages of 15 and 24, and most (53%) had completed primary school without additional education (Table 2). Most participants were recruited from venues with eating or drinking (bars, pubs, and restaurants) or venues with overnight accommodations (hotels, guest houses, lodges). 48% of participants were recruited at a venue with sex on-site.
Table 2.
Characteristics of 10,314 people not previously diagnosed with HIV found at 452 sampled public venues in 14 cross-border areas selected for the East Africa Cross Border Integrated Health Study, 2016
| Characteristics | Sample n | Population %a |
|---|---|---|
| Gender | ||
| Male | 6576 | 66.4 |
| Female | 3738 | 33.6 |
| Age | ||
| 15–24 | 3547 | 33.7 |
| 25–34 | 3932 | 38.1 |
| 35–44 | 1838 | 18.2 |
| 45+ | 997 | 9.9 |
| Employed | 7676 | 74.4 |
| Paid cash for sex in past 12 months | 1522 | 15.9 |
| Currently married or living with a partner | 5774 | 56.4 |
| Education | ||
| Less than primary | 2171 | 21.9 |
| Completed primary | 5518 | 52.7 |
| Completed secondary | 1607 | 15.5 |
| More than secondary | 1004 | 9.8 |
| Type of venue where recruited | ||
| Bar/pub/restaurant | 4775 | 43.4 |
| Hotel/guest house/lodge | 2309 | 24.3 |
| Nightclub/disco/brothel | 297 | 2.8 |
| Commercial venueb | 912 | 11.2 |
| Outside venuec | 661 | 7.7 |
| Transportation hubd | 97 | 0.9 |
| Other | 1017 | 9.6 |
| Time spent away from primary residence in past year | ||
| 2 weeks or less | 6365 | 62.6 |
| More than 2 weeks but less than 1 month | 1272 | 11.9 |
| More than 1 month but not more than 3 months | 800 | 7.8 |
| More than 3 months | 1338 | 13.1 |
| Refused | 473 | 4.5 |
| Type of respondent | ||
| Workers at venues | 2205 | 21.3 |
| Patrons at venues | 8109 | 78.7 |
| Recruited in a land border site | 6931 | 71.0 |
| Recruited in a lake border site | 3383 | 29.0 |
| Visited more than 1 venue on day of recruitment | 4588 | 44.6 |
| Recruited at a venue where people have sex on site | 5203 | 48.3 |
| Member of cross-border priority populatione | ||
| Female sex worker (received cash for sex in past 12 months) | 739 | 7.1 |
| Fisher folk | 1115 | 9.6 |
| Long distance truck driver | 167 | 1.9 |
| Female worker at venue | 1037 | 9.2 |
| Young women (ages 15–24) | 1522 | 13.4 |
Population percentages were obtained by weighting the study sample to accommodate the complex sampling design
Commercial venues included markets, hair salons, shops, cinemas, recreation and game centers, and schools.
Outdoor venues included beaches, parks, construction sites, and streets.
Transportation hubs included truck stops and lorry/railway stations.
Cross border priority populations were identified by local stakeholders and are not mutually exclusive. Not all participants were members of any cross-border priority population
Under a strategy that provided outreach testing at all (or a random sample of) venues, the HIV testing yield was 2.88% (95% confidence interval [CI]: 2.43, 3.32) (Table 3), meaning that one would expect to identify 1 new case of HIV for every 35 people tested (Figure, Panel A). This universal venue-based testing strategy was more effective for identifying infected women than men; only 21 women would need to be tested to identify 1 new case of HIV while one would need to test 53 men for the same result (Figure, Panel B). Yield was slightly higher at venues where HIV testing had not been offered in the past 6 months; at these venues, one would expect to have to test only 33 people for each new case identified.
Table 3.
HIV testing yield under 10 candidate outreach testing strategies had they been implemented in the 14 cross-border areas selected for the East Africa Cross Border Integrated Health Study, 2016
| Gender neutral implementation | Strategies focused on women | Strategies focused on men | |||||||||
|---|---|---|---|---|---|---|---|---|---|---|---|
| Strategy | n1 | HIV testing yield,% | 95% CI | n | HIV testing yield, % | 95% CI | n | HIV testing yield,% | 95% CI | ||
| 1. Offer testing to people found at venues in cross border areas | 10,314 | 2.88 | 2.43, 3.32 | 3738 | 4.79 | 3.82, 5.76 | 6576 | 1.91 | 1.52, 2.30 | ||
| 2. Offer testing to people found at venues that do not currently offer HIV testing | 7068 | 3.05 | 2.51, 3.59 | 2514 | 4.98 | 3.83, 6.14 | 4554 | 2.08 | 1.60, 2.56 | ||
| 3. Offer testing to workers at venues in cross border areas | 2205 | 3.63 | 2.53, 4.73 | 1037 | 6.53 | 4.33, 8.74 | 1168 | 1.41 | 0.70, 2.12 | ||
| 4. Offer testing to people at venues where people have sex on site | 5203 | 3.08 | 2.37, 3.78 | 1944 | 5.03 | 3.38, 6.68 | 3259 | 1.95 | 1.44, 2.45 | ||
| 5. Offer testing to young people ages 24 and under | 3547 | 2.48 | 1.71, 3.25 | 1522 | 4.72 | 2.95, 6.50 | 2025 | 1.01 | 0.42, 1.59 | ||
| 6. Offer testing to people who live at a venue where people drink, socialize, or meet new sexual partners | 2561 | 3.35 | 2.36, 4.34 | 1167 | 5.47 | 3.62, 7.32 | 1394 | 1.79 | 0.79, 2.79 | ||
| 7. Offer testing to people found in venues at or adjacent to truck stops | 2934 | 2.82 | 2.17, 3.47 | 1034 | 5.08 | 3.64, 6.51 | 1900 | 1.68 | 1.00, 2.36 | ||
| 8. Offer testing to people found in venues in landing sites (i.e. fishing villages) | 3383 | 2.84 | 1.98, 3.70 | 1328 | 4.53 | 3.20, 5.87 | 2055 | 1.92 | 1.18, 2.67 | ||
| 9. Offer testing to people found in Discos, Nightclubs, and Brothels | 297 | 3.79 | 3.33, 4.24 | 128 | 5.65 | 5.04, 6.26 | 169 | 2.06 | 1.13, 3.00 | ||
| 10. Offer testing to people found in and around a border crossing | 4720 | 2.97 | 2.42, 3.52 | 1702 | 4.81 | 3.69, 5.92 | 3018 | 2.11 | 1.53, 2.69 | ||
Number of participants in the CBIHS who would have been tested had this strategy been in place
Yield was also higher under a strategy that limited testing to workers at venues (yield = 3.63%; 95% CI: 2.53, 4.73). Under this strategy, only 28 workers would need to be tested to identify 1 new case of HIV. Testing female workers was more efficient than testing male workers; one would expect to identify a new case of HIV after testing 15 female workers, as compared to 71 male workers.
Comparing strategies that did not limit testing by sex, the strategy with the lowest number needed to test to identify a single new infection was outreach testing at discos, nightclubs, and brothels, where only 26 people would need to be tested to identify a new case of HIV, on average. However, with discos, nightclubs, and brothels composing only a small portion of all venues, this strategy would reach saturation quickly.
All strategies considered resulted in higher yield among women than among men. The disparities between men and women in the number needed to test to identify 1 new case were most pronounced among venue workers (15 women or 71 men), people under age 24 (21 women or 99 men), and people found in venues near truck stops (20 women or 60 men).
People who would have been newly diagnosed with HIV under a strategy to perform testing at all venues reported an average of 4.4 sex partners in the past 12 months, and 30.4% reported sex with 2 or more partners in the past 4 weeks (Table 4). The strategy to test people at venues in and around a border crossing identified people newly diagnosed with HIV with the most partners in the past 12 months (6.8 partners, on average), while the strategies to test people under age 24 and workers at venues identified people newly diagnosed with HIV most likely to have had sex with 2 or more people in the past 4 weeks (37% and 36%, respectively).
Table 4.
Behaviors associated with HIV transmission among participants who would have been newly diagnosed with HIV under 10 candidate outreach testing strategies in the 14 cross-border areas selected for the East Africa Cross Border Integrated Health Study, 2016
| No. newly diagnosed1 | Average No. sex partners in past 12 months | Percentage with 2 or more partners in past 4 weeks | |||||
|---|---|---|---|---|---|---|---|
| Strategy | Avg. | 95% CI | Population % | 95% CI | |||
| 1. Offer testing to people found at venues in cross border areas | 307 | 4.4 | 1.9, 6.9 | 30.2 | 23.9, 36.5 | ||
| 2. Offer testing to people found at venues that do not currently offer HIV testing | 207 | 2.8 | 2.1, 3.6 | 31.0 | 23.2, 38.8 | ||
| 3. Offer testing to workers at venues in cross border areas | 92 | 2.9 | 1.8, 4.1 | 35.7 | 24.7, 46.7 | ||
| 4. Offer testing to people at venues where people have sex on site | 167 | 2.9 | 2.0, 3.8 | 28.2 | 20.8, 35.5 | ||
| 5. Offer testing to young people ages 24 and under | 83 | 5.7 | 0.3, 11.1 | 37.0 | 27.0, 47.0 | ||
| 6. Offer testing to people who live at a venue where people drink, socialize, or meet new sexual partners | 87 | 5.3 | 0.5, 10.0 | 31.4 | 23.4, 39.4 | ||
| 7. Offer testing to people found in venues at or adjacent to truck stops | 84 | 6.6 | 0, 14.5 | 27.5 | 17.4, 37.5 | ||
| 8. Offer testing to people found in venues in landing sites (i.e. fishing villages) | 105 | 3.8 | 0, 8.0 | 23.2 | 14.5, 31.9 | ||
| 9. Offer testing to people found in Discos, Nightclubs, and Brothels | 12 | 1.2 | 0, 3.0 | 17.8 | 0.0, 41.2 | ||
| 10. Offer testing to people found in and around a border crossing | 143 | 6.8 | 1.5, 12.2 | 33.0 | 24.1, 41.8 | ||
Number of participants newly diagnosed with HIV in the CBIHS who would have been tested had this strategy been in place
DISCUSSION
Comparing the performance of candidate HIV outreach testing strategies at venues has important implications for HIV programs in resource-limited settings. In East Africa cross-border areas, we estimated that a strategy to prioritize testing of female workers at venues or women who live at venues would require the fewest tests to find one new case of HIV, but that strategies aimed at both sexes at nightclubs, brothels, and discos would also be high-yield. Strategies targeting only men would have resulted in lower HIV testing yield.
An important strength of this work is that the HIV testing strategies considered took into account only easily discernable characteristics that programs could check in the field. These included venue-level characteristics, like venue type and location, and some easily identifiable individual-level characteristics, like sex, whether the participant was a patron or a worker at a venue, and whether or not he or she lived at the venue. Strategies based on hidden person-level characteristics, like frequency of unprotected sex acts, may have produced higher HIV testing yield, but would not be feasible to implement at program level. Moreover, patterns in HIV testing yield may diverge from patterns related to HIV prevalence, as HIV testing yield is a function of both HIV prevalence and previous testing behavior. This may explain why some groups with historically high prevalence (e.g., fisher folk [12,13] and truck drivers [14]) had lower yield than other groups that may have been less frequently tested. HIV testing yield is just one of many considerations for designing HIV testing strategies in resource-limited settings. Even if yield under a specific strategy is high (e.g., under the strategy “test individuals found at nightclubs, discos, and brothels”), such a strategy may be of limited utility if the number of individuals meeting the criteria to be tested under such a strategy is low (e.g., if there are few nightclubs, discos, and brothels in a program’s catchment area). Moreover, the real-world efficiency of HIV testing strategies is driven both by HIV testing yield and the number of venues an outreach team would need to visit to test the target number of individuals. For example, visiting smaller venues may be a less efficient HIV testing strategy than visiting large venues (even if HIV testing yield were higher at small venues) because the bulk of the cost of HIV outreach programs is wrapped up in personnel, travel to sites, and setting up mobile testing centers, rather than the individual HIV tests themselves. Other considerations for designing HIV outreach testing strategies include acceptability, appropriateness, and safety of the strategies considered. HIV testing acceptability, measured here as the proportion who refused the HIV test under each strategy, is an important consideration as the refusal rate will affect the overall success of the strategy. Some types of venues may not be suitable for HIV outreach testing if they are unable to accommodate a private area for provision of the rapid test, if people visiting the venue are incapacitated by drugs or alcohol, or if the venue is a site of frequent armed conflict. Consideration should also be given to venue suitability for same-day ART initiation and peer navigation services to ensure that all newly diagnosed people living with HIV receive timely and facilitated linkage to care and treatment [15–17]. Finally, programs should use outreach testing as a platform to offer diverse HIV testing modalities, including HIV index testing and social network strategy testing, which can further improve HIV testing yield and reach [18,19].
The potential to disrupt the HIV epidemic by identifying new HIV cases and linking newly-diagnosed people to care requires not only finding new infections but finding, and treating, those at highest risk to transmit HIV to their sexual and injecting partners [20,21]. These include people with concurrent sexual partners, acute and early HIV, those engaged in unsafe needle sharing, and those having unprotected sex [22–24]. HIV outreach testing at venues may offer a compelling strategy to reach these individuals, as people found at venues are typically more likely to report such behaviors than people tested through household or facility-based approaches [25,26].
This study had several limitations. Importantly, we relied on self-report to assess participants’ prior HIV test results. Some participants may have been reluctant to share the knowledge that they had previously been diagnosed with HIV, which could mean that we included some people in our study who already knew they were HIV-infected and would not have been likely to participate in HIV outreach testing at venues under any of the proposed strategies. Moreover, while the study was designed to sample from a comprehensive list of venues in each cross-border area, some less-recognized venues may have been excluded, and we are therefore unable to assess strategies targeting these hidden types of venues. However, the proposed approach was able to evaluate pragmatic strategies likely to be implemented by programs in the field to improve HIV testing yield. These programs would themselves be limited to testing individuals who agreed to be tested at venues that the program could identify and locate, and in this way, the venues and participants in this study are representative of those who could be tested through venue-based programs. Here, we assume individuals who would agree to be tested under an HIV testing program are exchangeable with people in our study. Finally, while the study recruited a representative sample of people socializing in public places in cross border areas, relatively small numbers of some important populations were included (e.g., truck drivers, fisher folk, transgender women, intravenous drug users, and men who have sex with men), limiting inference about these groups.
Quantitatively evaluating HIV testing strategies prior to implementation using survey data represents a new opportunity to refine and prioritize outreach testing strategies. The approach used here to estimate HIV testing yield (and the number needed to test to find each new case) is both simple and powerful. This approach could be applied to other settings with HIV testing data available for a sample of the target population to inform and refine future testing strategies, and can easily be undertaken by applying the included R package and web application. Our proposed approach empowers researchers and public health practitioners to adapt testing strategies in real-time in response to emerging results to efficiently reach the people and places most likely to result in high HIV testing yield.
Funding:
This work supported by the United States Agency for International Development (USAID) under the terms of MEASURE Evaluation cooperative agreement AID-OAA-L-14-00004. MEASURE Evaluation is implemented by the Carolina Population Center, University of North Carolina at Chapel Hill in partnership with ICF International; John Snow, Inc.; Management Sciences for Health; Palladium; and Tulane University. Views expressed are not necessarily those of USAID or the United States Government.
APPENDIX
Appendix 1. Details on the PLACE sampling method and sampling weights
A. The PLACE method
The PLACE method is composed of 3 steps designed to recruit a stratified random sample of people socializing in public places in cross border areas.
Step 1: Enumeration of all venues in each cross-border area: Approximately 200 community informants in each cross-border area were interviewed and each asked to provide the names and locations of up to 10 venues where people socialize and meet new sexual partners. Additional community informants were interviewed until the list of venues reached saturation or no new venues were named.
Step 2: Verification of a sample of venues: The team verified characteristics of a sample of up to 100 venues in each cross-border area to ensure that venues named in step 1 were in existence, unique, and operational. In areas with fewer than 100 venues, all venues were included. In areas with more than 100 venues, a stratified random sample of venues was selected for verification.
Step 3: Bio-behavioural survey: The team conducted a bio-behavioural survey among individuals socializing at a stratified random sample of 40 venues per area. At sampled venues, a stratified sample of workers and male and female patrons was approached, with interview targets proportional to the total number of people at the venue.
B. Sampling weights
Sampling weights reflected 3 stages of sampling: sampling of the venue for “verification” from the list of unique venues identified in Step 1, sampling of the venue for data collection from the verified venues found to exist and be in operation, and sampling of the individual from the venue. The stage 1 weights were set to 1 if 100 venues or fewer were named in a cross-border area because, in this scenario, all venues were sampled for verification. If more than 100 venues were identified in Step 1, we stratified venues into high, medium, and low priority strata based on characteristics reported by community informants and sampled a greater proportion of venues from the high priority stratum. In this setting, weights for step 1, π1, were calculated as shown below.
In the third step, 40 of the located and operational venues were sampled for bio-behavioral interviews, again oversampling higher priority venues. A second weight up-weighted sampled venues to represent venues found to be operational. The second weight was given by:
A third set of weights accounted for sampling participants from selected venues. Weights to account for sampling of participants from venues were stratified by sex and computed as
Final weights for each individual, πi were the product of the 3 weights shown above.
Appendix 2. Details on candidate testing strategies
Table 1.
Definitions used to identify which participants would have been offered testing under each outreach strategy. All strategies were limited to participants who did not refuse the HIV test
| Strategy | Additional restrictions | Source of information used to identify eligible participants |
|---|---|---|
| 1. Offer testing to people found at venues in cross border areas | None | |
| 2. Offer testing to people found at venues that do not currently offer HIV testing | Limited to those recruited in a venue in which HIV outreach testing had not been performed in the past 6 months | Venue informant |
| 3. Offer testing to workers at venues in cross border areas | Limited to those who were workers at venues | Survey, but workers could be identified by public health programs without the need for individual-level interviews |
| 4. Offer testing to people at venues where people have sex on site | Limited to people working or socializing at venues where people have sex on site | Venue informant |
| 5. Offer testing to young people ages 24 and under | Limited to people found at venues who were between the ages of 15 and 24 | Survey |
| 6. Offer testing to people who live at a venue where people drink, socialize, or meet new sexual partners | Limited to people who live at a venue | Survey |
| 7. Offer testing to people found in venues at or adjacent to truck stops | Limited to participants recruited in venues within or adjacent to truck stops | Study team observation |
| 8. Offer testing to people found in venues in landing sites (i.e. fishing villages) | Limited to participants recruited in venues within landing sites | Study team observation |
| 9. Offer testing to people found in Discos, Nightclubs, and Brothels | Limited to participants recruited in venues within landing sites or fishing villages | Study team observation |
| 10. Offer testing to people found in and around a border crossing | Limited to participants recruited in venues within or around a border post, usually along a major highway | Study team observation |
Appendix 3. Introduction to the web application
The proposed approach to compute the number needed to test to identify one new case of HIV under each strategy can be implemented using the included web dashboard. This appendix walks through the required steps to use the dashboard.
1. Prepare a dataset with 1 record per respondent who has not been previously diagnosed with HIV. This dataset should include an outcome variable, a variable including survey sampling weights (if applicable), a variable denoting any clusters in the data (if applicable), and indicators that each respondent would have been tested under each candidate testing strategy. For example, if 10 strategies are being considered, the dataset should contain 10 indicator variables, one for each strategy.
Figure A3.1.
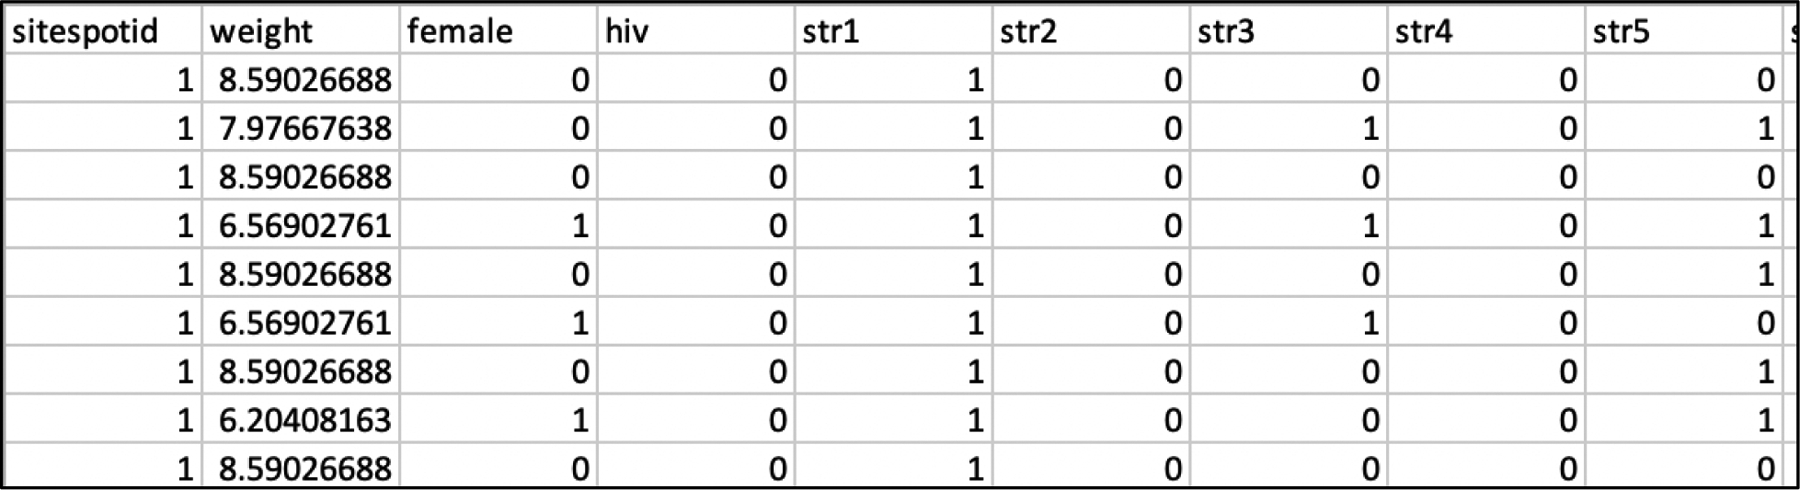
Example dataset structure
2. To access the web dashboard, navigate to https://edwardsjk.shinyapps.io/yieldapp/.
Figure A3.1.

The web dashboard
3. Select the dataset in csv format. Select the column names with outcomes, cluster id variables, and weights. If no clusters or weights are needed select “no clusters” or “no weights,” respectively. Check boxes next to variable names with indicators of the strategies to be compared.
Figure A3.3.

The web dashboard in use
Appendix 4.
Number of HIV test refusals under each strategy.
| Strategy | n | # refusals | % refused |
|---|---|---|---|
| 1. Offer testing to people found at venues in cross border areas | 11,090 | 776 | 7.0 |
| 2. Offer testing to people found at venues that do not currently offer HIV testing | 7641 | 573 | 7.5 |
| 3. Offer testing to workers at venues in cross border areas | 2343 | 138 | 5.9 |
| 4. Offer testing to people at venues where people have sex on site | 5583 | 380 | 6.8 |
| 5. Offer testing to young people ages 24 and under | 3765 | 218 | 5.8 |
| 6. Offer testing to people who live at a venue where people drink, socialize, or meet new sexual partners | 2647 | 86 | 3.3 |
| 7. Offer testing to people found in venues at or adjacent to truck stops | 3154 | 220 | 7.0 |
| 8. Offer testing to people found in venues in landing sites (i.e. fishing villages) | 3791 | 408 | 10.8 |
| 9. Offer testing to people found in Discos, Nightclubs, and Brothels | 324 | 27 | 7.0 |
| 10. Offer testing to people found in and around a border crossing | 5023 | 303 | 6.0 |
References
- 1.Staveteig S, Croft TN, Kampa KT, Head SK. Reaching the ‘first 90’: Gaps in coverage of HIV testing among people living with HIV in 16 African countries. PLOS ONE 2017; 12:e0186316. [DOI] [PMC free article] [PubMed] [Google Scholar]
- 2.Joint United Nations Programme on HIV/AIDS and Joint United Nations Programme on HIV/Aids. 90–90-90: an ambitious treatment target to help end the AIDS epidemic.; 2014.
- 3.Petersen M, Balzer L, Kwarsiima D, Sang N, Chamie G, Ayieko J, et al. Association of Implementation of a Universal Testing and Treatment Intervention With HIV Diagnosis, Receipt of Antiretroviral Therapy, and Viral Suppression in East Africa. Jama 2017; 317:2196–2196. [DOI] [PMC free article] [PubMed] [Google Scholar]
- 4.UNAIDS. Endings AIDS: Progress towards the 90–90-90 targets. Geneva:; 2017. [Google Scholar]
- 5.Ministry of Health U Centers for Disease Control and Prevention (CDC), and ICAP at Columbia University,. Uganda Population-based HIV Impact Assessment (UPHIA) 2016–17: Summary Sheet. Kampala, Uganda, Atlanta, GA, and New York, NY:; 2018. [Google Scholar]
- 6.Ministry of Health CD Gender, Elderly and Children (MoHCDGEC) and the Ministry of Health Zanzibar, Tanzania, Centers for Disease Control and Prevention (CDC), and ICAP at Columbia University,. Tanzania HIV Impact Survey (THIS) 2015–16: Summary Sheet. Dodoma, Tanzania, Atlanta, Georgia and New York, New York, USA:; 2017. [Google Scholar]
- 7.Bowles KE, Clark HA, Tai E, Sullivan PS, Song B, Tsang J, et al. Implementing rapid HIV testing in outreach and community settings: results from an advancing HIV prevention demonstration project conducted in seven U.S. cities. Public Health Rep 2008; 123 Suppl 3:78–85. [DOI] [PMC free article] [PubMed] [Google Scholar]
- 8.Edwards JK, Arimi P, Ssengooba F, Mulholland G, Markiewicz M, Bukusi EA, et al. The HIV care continuum among resident and non-resident populations found in venues in East Africa cross-border areas. Journal of the International AIDS Society 2019; 22:e25226. [DOI] [PMC free article] [PubMed] [Google Scholar]
- 9.Weir SS, Merli MG, Li J, Gandhi AD, Neely WW, Edwards JK, et al. A comparison of respondent-driven and venue-based sampling of female sex workers in Liuzhou, China. Published Online First: 2012. doi: 10.1136/sextrans-2012-050638 [DOI] [PMC free article] [PubMed]
- 10.Weir SS, Li J, Edwards JK, Gandhi AD, Yingying H, Suchindran CM, et al. Exploring Venue-Associated Risk: A Comparison of Multiple Partnerships and Syphilis Infection Among Women Working at Entertainment and Service Venues. AIDS and behavior 2013; 18 Suppl 2:S153–60. [DOI] [PMC free article] [PubMed] [Google Scholar]
- 11.Binder DA. On the Variances of Asymptotically Normal Estimators from Complex Surveys. Source: International Statistical Review / Revue Internationale de Statistique 1983; 51:279–292. [Google Scholar]
- 12.Opio A, Muyonga M, Mulumba N. HIV infection in fishing communities of Lake Victoria Basin of Uganda--a cross-sectional sero-behavioral survey. PloS one 2013; 8:e70770–e70770. [DOI] [PMC free article] [PubMed] [Google Scholar]
- 13.Kissling E, Allison EH, Seeley JA, Russell S, Bachmann M, Musgrave SD, et al. Fisherfolk are among groups most at risk of HIV: cross-country analysis of prevalence and numbers infected. AIDS (London, England) 2005; 19:1939–46. [DOI] [PubMed] [Google Scholar]
- 14.Bwayo J, Plummer F, Omari M, Mutere A, Moses S, Ndinya-Achola J, et al. Human immunodeficiency virus infection in long-distance truck drivers in east Africa. Archives of internal medicine 1994; 154:1391–6. [PubMed] [Google Scholar]
- 15.WHO | Guidelines for managing advanced HIV disease and rapid initiation of antiretroviral therapy. WHO; http://www.who.int/hiv/pub/guidelines/advanced-HIV-disease/en/ (accessed 27 Aug2019). [PubMed] [Google Scholar]
- 16.Labhardt ND, Ringera I, Lejone TI, Klimkait T, Muhairwe J, Amstutz A, et al. Effect of Offering Same-Day ART vs Usual Health Facility Referral During Home-Based HIV Testing on Linkage to Care and Viral Suppression Among Adults With HIV in Lesotho: The CASCADE Randomized Clinical Trial. JAMA 2018; 319:1103–1112. [DOI] [PMC free article] [PubMed] [Google Scholar]
- 17.Sharma M, Ying R, Tarr G, Barnabas R. Systematic review and meta-analysis of community and facility-based HIV testing to address linkage to care gaps in sub-Saharan Africa. Nature 2015; 528:S77–S85. [DOI] [PMC free article] [PubMed] [Google Scholar]
- 18.Lasry A, Medley A, Behel S, Mujawar MI, Cain M, Diekman ST, et al. Scaling Up Testing for Human Immunodeficiency Virus Infection Among Contacts of Index Patients — 20 Countries, 2016–2018. MMWR Morb Mortal Wkly Rep 2019; 68:474–477. [DOI] [PMC free article] [PubMed] [Google Scholar]
- 19.Lightfoot MA, Campbell CK, Moss N, Treves-Kagan S, Agnew E, Kang Dufour M-S, et al. Using a Social Network Strategy to Distribute HIV Self-Test Kits to African American and Latino MSM. JAIDS Journal of Acquired Immune Deficiency Syndromes 2018; 79:38. [DOI] [PubMed] [Google Scholar]
- 20.Giordano TP. The HIV treatment cascade--a new tool in HIV prevention. JAMA internal medicine 2015; 175:596–7. [DOI] [PubMed] [Google Scholar]
- 21.Cohen MS, Chen YQ, McCauley M, Gamble T, Hosseinipour MC, Kumarasamy N, et al. Prevention of HIV-1 infection with early antiretroviral therapy. The New England journal of medicine 2011; 365:493–505. [DOI] [PMC free article] [PubMed] [Google Scholar]
- 22.Scott-Sheldon LAJ, Walstrom P, Carey KB, Johnson BT, Carey MP, the MASH Research Team. Alcohol Use and Sexual Risk Behaviors among Individuals Infected with HIV: A Systematic Review and Meta-Analysis 2012 to Early 2013. Curr HIV/AIDS Rep 2013; 10:314–323. [DOI] [PMC free article] [PubMed] [Google Scholar]
- 23.Watts CH, May RM. The influence of concurrent partnerships on the dynamics of HIV/AIDS. Mathematical Biosciences 1992; 108:89–104. [DOI] [PubMed] [Google Scholar]
- 24.Pinkerton SD. Probability of HIV Transmission During Acute Infection in Rakai, Uganda. AIDS Behav 2008; 12:677–684. [DOI] [PMC free article] [PubMed] [Google Scholar]
- 25.Go VF, Solomon S, Srikrishnan AK, Sivaram S, Johnson SC, Sripaipan T, et al. HIV rates and risk behaviors are low in the general population of males in South India, but high in alcohol venues: results from 2 probability surveys. J Acquir Immune Defic Syndr 2007; 46:491–497. [DOI] [PMC free article] [PubMed] [Google Scholar]
- 26.Sikkema KJ, Watt MH, Meade CS, Ranby KW, Kalichman SC, Skinner D, et al. Mental Health and HIV Sexual Risk Behavior among Patrons of Alcohol Serving Venues in Cape Town, South Africa. J Acquir Immune Defic Syndr 2011; 57:230–237. [DOI] [PMC free article] [PubMed] [Google Scholar]