Abstract
Background
A predictive scoring system for acute respiratory distress syndrome (ARDS) patients, which incorporates age, PaO2/FlO2, and plateau pressure, APPS, was developed recently. It was validated externally in a Caucasian population but has not been studied in Asian populations. The aim of this study was to validate APPS in Korean ARDS patients.
Methods
We retrospectively reviewed the medical records of patients who were diagnosed with ARDS using the Berlin criteria and admitted to the medical ICU at Seoul National University Hospital from January 2015 to December 2016. The validation of the APPS was performed by evaluating its calibration and predictive accuracy. Its calibration was plotted and quantified using the Hosmer–Lemeshow test. Its predictive accuracy was assessed by calculating the area under the receiver operating characteristics (AUC–ROC) curve.
Results
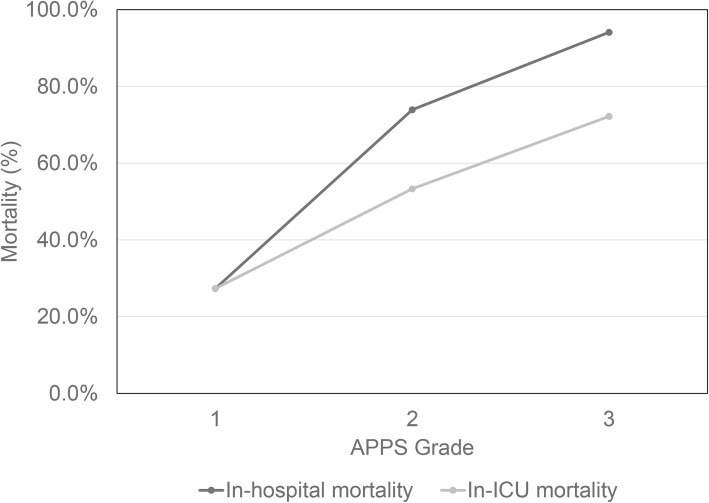
A total of 116 patients were analyzed, 32 of whom survived. Of the 116 patients, 11 (9.5%) were classified as APPS grade 1 (score 3–4), 88 (75.9%) as grade 2 (score 5–7) and 17 (14.6%) as grade 3 (score 8–9). In-hospital mortality was 27.3% for grade 1, 73.9% for grade 2 and 94.1% for grade 3 (P for trend < 0.001). The APPS was well calibrated (Hosmer–Lemeshow test, P = 0.578) and its predictive accuracy was acceptable (AUC–ROC 0.704, 95% confidence interval 0.599–0.809).
Conclusions
The APPS predicted in-hospital mortality in Korean patients with ARDS with similar power to its application in a Western population and with acceptable predictive accuracy.
Trial registration
Retrospectively registered.
Keywords: Respiratory distress syndrome, Adult, Prognosis, Hospital mortality, ROC curve, Calibration
Background
Since the initial description of acute respiratory distress syndrome (ARDS) in 1967 [1], its definition has been clarified by expert consensus [2, 3], and epidemiological studies have demonstrated its clinical significance in intensive care units (ICUs) [4–6]. A recent multicenter observational cohort study, in which ARDS was defined according to the Berlin criteria, reported that the prevalence of ARDS was 10.4% at ICU admission and that its overall hospital mortality was 40.0% [4]. Because ARDS has a high prevalence and mortality in ICU, it is important to determine a precise prognosis that allows clinicians to predict the clinical course of ARDS and decide on a treatment plan. To do this consistently and reasonably, a scoring system is required.
There has been no reliable prognostic scoring system for ARDS, despite the existence of prognostic indices such as the Acute Physiology and Chronic Health Evaluation (APACHE II), Simplified Acute Physiology Score (SAPS II), and Sequential Organ Failure Assessment (SOFA) [7–9]. Although these have been used to predict general mortality in ICU patients, they are not specific for ARDS. In addition, they involve complex calculations that require extensive clinical information about the patients.
Recently, a new, simpler prognostic scoring system was developed that is specific for ARDS: the age, PaO2/FlO2, and plateau pressure score (APPS). The APPS is a 9-point score that is calculated by measuring the age, PaO2/FIO2 ratio, and plateau pressure at 24 h after the patient is diagnosed with moderate to severe ARDS and counting each one to 1–3. Since many variables are not needed for calculations, clinicians can easily predict the in-hospital mortality of mechanically ventilated patients with moderate to severe ARDS patients at bedside [10]. However, one of the limitations of APPS was that it was derived and validated in cohorts from a number of Spanish hospitals and one American hospital. It has not been validated in an Asian population. Few studies have examined the geographic variation in the incidence rate of ARDS as defined by the Berlin criteria, and it remains unclear whether the features of ARDS in Asia differ from those in Western countries [4, 11]. In this context, we aimed to validate APPS externally for mechanically ventilated ARDS patients in Korea and assess the differences between Asian and Western populations.
Methods
We retrospectively reviewed patients admitted to the medical ICU at Seoul National University Hospital (SNUH) from January 1, 2015 to December 31, 2016. The study included patients who were mechanically ventilated in the medical ICU for at least 24 h and were confirmed to have moderate or severe ARDS according to the Berlin criteria [3]. Patients in a ward or ICU had respiratory failure within a week and started receiving mechanical ventilation after intubation in the ICU. They had bilateral opacity in chest imaging, proved not to be due to cardiac failure or fluid overload, which was evaluated by transthoracic echocardiography if necessary. In the ventilator setting, the peak end-expiratory pressure (PEEP) was 5 cmH2O or above. The PaO2/FIO2 ratio of the patients was 200 mmHg or below. Although patients were not treated according to strict protocols, it was recommended that patients received lung-protective mechanical ventilation, i.e., were ventilated with a low tidal volume of 4–8 mL/kg predicted body weight. The study excluded patients who were not intubated within 24 h after ARDS diagnosis because the calculation of APPS requires measurement of the plateau pressure. It also excluded patients who died or were discharged less than 24 h after diagnosis.
We collected information on the baseline characteristics of the patients, including demographic characteristics, underlying comorbidities, and the cause of ARDS. SAPS II, APACHE II, and SOFA scores were used to assess the severity of the patients’ general condition. We also collected arterial blood gas analysis data and ventilator-related indices for patients, and assessed whether they underwent adjuvant therapies such as the use of nitric oxide gas, prone positioning, or extracorporeal membrane oxygenation (ECMO). The primary clinical outcome was in-hospital mortality. The assessment of in-ICU mortality and the length of stay in ICU were used as secondary clinical outcomes.
The APPS was calculated and divided into three grades as defined in the original report [10]. Since the APPS was calculated at 24 h after ARDS diagnosis, we read age, PaO2/FIO2 ratios and maximal airway pressure at 24 h after ARDS diagnosis. When several measurements were available, the measurements taken at the closest time 24 h after diagnosis were selected. Grade 1 was defined as a score of 3–4 points, grade 2 as 5–7 points and grade 3 as 8–9 points. However, one difference was that this study used the maximal airway pressure rather than the plateau pressure because almost all of the patients in SNUH ICU received pressure-controlled mechanical ventilation. Under most conditions, maximal airway pressure during pressure-controlled ventilation is roughly equivalent to plateau pressure during volume-controlled ventilation.
Descriptive data were expressed as mean with standard deviation, median with interquartile range, or number with percentage, depending on the variable. Student’s t test, one-way analysis of variance, Mann–Whitney U test, or the Kruskal–Wallis test were used to compare continuous variables, and Pearson’s chi-squared test, Fisher’s exact test, or linear-by-linear association were used to compare categorical variables. Pearson and Spearman correlation analysis were used to determine the correlation between the two variables. To validate the predictive performance of APPS, we evaluated its quantitative calibration and discriminatory ability [12]. We compared the predicted and observed in-hospital mortality using a calibration plot and the Hosmer–Lemeshow goodness-of-fit test. The discrimination was measured by calculating the C-statistics from the receiver operating characteristics (ROC) curve. The probability of survival of all patients was analyzed using the Kaplan–Meier method with the log-rank test. The data for patients who survived and were discharged were censored at the last hospital follow-up date. A sensitive analysis was performed on patients who received mechanical ventilation with the standardized ventilatory setting (FIO2 ≥ 0.5; PEEP ≥10cmH2O) in the derivation study of APPS [10].
Results
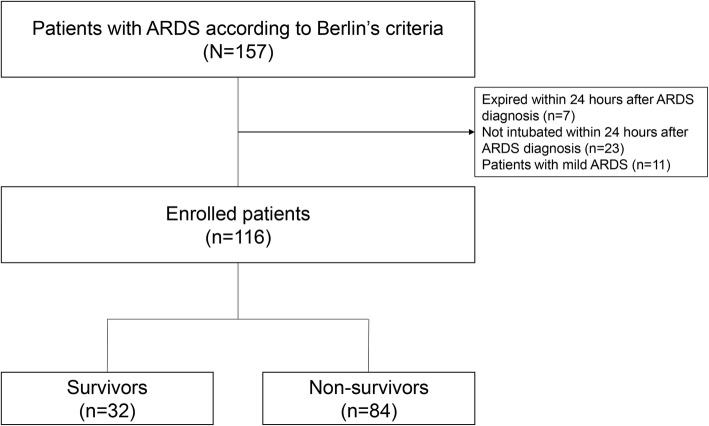
Of the 157 patients diagnosed with ARDS according to the Berlin criteria, 116 were analyzed, excluding patients with mild ARDS and those who died or were not intubated within 24 h after diagnosis of ARDS (Fig. 1). Of these 116 patients, 32 survived, and we compared the baseline characteristics of the survivors and nonsurvivors (Table 1). There was no significant difference between survivors and nonsurvivors in sex, age, underlying disease, cause of ARDS, physiologic parameters, or ventilatory parameters. The median APPS of survivors and nonsurvivors were 5.0 (interquartile range 4.3–6.0) and 6.0 (interquartile range 5.0–7.0), respectively; the APPS of nonsurvivors was significantly higher than that of survivors (P < 0.001). In addition, the mean APACHE II scores of survivors and nonsurvivors were 31.8 ± 8.5 and 35.2 ± 8.1, respectively, with that of nonsurvivors also significantly higher than that of survivors (P = 0.047).
Fig. 1.
Flow chart
Table 1.
Baseline characteristics of the survivors and non-survivors with acute respiratory distress syndromea
| Survivor(n = 32) | Non-survivor(n = 84) | p-value | |
|---|---|---|---|
| Male, N(%) | 24 (75.0) | 57 (67.9) | 0.454 |
| Age, mean ± SD | 64.5 ± 17.1 | 66.7 ± 13.2 | 0.459 |
| Underlying disease, N(%) | |||
| Diabetes | 7 (21.9) | 24 (28.6) | 0.466 |
| Hypertension | 12 (37.5) | 26 (31.0) | 0.502 |
| Tuberculosis | 1 (3.1) | 10 (11.9) | 0.285 |
| Chronic liver disease | 1 (3.1) | 5 (6.0) | 1.000 |
| Cause of ARDS, N(%) | |||
| Pneumonia | 25 (78.1) | 63 (75.0) | 0.812 |
| Aspiration | 3 (9.4) | 5 (6.0) | 0.683 |
| Sepsis | 3 (9.4) | 8 (9.5) | 1.000 |
| Transfusion | 0 (0) | 1 (1.2) | 1.000 |
| Others | 1 (3.1) | 7 (8.3) | 0.442 |
| Disease severity, mean ± SD | |||
| SAPS II | 75.0 ± 22.0 | 79.0 ± 19.4 | 0.338 |
| APACHE II | 31.8 ± 8.5 | 35.2 ± 8.1 | 0.047 |
| SOFA | 13.7 ± 4.0 | 13.6 ± 3.9 | 0.874 |
| APPS, median ± IQR | 5.0, 4.3–6.0 | 6.0, 5.0–7.0 | < 0.001 |
| Physiological parameters, mean ± SD | |||
| pH, median ± IQR | 7.4, 7.3–7.4 | 7.3, 7.3–7.4 | 0.066 |
| PaCO2 | 43.5 ± 14.6 | 45.8 ± 13.6 | 0.430 |
| PaO2/FiO2 | 111.5 ± 40.8 | 103.4 ± 36.0 | 0.294 |
| Ventilator parameters, mean ± SD | |||
| Tidal volume (mL/kg PBW) | 7.1 ± 2.1 | 7.5 ± 2.6 | 0.503 |
| Minute ventilation(L/min) | 10.4 ± 3.5 | 10.0 ± 3.5 | 0.649 |
| FIO2 | 0.76 ± 0.18 | 0.82 ± 0.19 | 0.166 |
| PEEP (cmH2O) | 7.2 ± 2.4 | 7.3 ± 2.6 | 0.859 |
| Pmax (cmH2O) | 23.7 ± 4.9 | 24.7 ± 4.8 | 0.298 |
Abbreviation: APACHE acute physiology and chronic health evaluation, APPS age, PaO2/FlO2, and plateau pressure score, IQR interquartile range, SAPS simplified acute physiology score, SOFA sequential organ failure assessment;
a Data are presented as n (%) or mean ± SD or median ± IQR
As the APPS grade increased, in-hospital mortality and in-ICU mortality increased significantly (Table 2, Fig. 2), the frequency of extubation was significantly reduced, and the use of nitric oxide significantly increased. Other clinical outcomes did not differ significantly according to APPS grade. Of the enrolled patients, 8 (6.9%) patients received ECMO treatment and 18 (15.5%) patients received prone position. In the patients who received ECMO treatment, except for one patient whose APPS was 3, all patients had an APPS score of 5 or higher (APPS Grade ≥ 2). There was a correlation between the APACHEII score and APPS, but it was not statistically significant. (Pearson’s correlation coefficient 0.621, P = 0.100) In the patients who received prone position, except for two patients whose APPS was 4, all patients had an APPS score of 5 or higher (APPS Grade ≥ 2). There was a significant correlation between the APACHEII score and APPS. (Spearman’s correlation coefficient 0.502, P = 0.034).
Table 2.
Clinical outcomes according to APPS gradea
| APPS Gr 1 (n = 11) | APPS Gr 2 (n = 88) | APPS Gr 3 (n = 17) | p for trend | |
|---|---|---|---|---|
| MV duration, median (IQR), days | 10 (3–23) | 10 (5–21) | 12 (6–21) | 0.721 |
| Extubation, N(%) | 7 (63.6) | 33 (37.5) | 3 (17.6) | 0.015 |
| Tracheostomy, N(%) | 2 (18.2) | 21 (23.9) | 4 (23.5) | 0.787 |
| Hospital length of stay, median (IQR), days | 27 (17–73) | 27 (15–52) | 21 (13–51) | 0.694 |
| ICU length of stay, median (IQR), days | 11 (3–23) | 12 (6–22) | 13 (8–21) | 0.702 |
| In-hospital mortality, N(%) | 3 (27.3) | 65 (73.9) | 16 (94.1) | < 0.001 |
| In-ICU mortality, N(%) | 3 (27.3) | 47 (53.4) | 12 (70.6) | 0.028 |
| Use of adjuvant therapy, N(%) | ||||
| Inotropics | 9 (81.8) | 79 (89.8) | 15 (88.2) | 0.687 |
| Corticosteroid | 10 (90.9) | 81 (92.0) | 17 (100) | 0.291 |
| Nitric oxide | 4 (36.4) | 42 (47.7) | 13 (76.5) | 0.024 |
| Prone position | 2 (18.2) | 15 (17.0) | 1 (5.9) | 0.313 |
| CRRT | 2 (18.2) | 32 (36.4) | 4 (23.5) | 0.989 |
| ECMO | 1 (9.1) | 6 (6.8) | 1 (5.9) | 0.757 |
Abbreviation: APPS , PaO2/FlO2, and plateau pressure score, CRRT continuous renal replacement therapy, ECMO extracorporeal membrane oxygenation, ICU intensive care unit, MV mechanical ventilation;
a Data are presented as n (%) or mean ± SD or median ± IQR
Fig. 2.
Mortality according to APPS grade. In-hospital mortality, p for trend < 0.001, In-ICU mortality, p for trend = 0.028
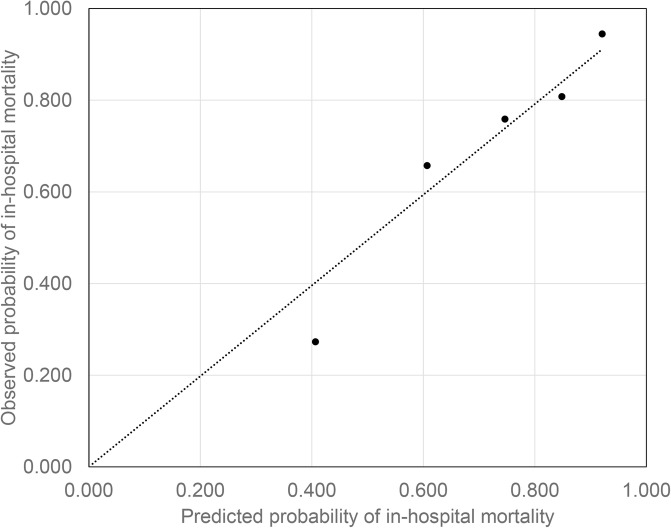
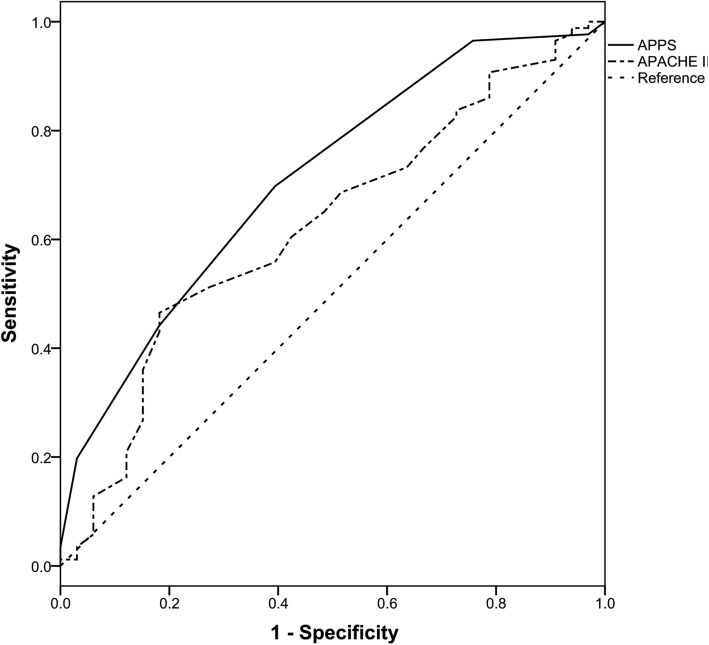
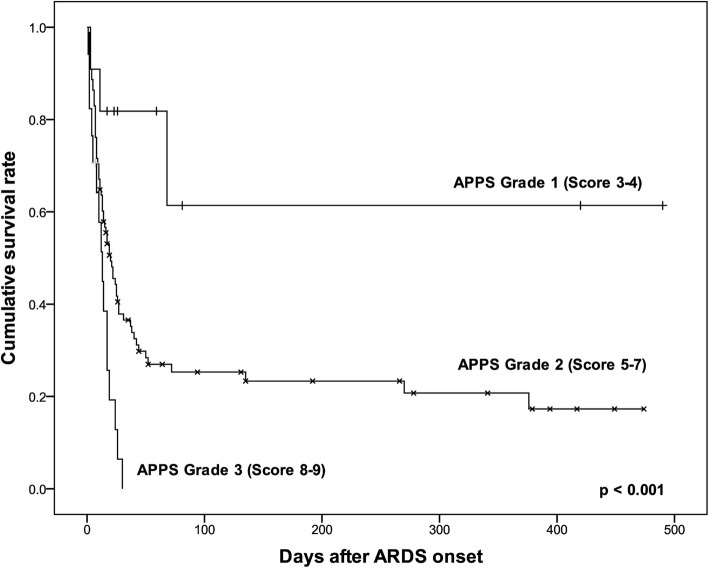
The probability of in-hospital death predicted by the APPS model and the observed rate of in-hospital death were compared using the calibration plot and the Hosmer–Lemeshow goodness-of-fit test (Fig. 3). The APPS model was well calibrated and there was no significant difference between the predicted and observed probability of in-hospital death (P = 0.639). To verify the accuracy of the APPS model and to compare it with APACHE II, ROC curves were generated for the two scoring systems (Fig. 4). The APPS model had fair accuracy: the C-statistic for the APPS model obtained from the area under the ROC curve was 0.711 (95% confidence interval [CI] 0.609–0.813), which was higher than that of APACHE II (0.624; 95% CI 0.513–0.736). When the Kaplan–Meier curve of patient survival was drawn, the cumulative survival rate clearly differed according to APPS grade (Fig. 5). The probability of survival decreased as the APPS grade increased (P < 0.001).
Fig. 3.
Calibration plot of APPS
Fig. 4.
Receiver operating characteristic curve of APPS and APACHE II. APPS (c-statistics 0.704, 95% CI [0.599–0.809]), APACHE II (c-statistics 0.623, 95% CI 0.510–0.736)
Fig. 5.
Kaplan-Meier probability of survival curves according to APPS grade
A sensitive analysis (n = 26) was conducted on patients who received mechanical ventilation with the standardized ventilatory setting (FIO2 ≥ 0.5; PEEP ≥10cmH2O), following the ventilatory protocol in the derivation study of APPS. The APPS model was confirmed to be well calibrated by the Hosmer-Lemeshow goodness-of-fit test (P = 0.647). This analysis showed that the predictive accuracy of the APPS was excellent. (AUC–ROC 0.823, 95% CI 0.651–0.996).
Discussion
This study showed that APPS was well calibrated and had good predictive accuracy for the prognosis of moderate to severe ARDS in Asian populations. The original report that proposed APPS stated that the C-statistic of APPS was 0.755 (95% CI 0.699–0.811) in the derivation cohort, and 0.800 (95% CI, 0.750–0.850) in the validation cohort [10]; the C-statistic of APPS for the present study was similar to that of the original study. In contrast, in a spatial validation study conducted in the Netherlands [13], APPS was not well calibrated, with a relatively low C-statistic value of 0.62 (95% CI 0.56–0.67), indicating a relatively low predictive accuracy. There are several possible reasons for the difference between these two external validation results. First, there was a difference in the severity of the illness in the patients. In the present study, the hospital mortality rate was 72.3% and the mean APACHE II score of all patients was 34.3 ± 8.3, both higher than those in the Dutch study, in which APPS was not effective in predicting mortality in the group with low scores. Similarly, in our study, patients with an APPS score of 3, which is the lowest possible score, had relatively high mortality but decreased APPS predictive accuracy. This suggests that APPS may be more accurately predictive in patients with more severe disease. Second, there may be ethnic differences in the validation of APPS. Although there are no previous studies of the relationship between Asian ethnicity and ARDS mortality, a retrospective study reported that African–American and Hispanic patients with ARDS had a significantly higher risk of death than Caucasian patients [14]. Another study reported that although African–American patients had more severe clinical manifestations of ARDS than Caucasian patients, their incidence of ARDS was lower [15]. ARDS is a complex clinical syndrome involving various pathophysiologic mechanisms, and environmental and genetic factors are implicated in its development and progression [16]. There has been no report identifying specific genetic polymorphisms that affect the prognosis of ARDS in Asians, but some studies have shown that genetic polymorphisms associated with inflammation, innate immunity, epithelial cell function, and angiogenesis are related to the prognosis of ARDS [17–22]. Therefore, the heterogeneity of ethnicity-related factors in ARDS may have affected the predictive accuracy of the APPS.
As reported in the original article describing APPS and the Dutch study discussed above, the present study also found that the ability of APACHE II scores to predict the prognosis of moderate to severe ARDS was inferior to that of APPS. One study reported that the APACHE II score was a predictor of mortality in ARDS, but that it was less relevant than other indicators such as age [23]. The APACHE II score is a general scoring system for ICU patients and may be less predictive when applied to ARDS patients. The Murray lung injury score for assessing the severity of acute lung injury was suggested in 1988 [24], and the CESAR study showed that ECMO treatment improved survival in ARDS patients with severe respiratory failure (Murray score > 3 or pH < 7.20) [25]. However, the Murray score has been criticized for its lack of specificity and validation in ARDS patients [26]. In contrast, APPS is specific for predicting the prognosis of ARDS and can be calculated easily, and thus can be used in clinical practice.
The sensitive analysis was performed on patients who received mechanical ventilation with the standardized ventilatory setting used in the derivation study of APPS because the PaO2/FIO2 ratio may be affected by the ventilator setting [27]. In the analysis, the APPS also was well calibrated and showed good predictive accuracy.
This study has several limitations. First, there may be a selection bias because it was a single-center retrospective study. Many of the patients had various underlying diseases, including malignancy, because of the characteristics of the tertiary hospital in Korea. Only a small number of patients had a low APPS because the general condition of most of the patients was very severe. Nevertheless, this study confirmed that APPS was as valid in Asian patients as it was in the original study in Western countries, and because of its specificity and simplicity, could be used in the treatment and research of ARDS patients in Asian countries. However, a multicenter prospective cohort study in Asia is needed to produce more reliable results. Second, the present study validated APPS differently from the original study by using maximal airway pressure instead of plateau pressure. We had difficulty monitoring plateau pressure in our patients because they all received pressure-controlled mechanical ventilation. However, despite these differences in validation procedure, this study showed that APPS could be appropriately applied using maximal airway pressure instead of plateau pressure. In the external validation study conducted in the Netherlands, it was also performed using maximal airway pressure instead of plateau pressure [13]. This suggested that APPS is more clinically useful than other scoring systems for predicting the prognosis of ARDS because, in clinical practice, the protocol for mechanical ventilation therapy may be different for each ICU.
Conclusions
The APPS predicted in-hospital mortality with acceptable predictive accuracy in Korean patients with ARDS similarly to Western populations.
Acknowledgements
Not applicable.
Abbreviations
- APACHE
Acute physiology and chronic health evaluation
- APPS
Age, PaO2/FlO2, and plateau pressure score
- ARDS
Acute respiratory distress syndrome
- AUC–ROC
The area under the receiver operating characteristics curve
- ECMO
Extracorporeal membrane oxygenation
- ICU
Intensive care unit
- PEEP
Peak end-expiratory pressure
- SAPS
Simplified acute physiology score
- SNUH
Seoul National University Hospital
- SOFA
Sequential organ failure assessment
- ROC
Receiver operating characteristics
Authors’ contributions
All authors contributed substantially to the study design. HH and SML collected and analyzed the data. HH and SML wrote the first draft of the manuscript. SMC, JL, YSP, CHL, CGY, YWK, SKH critically reviewed and approved the final manuscript.
Funding
None.
Availability of data and materials
The datasets used and/or analysed during the current study are available from the corresponding author on reasonable request.
Ethics approval and consent to participate
The study protocol was approved by the institutional review board and ethics committee at SNUH (IRB No. H-1703-179-843) and was conducted according to the principles of the Declaration of Helsinki. The need to obtain informed consent was waived due to the retrospective nature of the study.
Consent for publication
Not applicable.
Competing interests
The authors declare that they have no competing interests.
Footnotes
Publisher’s Note
Springer Nature remains neutral with regard to jurisdictional claims in published maps and institutional affiliations.
References
- 1.Ashbaugh DG, Bigelow DB, Petty TL, Levine BE. Acute respiratory distress in adults. Lancet. 1967;2(7511):319–323. doi: 10.1016/s0140-6736(67)90168-7. [DOI] [PubMed] [Google Scholar]
- 2.Bernard GR, Artigas A, Brigham KL, Carlet J, Falke K, Hudson L, et al. The American-European consensus conference on ARDS. Definitions, mechanisms, relevant outcomes, and clinical trial coordination. Am J Respir Crit Care Med. 1994;149(3 Pt 1):818–824. doi: 10.1164/ajrccm.149.3.7509706. [DOI] [PubMed] [Google Scholar]
- 3.Force ADT, Ranieri VM, Rubenfeld GD, Thompson BT, Ferguson ND, Caldwell E, et al. Acute respiratory distress syndrome: the Berlin definition. JAMA. 2012;307(23):2526–2533. doi: 10.1001/jama.2012.5669. [DOI] [PubMed] [Google Scholar]
- 4.Bellani G, Laffey JG, Pham T, Fan E, Brochard L, Esteban A, et al. Epidemiology, patterns of care, and mortality for patients with acute respiratory distress syndrome in intensive care units in 50 countries. JAMA. 2016;315(8):788–800. doi: 10.1001/jama.2016.0291. [DOI] [PubMed] [Google Scholar]
- 5.Brun-Buisson C, Minelli C, Bertolini G, Brazzi L, Pimentel J, Lewandowski K, et al. Epidemiology and outcome of acute lung injury in European intensive care units. Results from the ALIVE study. Intensive Care Med. 2004;30(1):51–61. doi: 10.1007/s00134-003-2022-6. [DOI] [PubMed] [Google Scholar]
- 6.Valta P, Uusaro A, Nunes S, Ruokonen E, Takala J. Acute respiratory distress syndrome: frequency, clinical course, and costs of care. Crit Care Med. 1999;27(11):2367–2374. doi: 10.1097/00003246-199911000-00008. [DOI] [PubMed] [Google Scholar]
- 7.Knaus WA, Draper EA, Wagner DP, Zimmerman JE. APACHE II: a severity of disease classification system. Crit Care Med. 1985;13(10):818–829. [PubMed] [Google Scholar]
- 8.Le Gall JR, Lemeshow S, Saulnier F. A new simplified acute physiology score (SAPS II) based on a European/north American multicenter study. JAMA. 1993;270(24):2957–2963. doi: 10.1001/jama.270.24.2957. [DOI] [PubMed] [Google Scholar]
- 9.Vincent JL, de Mendonca A, Cantraine F, Moreno R, Takala J, Suter PM, et al. Use of the SOFA score to assess the incidence of organ dysfunction/failure in intensive care units: results of a multicenter, prospective study. Working group on “sepsis-related problems” of the European Society of Intensive Care Medicine. Crit Care Med. 1998;26(11):1793–1800. doi: 10.1097/00003246-199811000-00016. [DOI] [PubMed] [Google Scholar]
- 10.Villar J, Ambros A, Soler JA, Martinez D, Ferrando C, Solano R, et al. Age, PaO2/FIO2, and plateau pressure score: a proposal for a simple outcome score in patients with the acute respiratory distress syndrome. Crit Care Med. 2016;44(7):1361–1369. doi: 10.1097/CCM.0000000000001653. [DOI] [PubMed] [Google Scholar]
- 11.Siddiqui S, Puthucheary Z, Phua J, Ho B, Tan J, Chuin S, et al. National survey of outcomes and practices in acute respiratory distress syndrome in Singapore. PLoS One. 2017;12(6):e0179343. doi: 10.1371/journal.pone.0179343. [DOI] [PMC free article] [PubMed] [Google Scholar]
- 12.Steyerberg EW, Vickers AJ, Cook NR, Gerds T, Gonen M, Obuchowski N, et al. Assessing the performance of prediction models: a framework for traditional and novel measures. Epidemiology. 2010;21(1):128–138. doi: 10.1097/EDE.0b013e3181c30fb2. [DOI] [PMC free article] [PubMed] [Google Scholar]
- 13.Bos LD, Schouten LR, Cremer OL, Ong DSY, Schultz MJ, consortium M External validation of the APPS, a new and simple outcome prediction score in patients with the acute respiratory distress syndrome. Ann Intensive Care. 2016;6(1):89. doi: 10.1186/s13613-016-0190-0. [DOI] [PMC free article] [PubMed] [Google Scholar]
- 14.Erickson SE, Shlipak MG, Martin GS, Wheeler AP, Ancukiewicz M, Matthay MA, et al. Racial and ethnic disparities in mortality from acute lung injury. Crit Care Med. 2009;37(1):1–6. doi: 10.1097/CCM.0b013e31819292ea. [DOI] [PMC free article] [PubMed] [Google Scholar]
- 15.Lemos-Filho LB, Mikkelsen ME, Martin GS, Dabbagh O, Adesanya A, Gentile N, et al. Sex, race, and the development of acute lung injury. Chest. 2013;143(4):901–909. doi: 10.1378/chest.12-1118. [DOI] [PMC free article] [PubMed] [Google Scholar]
- 16.Matthay MA, Ware LB, Zimmerman GA. The acute respiratory distress syndrome. J Clin Invest. 2012;122(8):2731–2740. doi: 10.1172/JCI60331. [DOI] [PMC free article] [PubMed] [Google Scholar]
- 17.Ahasic AM, Zhao Y, Su L, Sheu CC, Thompson BT, Christiani DC. Adiponectin gene polymorphisms and acute respiratory distress syndrome susceptibility and mortality. PLoS One. 2014;9(2):e89170. doi: 10.1371/journal.pone.0089170. [DOI] [PMC free article] [PubMed] [Google Scholar]
- 18.O'Mahony DS, Glavan BJ, Holden TD, Fong C, Black RA, Rona G, et al. Inflammation and immune-related candidate gene associations with acute lung injury susceptibility and severity: a validation study. PLoS One. 2012;7(12):e51104. doi: 10.1371/journal.pone.0051104. [DOI] [PMC free article] [PubMed] [Google Scholar]
- 19.Kangelaris KN, Sapru A, Calfee CS, Liu KD, Pawlikowska L, Witte JS, et al. The association between a Darc gene polymorphism and clinical outcomes in African American patients with acute lung injury. Chest. 2012;141(5):1160–1169. doi: 10.1378/chest.11-1766. [DOI] [PMC free article] [PubMed] [Google Scholar]
- 20.Lu XM, Chen GJ, Yang Y, Qiu HB. Angiotensin-converting enzyme polymorphism affects outcome of local Chinese with acute lung injury. Respir Med. 2011;105(10):1485–1490. doi: 10.1016/j.rmed.2011.06.009. [DOI] [PMC free article] [PubMed] [Google Scholar]
- 21.Zhai R, Gong MN, Zhou W, Thompson TB, Kraft P, Su L, et al. Genotypes and haplotypes of the VEGF gene are associated with higher mortality and lower VEGF plasma levels in patients with ARDS. Thorax. 2007;62(8):718–722. doi: 10.1136/thx.2006.069393. [DOI] [PMC free article] [PubMed] [Google Scholar]
- 22.Jerng JS, Yu CJ, Wang HC, Chen KY, Cheng SL, Yang PC. Polymorphism of the angiotensin-converting enzyme gene affects the outcome of acute respiratory distress syndrome. Crit Care Med. 2006;34(4):1001–1006. doi: 10.1097/01.CCM.0000206107.92476.39. [DOI] [PubMed] [Google Scholar]
- 23.Lesur O, Langevin S, Berthiaume Y, Legare M, Skrobik Y, Bellemare JF, et al. Outcome value of Clara cell protein in serum of patients with acute respiratory distress syndrome. Intensive Care Med. 2006;32(8):1167–1174. doi: 10.1007/s00134-006-0235-1. [DOI] [PubMed] [Google Scholar]
- 24.Murray JF, Matthay MA, Luce JM, Flick MR. An expanded definition of the adult respiratory distress syndrome. Am Rev Respir Dis. 1988;138(3):720–723. doi: 10.1164/ajrccm/138.3.720. [DOI] [PubMed] [Google Scholar]
- 25.Peek GJ, Mugford M, Tiruvoipati R, Wilson A, Allen E, Thalanany MM, et al. Efficacy and economic assessment of conventional ventilatory support versus extracorporeal membrane oxygenation for severe adult respiratory failure (CESAR): a multicentre randomised controlled trial. Lancet. 2009;374(9698):1351–1363. doi: 10.1016/S0140-6736(09)61069-2. [DOI] [PubMed] [Google Scholar]
- 26.Villar J, Kacmarek RM. The APPS: an outcome score for the acute respiratory distress syndrome. J Thorac Dis. 2016;8(10):E1343–E13E7. doi: 10.21037/jtd.2016.10.76. [DOI] [PMC free article] [PubMed] [Google Scholar]
- 27.Villar J, Blanco J, del Campo R, Andaluz-Ojeda D, Diaz-Dominguez FJ, Muriel A, et al. Assessment of PaO (2)/FiO (2) for stratification of patients with moderate and severe acute respiratory distress syndrome. BMJ Open. 2015;5(3):e006812. [DOI] [PMC free article] [PubMed]
Associated Data
This section collects any data citations, data availability statements, or supplementary materials included in this article.
Data Availability Statement
The datasets used and/or analysed during the current study are available from the corresponding author on reasonable request.


