

Abstract
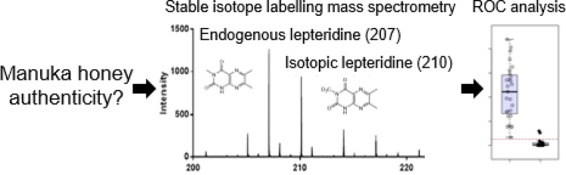
Manuka honey is a premium food product with unique antimicrobial bioactivity. Concerns with mislabeled manuka honey require robust assays to determine authenticity. Lepteridine is a Leptospermum-specific fluorescent molecule with potential as an authenticity marker. We describe a mass spectrometry-based assay to measure lepteridine based on an isotopically labeled lepteridine standard. Using this assay, lepteridine concentrations in manuka honey samples strongly correlated with concentrations quantitated by either high-performance liquid chromatography-ultraviolet (HPLC-UV) or fluorescence. A derived minimum lepteridine threshold concentration was compared with the New Zealand regulatory definition for manuka honey to determine “manuka honey” authenticity on a set of commercial samples. Both methods effectively distinguished manuka honey from non-manuka honeys. The regulatory definition excludes lepteridine but otherwise includes the quantification of multiple floral markers together with pollen analysis. Our findings suggest that the quantification of lepteridine alone or in combination with leptosperin could be implemented as an effective screening method to identify manuka honey, likely to achieve an outcome similar to the regulatory definition.
1. Introduction
Manuka honey from New Zealand is a high-value natural food product and also has biomedical applications in wound healing. One bioactivity that distinguishes manuka honey from other non-Leptospermum honeys is a non-peroxide antibacterial activity described as unique manuka factor (UMF),1 which has been attributed to the presence of methylglyoxal (MGO).2 MGO content increases in manuka honey over time as it is derived from the nectar precursor dihydroxyacetone (DHA), which spontaneously converts into MGO during storage and controlled heating.3,4
Unfortunately, because of its premium market value, non-manuka honeys are sometimes packaged and sold as manuka honey for increased commercial gain. There is therefore a need for robust assays to ensure that manuka honey is true to label. In addition, New Zealand kanuka and manuka honeys share the same geographical location and flowering season, which can make it difficult to distinguish these honey varieties.5,6 To address these issues, the New Zealand Ministry for Primary Industries (MPI) has developed a regulatory definition for monofloral and multifloral manuka honey using chemical fingerprinting together with pollen DNA polymerase chain reaction (PCR) analysis.7−10 These criteria are based on five key attributes: the presence of certain levels of 2′-methoxyacetophenone (2′-MAP), 2-methoxybenzoic acid (2-MB), 4-hydroxyphenyllactic acid (4-HPA), 3-phenyllactic acid (3-PA), and DNA from manuka pollen.
Our studies have demonstrated that two Leptospermum nectar-derived compounds, leptosperin and lepteridine, can also be utilized to determine manuka honey authenticity.11−15 Leptosperin and lepteridine are not currently included in the MPI definition yet are responsible for two unique fluorescent signatures in manuka honey, called MM1 and MM2.13,16 Principal component analysis on a range of manuka and non-manuka honeys show that both leptosperin and lepteridine together with the MPI-recommended compounds, 2-MB and 4-HPA, are the most significant contributors to the PC1 axis.11 Receiving operating characteristic curve (ROC) analyses for leptosperin and lepteridine, which are stable in honey over time unlike 2-MB,13 show a strong discriminatory power for distinguishing manuka honey.
One unanswered question is how the use of leptosperin/lepteridine performs relative to the MPI definition in discerning authentic manuka honeys from commercial manuka honey products that may or may not adhere to label claims. In this study, we focus on lepteridine and hypothesize that its quantitation potentially provides a simple and high-throughput mode of measurement to determine manuka honey authenticity. As mass spectrometry analyses are well established in commercial honey testing laboratories, we developed a technique for determining lepteridine content in honey based on a liquid chromatography tandem mass spectrometry (LC–MS/MS) approach utilizing an isotopically labeled lepteridine internal standard. Utilizing these various analyses for lepteridine, we first determined threshold values through measurements on manuka honey samples. We then quantified MPI-specified chemical markers (the pollen DNA marker was not included) versus lepteridine-specific analyses on a set of 33 “manuka” honey samples that were purchased from the commercial market of Singapore. Previous analyses of 17 of these 33 samples showed that 3 were either not manuka in origin or were potentially adulterated.16
2. Results and Discussion
2.1. Synthesis of Isotopically Labeled Lepteridine
Mass spectrometry is a powerful analytical tool in food science that has been applied in the analyses of numerous foods including milk products17,18 fruits,19,20 and beverages.21 Most of these methods employ an isotopically labeled standard to compensate for matrix effects between samples.22 Absolute quantification can be achieved by comparing relative ion abundance between the paired compounds. To reduce interference from background ions, quantification can be performed on specific fragment ions using tandem mass spectrometry.23
We utilized these principles to generate isotopically labeled lepteridine with the same physicochemical properties as native lepteridine but which can be identified by mass spectrometry due to the relative atomic mass difference. The use of a heavy isotope standard to quantitate lepteridine concentration in manuka honey required the synthesis of a suitable isotopically enriched analogue of lepteridine. Replacement of the methyl group at N-3 of lepteridine with a deuteromethyl group provided a mass difference of 3 amu, which was sufficient to differentiate the two isotopes by mass spectrometry (Figure 1A). The use of iodomethane-D3 in place of iodomethane14 facilitated the synthesis of isotopic lepteridine (Figure 1B).
Figure 1.

(A) Molecular structure of endogenous lepteridine (left) and the synthesized lepteridine isotope (right). (B) Total synthesis of isotopic lepteridine.
2.2. Validation of Isotopic LC–MS/MS Lepteridine Quantification
Figure 2A,B shows the mass spectrum of typical manuka honey before and after supplementation of isotopic lepteridine, respectively. As expected, endogenous and isotopically labeled lepteridine displayed almost identical MS/MS spectra and co-eluted at the same time. No significant interfering peaks were identified from endogenous compounds in manuka honey between m/z 210 and 212 (Figure 2A). The 3 amu mass difference between endogenous and isotopically spiked lepteridine was also clearly discernible in the mass spectrum (Figure 2B).
Figure 2.
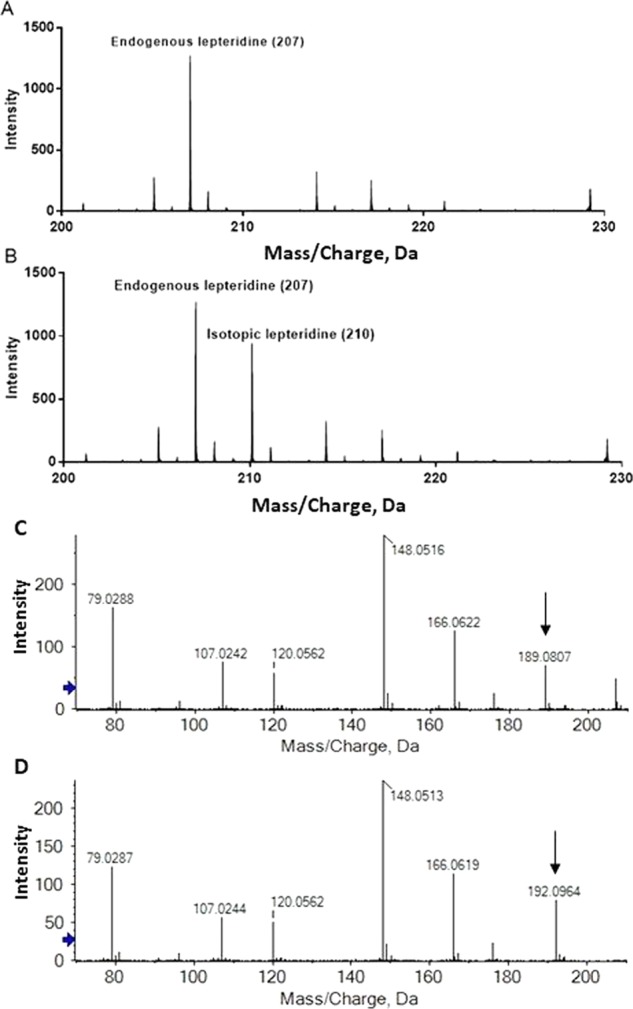
Mass spectrum of a typical manuka honey sample before (A) and after (B) supplementation with isotopic lepteridine. MS/MS spectrum of endogenous lepteridine (C) and isotopically labeled lepteridine (D). Black arrows denote a 3 amu shift in one of the fragment ions.
Figure 2C,D shows individual MS/MS spectra for endogenous and isotopic lepteridine, respectively. The two species were differentiated by a 3 amu shift in the fragment ion from m/z 189 (Figure 2C) to m/z 192 (Figure 2D). The most abundant common fragment ion observed at m/z 148.05 lacked the heavy isotopes and was employed for lepteridine quantification. The high ion count relative to the noise of this fragment ion minimized background interference. The final testing concentration of manuka honey was determined at 0.2% w/v to maintain an adequate signal-to-noise ratio and minimize instrument contamination with residual honey sugars.
2.2.1. Linearity
Linearity measures the proportionality of a method’s analytical response to the amount of analyte in the sample. The linearity of the LC–MS/MS method in this study was evaluated by regression statistics based on a 7-point calibration curve prepared in duplicate. The calibration concentrations of lepteridine ranged from 1 to 100 ng/mL, corresponding to a 0.5–50 mg/kg concentration range in undiluted manuka honey, while the isotopically labeled lepteridine was present at 20 ng/mL. The calibration curve of lepteridine over this concentration range was established by weighted (1/x2) linear regression analysis, where the coefficient correlation (r) from three independent analyses established over different days was determined to be ≥0.995 (Figure S1).
The calibration curve was linear with respect to the concentration range tested. Residual plots for each of the calibration curves did not show any obvious trend and appeared to be randomly distributed across the concentration range tested. All data points included in the calibration curves were within measurement accuracy of ±15% (Table S1).
2.2.2. Repeatability, Precision, and Reproducibility
Repeatability of the LC–MS/MS method was determined by supplementing lepteridine-free clover honey with lepteridine at three different concentrations spanning the working range in this study (3, 40, and 80 ng/mL). The analysis was performed using six replicate preparations, made independently over three different days. Precision was assessed by intraday repeatability and expressed as the percentage coefficient of variation (CV). The method showed good precision with CV ranging from 4.5 to 7.7, 5.1 to 7.4, and 2.4 to 9.0% at 3, 40, and 80 ng/mL measured over 3 days, respectively (Supporting Information Table S2). Interday repeatability was also assessed to determine the reproducibility of the method over time. Lepteridine was reproducibly measured over three different days with overall CVs of 7.9, 6.4, and 5.8% at 3, 40, and 80 ng/mL, respectively (Supporting Information Table S3).
2.2.3. Sensitivity (Limit of Detection, LOD, and Limit of Quantification, LOQ)
Detection sensitivity is expressed in terms of limit of detection (LOD) and limit of quantification (LOQ). The LOD of the method was calculated based on 3 time standard deviation (SD) of analyte area under curve (AUC) from 10 blank honey runs, and the LOQ was based on 10 times of this standard deviation.
The standard deviation (SD) of the AUC for the lepteridine fragment ion from 10 blank clover honey samples was determined to be 6.3 counts, giving a theoretical LOD peak area of 18.8 counts (3 × SD) and a theoretical LOQ peak area of 62.5 counts (10 × SD). To allow a generous margin of error, the working range for this method was set to 1–100 ng/mL (corresponding to 0.5–50 mg/kg lepteridine in raw honey) for which the lowest calibration standard gave a mean AUC of 144 counts across the three batches (n = 6, intensity range 101–211 counts). This is more than double the required 10× SD value for the LOQ. The LOD of this method was calculated to be far lower at 0.15 ng/mL (corresponding to 0.075 mg/kg raw honey). Given that the expected minimum threshold of lepteridine concentration in genuine manuka honey is around 2.5 mg/kg, this working range was deemed more than sufficient to discriminate manuka honey from non-manuka honey samples.
2.2.4. Interference
The absence of interference was demonstrated by a lack of signal for both lepteridine and its isotope-labeled counterpart in nonspiked clover honey and a lack of an isotopic lepteridine signal in manuka honey (Figure S2). Additionally, supplementation of the heavy isotopic lepteridine into clover honey did not interfere with the lepteridine signal (Figure S3).
2.2.5. Matrix Effect and Recovery
Matrix effects and recovery were assessed by comparison of the solution and honey supplemented with lepteridine at 3, 40, and 80 ng/mL. Matrix recovery was 97.6–104% at these concentrations, with no significant change in background signals for the lepteridine peaks in honey compared to those in the solution (Table S4).
2.3. Comparison between Lepteridine Quantification Using LC–MS/MS, High-Performance Liquid Chromatography-Ultraviolet (HPLC-UV), and Fluorescence Methods
Authentic field-collected manuka honey samples harvested throughout the North Island of New Zealand were analyzed to quantitate endogenous lepteridine concentrations (Table 1). Mass spectrometry analyses employing isotopically labeled lepteridine as an internal standard yielded lepteridine concentrations ranging between 3 and 44 mg/kg. These lepteridine concentrations correlated well with lepteridine concentrations quantified by either HPLC (Figure 3A, R2 = 0.9517) or by fluorescence at the MM2 wavelength (Figure 3B, R2 = 0.8995) on the same honey set.
Table 1. Field-Collected Honey Samples.
| sample | honey type | geographic origin | DHA (mg/kg) | MGO (mg/kg) | lepteridine (mg/kg)a |
|---|---|---|---|---|---|
| 1 | Manuka | Northland | 3830 | 399 | 43.9 |
| 2 | Manuka | Northland | 3430 | 401 | 13.9 |
| 3 | Manuka | Northland | 3570 | 300 | 29.6 |
| 4 | Manuka | Northland | 4210 | 542 | 24.5 |
| 5 | Manuka | Northland | >4590 | 454 | 27.0 |
| 6 | Manuka | Northland | 3800 | 395 | 22.3 |
| 7 | Manuka | Northland | 2552 | 862 | 25.3 |
| 8 | Manuka | Taupo | 2530 | 219 | 27.3 |
| 9 | Manuka | Taupo | 3340 | 385 | 26.8 |
| 10 | Manuka | Taupo | >4570 | 451 | 39.2 |
| 11 | Manuka | Taupo | >4550 | 371 | 28.6 |
| 12 | Manuka | Taupo | 3840 | 332 | 31.0 |
| 13 | Manuka | Taupo | 2830 | 511 | 19.4 |
| 14 | Manuka | Waikato | 2098 | 755 | 12.0 |
| 15 | Manuka | Waikato | 2083 | 782 | 14.0 |
| 16 | Manuka | Waikato | 2085 | 710 | 14.4 |
| 17 | Manuka | East Coast | 1331 | 397 | 16.6 |
| 18 | Manuka | East Coast | 1073 | 482 | 32.5 |
| 19 | Manuka | East Coast | 1066 | 476 | 7.66 |
| 20 | Manuka | East Coast | 1081 | 514 | 7.79 |
| 21 | Manuka | East Coast | 2097 | 753 | 12.3 |
| 22 | Manuka | Wairarapa | 2080 | 143 | 3.36 |
| 23 | Manuka | Wairarapa | 1483 | 103 | 8.09 |
| 24 | Manuka | Wairarapa | 1854 | 143 | 7.69 |
| 25 | Manuka | Wairarapa | 957 | 61 | 40.6 |
| 26 | Manuka | Wairarapa | 1413 | 139 | 19.1 |
| 27 | Manuka | Wairarapa | 1910 | 125 | 35.7 |
| 28 | Kanuka | Taupo | <20 | 11 | <LOD |
| 29 | Kanuka | Taupo | <20 | 10 | <LOQ |
| 30 | Kanuka | Taupo | 620 | 155 | 5.23 |
| 31 | Kanuka | Northland | 92 | 36 | 1.55 |
| 32 | Kanuka | Northland | 437 | 104 | 5.94 |
| 33 | Kanuka | Northland | <20 | 10 | <LOQ |
| 34 | Clover | Southland | <20 | 8 | <LOD |
| 35 | Clover | Southland | <20 | 7 | <LOD |
| 36 | Clover | Taupo | 114 | 30 | 0.76 |
| 37 | Clover | Southland | <20 | 6 | <LOD |
| 38 | Clover | Southland | 568 | 50 | 0.65 |
| 39 | Clover | Southland | <20 | 9 | <LOD |
| 40 | Clover | Southland | <20 | 6 | <LOD |
| 41 | Clover | Taupo | 287 | 34 | 1.58 |
| 42 | Clover | Southland | 222 | 39 | <LOQ |
| 43 | Clover | Southland | 318 | 33 | <LOQ |
| 44 | Tawari | Taupo | 35 | 12 | <LOQ |
| 45 | Tawari | Taupo | 134 | 20 | 0.74 |
| 46 | Tawari | Taupo | <20 | 11 | <LOQ |
| 47 | Pohutukawa | Northland | 175 | 30 | 1.06 |
| 48 | Pohutukawa | Northland | 203 | 37 | 1.19 |
| 49 | Pohutukawa | Northland | <20 | 7 | <LOD |
| 50 | Kamahi | Taupo | <20 | 11 | <LOD |
| 51 | Kamahi | Taupo | <20 | 7 | <LOQ |
| 52 | Kamahi | Southland | <20 | 5 | <LOD |
| 53 | Rewarewa | Taupo | 274 | 38 | 1.794 |
DHA and MGO concentrations were supplied by Comvita NZ Limited; lepteridine concentrations were quantified using the LC–MS/MS isotopic method.
Figure 3.

(A) Correlation between lepteridine concentration quantified by LC–MS/MS and HPLC (R2 = 0.9517). (B) Correlation between lepteridine concentration quantified by LC–MS/MS and fluorescence intensity at 330–470 nm (R2 = 0.8995). n = 27.
Compared to quantitation by HPLC-UV,15 lepteridine concentrations were reduced by approximately 24% when measured using mass spectrometry. This difference is likely due to the presence of other UV-absorbing compounds co-eluting with lepteridine under the same HPLC peak. We previously identified the presence of these compound(s) by 1H NMR spectra of lepteridine fractions purified by HPLC (B.J. Daniels, unpublished observations). Ultimately, structural elucidation of lepteridine was reliant on direct-phase preparative thin-layer chromatography (TLC) to remove these species,14 one of which was identified as 6,7-dimethyl-2,4(1H,3H)-pteridinedione.24 This compound also fluoresces at the lepteridine signature MM2 wavelength24 and so will also contribute to the MM2 fluorescent signature. Based on this information, mass spectrometry is the more accurate approach for lepteridine quantification in manuka honey.
2.4. Determining Manuka Honey Authenticity Using Lepteridine
Using ROC analyses of field-collected manuka honey samples (Table 1, samples 1–27) against non-manuka honey samples (Table 1, samples 28–53), a minimum lepteridine threshold concentration of 2.6 mg/kg was derived, as measured by mass spectrometry (Figure 4A). This value is similar to a previous minimum lepteridine threshold value of 2.1 mg/kg as quantified by HPLC-UV using a different set of field-collected manuka honey samples.11 This threshold lepteridine concentration corresponded to a minimum fluorescence threshold of 537 RFU with the fluorescent plate reader utilized in the laboratory (Figure 4B). The respective areas under the curves (AUCs = 0.997 and 0.996, Figure 4A,B, left panel) support the accuracy of these tests. The cutoff points (Figure 4A,B, right panels) were determined based on the positive likelihood ratio.
Figure 4.
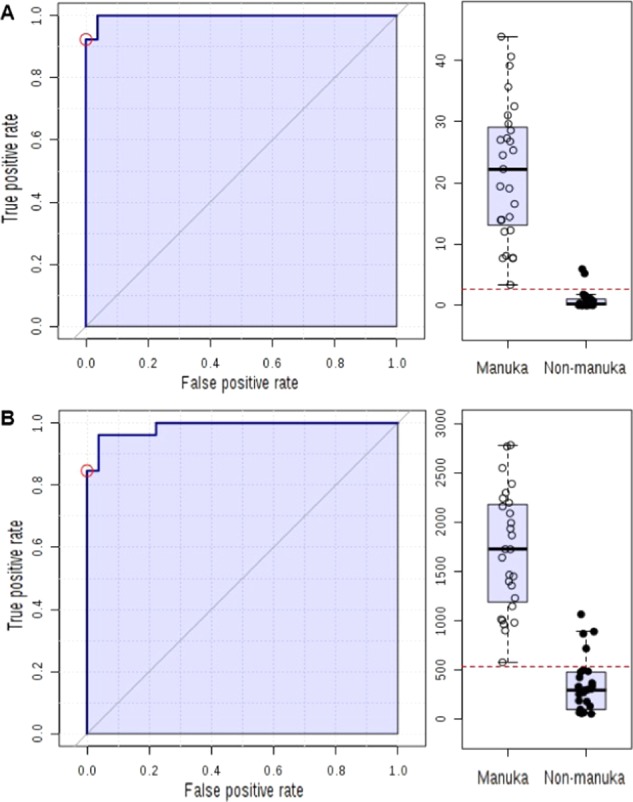
ROC analysis for manuka honey and non-manuka honey. (A) Lepteridine concentration measured using mass spectrometry (AUC = 0.997). (B) Signature fluorescence of lepteridine at ex330–em470 nm (AUC = 0.996).
Minimum lepteridine threshold concentrations derived by ROC analyses using either mass spectrometry or fluorescence were then used to determine the authenticity of 33 commercial samples purchased from Singapore in 2016 (Table 2). These honeys were all labeled as manuka in market; however, a previous analysis of 17 of these samples found three were not true to label and incorrectly marketed as manuka honey.16 Compositional analyses of these 33 honey samples are shown in Table 2. Based on the minimum lepteridine threshold derived by either mass spectrometry or fluorescence, samples 24–33 and 22–33 were identified as mislabeled, respectively. The concentrations of commonly recognized manuka honey markers are provided for reference (Table 2).
Table 2. Commercial Manuka Samples Purchased from Singapore.
| |
compound
concentrationa (mg/kg) |
classificationb |
||||||||||
|---|---|---|---|---|---|---|---|---|---|---|---|---|
| sample | lepteridine fluorescence (RFU) | lepteridine | 4-HPA | 3-PA | 2-MB | 2′-MAP | leptosperin | DHA | MGO | lepteridine (RFU) | lepteridine (LC/MS) | MPI |
| 1 | 933 | 8.5 | 8.2 | 793 | 3.5 | 10.4 | 497 | 594 | 375 | √ | √ | √ |
| 2 | 1046 | 8.8 | 4.5 | 910 | 3.0 | 7.8 | 377 | 711 | 542 | √ | √ | √ |
| 3 | 1066 | 10.6 | 3.7 | 1164 | 3.1 | 6.2 | 394 | 1650 | 435 | √ | √ | √ |
| 4 | 550 | 3.5 | 7.9 | 445 | 5.3 | 5.4 | 255 | 192 | 110 | √ | √ | √ |
| 5 | 816 | 6.7 | 3.9 | 635 | 7.3 | 9.0 | 477 | 264 | 515 | √ | √ | √ |
| 6 | 1212 | 14.6 | 4.1 | 1604 | 9.0 | 10.1 | 554 | 933 | 1110 | √ | √ | √ |
| 7 | 1171 | 9.9 | 4.1 | 1195 | 7.1 | 16.7 | 411 | 419 | 915 | √ | √ | √ |
| 8 | 1270 | 15.0 | 3.4 | 1012 | 6.2 | 13.5 | 615 | 660 | 688 | √ | √ | √ |
| 9 | 814 | 6.8 | 5.6 | 509 | 4.4 | 6.1 | 383 | 262 | 224 | √ | √ | √ |
| 10 | 1047 | 6.3 | 4.0 | 707 | 2.5 | 6.7 | 347 | 911 | 372 | √ | √ | √ |
| 11 | 1390 | 13.6 | 2.9 | 1105 | 10.5 | 15.0 | 733 | 907 | 939 | √ | √ | √ |
| 12 | 936 | 5.4 | 2.7 | 1090 | 18.9 | 10.0 | 234 | 133 | 682 | √ | √ | √ |
| 13 | 849 | 5.7 | 5.5 | 989 | 7.9 | 5.3 | 318 | 712 | 585 | √ | √ | √ |
| 14 | 1500 | 17.8 | 9.0 | 908 | 3.7 | 9.7 | 504 | 349 | 777 | √ | √ | √ |
| 15 | 902 | 5.7 | 4.4 | 857 | 3.0 | 7.2 | 360 | 647 | 402 | √ | √ | √ |
| 16 | 1199 | 7.3 | 6.6 | 932 | 2.3 | 9.5 | 458 | 1070 | 715 | √ | √ | √ |
| 17 | 1334 | 18.2 | 6.9 | 969 | 3.2 | 8.6 | 607 | 855 | 888 | √ | √ | √ |
| 18 | 754 | 8.6 | 3.3 | 629 | 2.7 | 4.3 | 278 | 976 | 313 | √ | √ | × |
| 19 | 574 | 3.5 | 2.6 | 338 | 2.1 | 2.2 | 168 | 160 | 121 | √ | √ | × |
| 20 | 539 | 3.4 | 3.8 | 195 | 3.5 | 2.7 | 152 | 231 | 103 | √ | √ | × |
| 21 | 921 | 3.9 | 6.3 | 379 | 4.5 | 14.6 | 123 | 36 | 70 | √ | √ | × |
| 22 | 355 | 3.0 | 0.9 | 730 | 3.5 | 3.2 | 157 | 85 | 128 | × | √ | × |
| 23 | 481 | 3.6 | 2.7 | 1079 | nd | 6.4 | 173 | 295 | 140 | × | √ | × |
| 24 | 469 | 1.5 | 2.2 | 584 | 5.0 | 6.0 | 168 | 221 | 241 | × | × | √ |
| 25 | 511 | 1.2 | 3.8 | 402 | 2.8 | 4.6 | 231 | 165 | 94 | × | × | × |
| 26 | 458 | 2.4 | 5.7 | 717 | 1.6 | 2.9 | 156 | 94 | 117 | × | × | × |
| 27 | 491 | 1.8 | 3.6 | 411 | 5.1 | 3.4 | 276 | 354 | 149 | × | × | × |
| 28 | 438 | 2.5 | 1.9 | 296 | 3.1 | 3.2 | 157 | 157 | 124 | × | × | × |
| 29 | 422 | 2.2 | 2.7 | 257 | 2.9 | 3.4 | 138 | 50 | 69 | × | × | × |
| 30 | 359 | 1.1 | n.d. | 103 | 3.7 | 3.0 | 73 | 57 | 59 | × | × | × |
| 31 | 314 | 1.2 | n.d. | 142 | 1.0 | 2.6 | 75 | 52 | 59 | × | × | × |
| 32 | 375 | <LOQ | 10.4 | 1330 | nd | 3.4 | 63 | <10 | 46 | × | × | × |
| 33 | 342 | 1.5 | 4.6 | 1645 | nd | 2.6 | 51 | <10 | 33 | × | × | × |
Lepteridine concentrations were quantified using the LC–MS/MS isotope dilution method; 4-HPA, 3-PA, 2-MB, 2′-MAP, and leptosperin concentrations were quantified by HPLC-UV; DHA and MGO concentrations were quantified and supplied by the UMF Honey Association (UMFHA).
Classification as monofloral manuka honey (√) or not monofloral manuka honey (×).
We then compared these findings for lepteridine with the chemical markers employed in the MPI definition for the determination of manuka honey9 based on the presence of 2′-MAP, 2-MB, 4-HPA, and 3-PA (Table 2). As all commercial samples were labeled as “manuka honey”, we only applied the monofloral MPI definition. These classifications are mostly in agreement with the lepteridine-based analyses using the derived mass spectrometry and fluorescence minimum threshold values of 2.6 mg/kg and 537 RFU, respectively. Nevertheless, there were also some differences in classification between the MPI or lepteridine-based criteria for seven of the 33 honey samples (samples 18–24). MPI-based criteria also identified honey samples 22 and 23 as mislabelled, which is consistent with the lepteridine minimum threshold based on fluorescence but not mass spectrometry.
Overall, both MPI and lepteridine-based criteria compared well across the 33 honey samples labeled as manuka with 79% (26/33) agreement using mass spectrometry quantification and 85% (28/33) using fluorescence measurement. One caveat is that DNA pollen analysis was not available for these honey samples. Consequently, the MPI authenticity criteria is based solely on the implemented chemical marker compounds. For comparison, leptosperin concentrations in these honey samples are shown in Table 2. Analyzing these honey samples based on leptosperin-based criterion alone with a minimum threshold of 94 mg/kg11 classified all but four samples (30–33) as monofloral honeys, equating to a 52% agreement with the MPI-based criteria. Thus, at least on this commercial honey set, classification based solely on lepteridine best aligns with MPI-based criteria.
In summary, our findings demonstrate the application of the chemical marker, lepteridine, in manuka honey authentication as quantified by either HPLC-UV, LC–MS/MS, and fluorescence spectroscopy. Notably, outcomes based on lepteridine alone compare favorably with the MPI regulatory definition to identify mislabelled manuka honey. Potentially, the isotopic mass spectrometry method described here for lepteridine could be incorporated together with analyses of other established chemical markers using LC/MS capability, which is commonly embedded within current honey testing facilities. Mass spectrometry offers increased specificity and sensitivity over other types of analysis methods, and the isotopic method could be refined further through optimization of flow rates and column selection to decrease cycle time.
Fluorescence quantitation of lepteridine content in honey also offers a convenient method for fieldwork. The current MPI regulatory definition was not designed to be applied in the field; it requires quantification by mass spectrometry of four chemical markers combined with quantitative polymerase chain reaction (qPCR) analysis of pollen DNA, which also requires specialized expertise. In comparison, lepteridine, which is stable over time in contrast to some other manuka markers currently in use, can be easily and rapidly quantified by fluorescence using a conventional plate reader. Here, an instrument housed on-site could be calibrated from a set of honey standards with known lepteridine content to generate a fluorescence standard curve from which a minimum threshold value can be derived. In this way, the unique fluorescence signature of lepteridine15 potentially, together with leptosperin,12 offers low-cost and high-throughput screening opportunities for on-site honey and nectar analyses, particularly with the potential development of portable fluorescent devices.
3. Materials and Methods
3.1. Honey Samples
Three honey sample collections were kindly provided by Comvita NZ Ltd. (Te Puke, New Zealand). The first comprised 27 field manuka honey samples collected from five different regions throughout New Zealand in 2009 (Table 1, samples 1–27). The floral source of these field-collected manuka honey samples was confirmed by recognized experts and beekeepers based on site analysis and flowering season. The second collection was a set of non-manuka honey samples comprising kanuka, clover, tawari, pohutukawa, kamahi, and rewarewa (Table 1, samples 28–53). These non-manuka honey samples were collected by Oritain Global Ltd. (Otago, New Zealand) in 2011, and corresponding compositional data was established by Hills Laboratory Ltd. (Hamilton, New Zealand). The third collection comprised a set of honey samples purchased from a commercial market in Singapore that were all labeled as manuka honey (Table 2). These honeys were purchased by the UMF Honey Association (UMFHA). It needs to be noted that the UMFHA samples were collected from the market before the MPI regulatory definition came into effect. All honey samples were stored at 4 °C in dark conditions prior to analysis.
3.2. Honey Sample Preparation
All honey samples were brought to room temperature and thoroughly mixed to ensure homogeneity. Manuka honey solutions (0.2% w/v) were prepared by diluting manuka honey 500-fold in 0.1% formic acid. Isotopic lepteridine was spiked into each honey sample to achieve a final concentration of 20 ng/mL. All samples were thoroughly vortexed until completely dissolved in 0.1% formic acid solution.
3.3. Synthesis of Isotopically Labeled Lepteridine
All reactions were carried out in flame- or oven-dried glassware under a dry nitrogen atmosphere. All reagents were purchased as reagent grade and used without further purification. Dimethylformamide was degassed and dried using an LC Technical SP-1 solvent purification system. Ethanol was distilled over Mg(OEt)2. Ethyl acetate, methanol, and petroleum ether were distilled prior to use. All other solvents were used as received, unless stated otherwise. Flash chromatography was carried out using 0.063–0.1 mm silica gel with the desired solvent. Thin-layer chromatography (TLC) was performed using 0.2 mm Kieselgel F254 (Merck) silica plates, and compounds were visualized using UV irradiation at 254 nm or 365 nm and/or staining with a solution of potassium permanganate and potassium carbonate in aqueous sodium hydroxide. Melting points were determined on a Kofler hot-stage apparatus. Infrared spectra were obtained using a PerkinElmer Spectrum 100 FTIR spectrometer on a film attenuated total reflection (ATR) sampling accessory. Absorption maxima are expressed in wavenumbers (cm–1).
NMR spectra were recorded as indicated on either a Bruker Avance 400 spectrometer operating at 400 MHz for 1H nuclei and at 100 MHz for 13C nuclei, a Bruker DRX-400 spectrometer operating at 400 MHz for 1H nuclei and at 100 MHz for 13C nuclei, a Bruker Avance AVIII-HD 500 spectrometer operating at 500 MHz for 1H nuclei and at 125 MHz for 13C nuclei, or a Bruker Avance 600 spectrometer operating at 600 MHz for 1H nuclei and at 150 MHz for 13C nuclei. 1H and 13C chemical shifts are reported in parts per million (ppm) relative to CDCl3 (1H and 13C) or (CD3)2SO (1H and 13C). 1H NMR data is reported as chemical shift, relative integral, multiplicity (s, singlet; assignment). Assignments were made with the aid of correlation spectroscopy (COSY), nuclear Overhauser effect spectroscopy (NOESY), heteronuclear single quantum correlation (HSQC), and heteronuclear multiple bond correlation (HMBC) experiments where required. High-resolution mass spectra were recorded on a Bruker micrOTOF-Q II mass spectrometer with an ESI ionization source.
3.3.1. 6-Amino-3-(2H3)methyluracil
6-Aminouracil (1.05 g, 8.29 mmol) was suspended in hexamethyldisilazane (HMDS) (5 mL), and sulfuric acid (0.02 mL) was added. The mixture was heated at reflux for 1.5 h and then concentrated in vacuo. The residue was dissolved in dimethylformamide (6 mL), and iodomethane-d3 (0.8 mL, 12.9 mmol) was added. Stirring was continued for 72 h at room temperature. The reaction was cooled to 0 °C, and sodium bicarbonate (15 mL) was carefully added. The mixture was stirred at 0 °C until no further bubbling was observed. The precipitate was filtered, washed with methanol and water, and dried to give a yellow solid (0.43 g, 36%) which was used without further purification, mp 340–345 °C (decomposition), 1H NMR (400 MHz, DMSO-d6): δ = 10.35 (1H, s, H-1), 6.15 (2H, s, NH2), 4.56 (1H, s, H-5); 13C NMR (100 MHz, DMSO-d6): δ = 163.2 (C-4), 153.5 (C-6), 151.1 (C-2), 74.0 (d, J = 168.1 Hz, C-4); IR (neat, cm–1) = 3417, 3193, 1632, 1587, 1434, 1237, 788; HRMS (ESI): calculated for C5H4D3N3O2Na+ [M + Na+] 167.0619; found: 167.0618.
3.3.2. 6-Amino-3-(2H3)methyl-5-nitrosouracil
6-Amino-3-(2H3)methyluracil (0.40 g, 2.76 mmol) was suspended in water (5 mL). The suspension was heated at reflux for 2.5 h and then cooled to room temperature. Acetic acid (1.68 g, 28.0 mmol) was added. A solution of sodium nitrite (0.46 g, 6.70 mmol) in water (4 mL) was then added dropwise over 5 min, during which time the pale-yellow suspension became gray. The mixture was stirred for 5 min before the precipitate was filtered, washed with methanol and water, and then dried to give a gray solid compound (0.39 g, 81%) which was used without further purification, mp > 350 °C. 1H NMR (400 MHz, CDCl3) δ = 11.37 (1H br, s, H-1), 7.98 (2H br, s, NH2); 13C NMR (100 MHz, DMSO-d6) δ = 161.4 (C-4), 149.4 (C-2), 144.5 (C-6), 139.7 (C-5); IR (neat, cm–1) = 3207, 3012, 1719, 1649, 1517, 1430, 1251, 1045, 768; HRMS (ESI): calculated for C5H3D3N4O3Na+ [M + Na+] 196.0520; found: 196.0527.
3.3.3. 5,6-Diamino-3-(2H3)methyluracil
6-Amino-3-(2H3)methyl-5-nitrosouracil (0.12 g, 0.71 mmol) was suspended in a mixture of ammonium hydroxide (1.5 mL, 28–30%) and water (1.75 mL). The suspension was heated to 70 °C, and sodium dithionite (0.51 g, 2.93 mmol) was added portion-wise over 25 min until the red solution became pale-yellow. The mixture was stirred at 70 °C for 1 h before being concentrated in vacuo. The crude solid was then continuously extracted with refluxing ethanol (70 mL) for 3 h, and the extract was concentrated in vacuo to give a yellow solid (0.04 g, 37%), mp 222–225 °C (decomposition), 1H NMR (400 MHz, CDCl3) δ = 10.69 (1H br, s, H-1), 6.93 (2H br, s, NH2), 3.33 (2H br, s, NH2); 13C NMR (100 MHz, DMSO-d6) δ = 164.2 (C-4), 156.9 (C-6), 153.5 (C-2), 141.3 (C-5); IR (neat, cm–1) = 3330, 2919, 1701, 1595, 1459, 1171, 962; HRMS (ESI): calculated for C5H5D3N4O2Na+ [M + Na+] 160.0908; found: 160.0918.
3.3.4. 3,6,7-(3-2H3)Trimethyllumazine
5,6-Diamino-3-(2H3)methyluracil (0.04 g, 0.26 mmol) was suspended in ethanol (2 mL). 2,3-Butandione (0.03 g, 0.33 mmol) and acetic acid (0.07 g, 1.22 mmol) were added. The mixture was heated at reflux for 24 h before being cooled to room temperature and concentrated in vacuo. The crude product was purified by flash chromatography (petroleum ether–EtOAc 1:4) to give a colorless solid (0.02 g, 36%). An analytical sample was recrystallized from a mixture of chloroform and ethanol (1:1), mp 274–277 °C. 1H NMR (400 MHz, CDCl3) δ = 9.53 (1H, s, H-1), 2.66 (3H, s, C7-CH3), 2.65 (3H, s, C6-CH3);13C NMR (100 MHz, CDCl3) δ = 161.1 (C-4), 158.9 (C-6), 150.6 (C-7),* 150.4 (C-2),* 145.0 (C-8a), 123.7 (C-4a), 22.8 (C6-CH3), 21.9 (C7-CH3) (*assignments are interchangeable); IR (neat, cm–1) = 2920, 1724, 1662, 1561, 1353, 1274, 940; HRMS (ESI): calculated for C9H7D3N4O2Na+ [M + Na+] 232.0888; found: 232.0888.
3.4. LC–MS/MS Quantification of Lepteridine
HPLC-grade acetonitrile and formic acid were purchased from Merck. Water was purified using a Barnstead Nanopure Diamond laboratory water system. A 10 μL injection was made of each sample directly onto a 0.3 × 100 mm Zorbax 300SB- C18 column (Agilent, Santa Clara, CA) at 12 μL/min for 6 min. The HPLC gradient between buffer A (0.1% formic acid in water) and buffer B (0.1% formic acid in acetonitrile) was formed at 6 μL/min as follows: 10% B for the first 3 min, increasing to 25% B by 18 min, increasing to 97% B by 21 min, held at 97% until 24 min, back to 10% B at 25.5 min, and held there until 30 min. The LC effluent was directed into the ion spray source of a QSTAR XL hybrid quadrupole time-of-flight mass spectrometer (Applied Biosystems, Foster City, CA) scanning from 150 to 800 m/z. Two precursor ions at m/z 207 and 210 corresponding to endogenous lepteridine and the heavy lepteridine standard, respectively, were selected for further MS/MS analyses. The respective fragment ions were monitored between m/z 70 and 210 with a collision energy of 35 V. The mass spectrometer and HPLC system were under the control of the Analyst QS 2.0 software package (Applied Biosystems, Waltham, MA).
3.5. Isotopic LC–MS/MS Method Validation
Validation of the isotopically labeled lepteridine-based LC–MS/MS method was performed based on the Eurachem international guidelines.25 Several validation parameters were assessed including linearity, repeatability, detection sensitivity, interference, matrix effect, and recovery. Quantification was achieved by measuring the area under curve (AUC) ratio of endogenous lepteridine to isotopically labeled lepteridine (known concentration of 20 ng/mL in solution) for a common, selected fragment ion (m/z 148.05). Quantitation was based on the area under curve ratio of lepteridine fragment ion peak area to isotopically labeled lepteridine fragment ion peak area, where the amount of isotopic lepteridine is known (20 ng/mL). The method validation procedure was carried out to cater for a working range of 0.5–50 mg/kg, covering the typical concentrations of endogenous lepteridine present in New Zealand manuka honey.11
Linearity was established by regression statistics using calibration standards prepared in clover honey that lack measurable levels of endogenous lepteridine. Repeatability of the method was determined by three independent runs on different days using freshly prepared quality control (QC) samples analyzed in six replicates. Ten blank clover honey samples were selected for sensitivity determination. The limit of detection (LOD) and limit of quantitation (LOQ) were determined based on 3- and 10-time standard deviation (SD) of ten blank honey runs, respectively. Matrix effects and recovery were assessed by spiking a non-manuka honey with known levels of lepteridine spanning the working range (3, 40, and 80 mg/kg) in triplicate and comparing to the corresponding responses in the honey-free solution (0.1% formic acid).
3.6. HPLC-UV Quantification
HPLC quantification was performed using the method described previously.11 A Thermo Scientific Dionex Ultimate 3000 Standard system (Thermo Fisher Scientific Inc., Bremen, Germany) was employed, coupled to a quaternary pump (LPG-3400SD), an Ultimate analytical autosampler (WPS-3000TSL), and a diode array detector (DAD-3000). Data acquisition, peak integration, and calibrations were performed with Dionex Chromeleon 7.2 chromatography data system software. Separations were carried out on a Hypersil GOLD column (150 × 2.1 mm; 3 μm) (Dionex, NZ) connected to a Guard column (10 × 2.1 mm; 3 μm Hypersil), using a binary mobile phase consisted of 0.1% aqueous formic acid (solvent A) and acidified methanol containing 0.1% formic acid (solvent B). The temperature of the column compartment (TCC-3000SD) was set at 32 °C.
All honey samples were diluted to a final concentration of 0.1 g/mL, followed by centrifugation at 14 500 rpm for 5 min. A total volume of 100 μL was then loaded onto a 96-well microplate (Greiner Bio-One, polystyrene, conical bottom) for each diluted honey sample. The injection volume was 5 μL for all samples. Elution was performed with the following gradient: 0–2 min, 2% B; 2–5 min, 5% B; 5–15 min, 25% B; 15–25 min, 50% B; and 25–31 min, 100% B, followed by washing (held 3 min, 100% B) and reconditioning (held 10 min, 2% B). The flow rate and temperature were set to 0.16 mL/min at 32 °C. Samples were monitored according to the UV absorbance at four different wavelengths of 250, 265, 280, and 330 nm. Compound concentrations were quantified against external calibration curves of respective chemical standards based on the peak area under curve (AUC).
3.7. Fluorescence Spectroscopy
Fluorescence measurements were performed using a Gemini EM dual-scanning microplate spectrofluorometer (Molecular Devices Inc. San Jose, CA) coupled with SoftMax Pro software. Honey dilutions were freshly prepared at 2% w/v, and a 100 μL aliquot was loaded into each microplate well (OptiplateTM-384, black). The spectrofluorometer was set to top-read with activated autocalibration and automatic photomultiplier tube (PMT) sensitivity.
3.8. Data Analysis
Extracted ion chromatograms for the fragment ion of m/z 148.05 ± 0.1 Da from lepteridine and the heavy isotope-labeled standard were created and integrated using MultiQuant v3.0 (Sciex). Statistical data analyses were performed using Graphpad Prism software (version 6.01). All correlations were determined by regression analysis. Differences between group means were determined by one-tailed Student’s t-test. ROC analyses were performed using MetaboAnalyst 3.0 (http://www.metaboanalyst.ca).
Acknowledgments
This work was supported by Callaghan Innovation and Comvita NZ Ltd. We would like to thank Comvita NZ Ltd. for providing the honey samples.
Supporting Information Available
The Supporting Information is available free of charge at https://pubs.acs.org/doi/10.1021/acsomega.0c00486.
Data related to validation of the lepteridine isotopic LC–MS/MS method; three independently prepared calibration curves for lepteridine (1–100 ng/mL) based on weighted linear regression of peak area ratios (lepteridine/isotopically labeled lepteridine) for the selected common fragment ion m/z 148.05 (Figure S1); representative extracted ion chromatograms for the common fragment ion m/z 148.05 from (A) unspiked clover honey and (B) unspiked manuka honey showing the lepteridine and heavy isotope-labeled lepteridine channels (Figure S2); accuracy of isotopically labeled lepteridine-based mass spectrometry measurement as determined by the percentage of theoretical concentration and correlation coefficient (Table S1); precision (intraday repeatability) of lepteridine quantification expressed as % CV (Table S2); reproducibility (interday precision) of LC−MS/MS lepteridine quantitation determined as % CV (Table S3); and recovery of lepteridine calculated based on difference between amount recovered from spiked honey and from honey-free solution (Table S4) (PDF)
The authors declare the following competing financial interest(s): The authors declare the following competing nancial interest(s): J.B and J.S are employees of Comvita NZ Ltd.
Supplementary Material
References
- Allen K. L.; Molan P. C.; Reid G. M. A survey of the antibacterial activity of some New Zealand honeys. J. Pharm. Pharmacol. 1991, 43, 817–822. 10.1111/j.2042-7158.1991.tb03186.x. [DOI] [PubMed] [Google Scholar]
- Adams C. J.; Boult C. H.; Deadman B. J.; Farr J. M.; Grainger M. N.; Manley-Harris M.; Snow M. J. Isolation by HPLC and characterisation of the bioactive fraction of New Zealand manuka (Leptospermum scoparium) honey. Carbohydr. Res. 2008, 343, 651–9. 10.1016/j.carres.2007.12.011. [DOI] [PubMed] [Google Scholar]
- Adams C. J.; Manley-Harris M.; Molan P. C. The origin of methylglyoxal in New Zealand manuka (Leptospermum scoparium) honey. Carbohydr. Res. 2009, 344, 1050–3. 10.1016/j.carres.2009.03.020. [DOI] [PubMed] [Google Scholar]
- Stephens J. M.; Greenwood D. R.; Fearnley L.; Bong J.; Schlothauer R. C.; Loomes K. M. In Processing and Impact on Active Components in Food Section 10: Confectionary and Other Food Items; Academic Press, 2015; pp 675–680. [Google Scholar]
- Moar N. T. Pollen analysis of New Zealand honey. N. Z. J. Agric. Res. 1985, 28, 39–70. 10.1080/00288233.1985.10426997. [DOI] [Google Scholar]
- Stephens J. M.; Schlothauer R. C.; Morris B. D.; Yang D.; Fearnley L.; Greenwood D. R.; Loomes K. M. Phenolic compounds and methylglyoxal in some New Zealand manuka and kanuka honeys. Food Chem. 2010, 120, 78–164. 10.1016/j.foodchem.2009.09.074. [DOI] [Google Scholar]
- Burns D. T.; Dillon A.; Warren J.; Walker M. J. A Critical Review of the Factors Available for the Identification and Determination of Ma̅nuka Honey. Food Anal. Methods 2018, 11, 1561–1567. 10.1007/s12161-018-1154-9. [DOI] [Google Scholar]
- McDonald C. M.; Keeling S. E.; Brewer M. J.; Hathaway S. C. Using chemical and DNA marker analysis to authenticate a high-value food, manuka honey. npj Sci. Food 2018, 2, 9. 10.1038/s41538-018-0016-6. [DOI] [PMC free article] [PubMed] [Google Scholar]
- Ministry for Primary Industries. Manuka Honey Science Definition, 2017, https://www.mpi.govt.nz/growing-and-harvesting/honey-and-bees/manuka-honey/.
- Ministry for Primary Industries. Criteria for Identifying Manuka Honey. A Summary of the Manuka Honey Science Programme (MPI technical paper No: 2017/28), 2017. https://www.mpi.govt.nz/dmsdocument/17314/direct.
- Bong J.; Loomes K. M.; Lin B.; Stephens J. M. New approach: Chemical and fluorescence profiling of NZ honeys. Food Chem. 2018, 267, 355–367. 10.1016/j.foodchem.2017.07.065. [DOI] [PubMed] [Google Scholar]
- Bong J.; Prijic G.; Braggins T. J.; Schlothauer R. C.; Stephens J. M.; Loomes K. M. Leptosperin is a distinct and detectable fluorophore in Leptospermum honeys. Food Chem. 2017, 214, 102–109. 10.1016/j.foodchem.2016.07.018. [DOI] [PubMed] [Google Scholar]
- Bong J.; Loomes K. M.; Schlothauer R. C.; Stephens J. M. Fluorescence markers in some New Zealand honeys. Food Chem. 2016, 192, 1006–1014. 10.1016/j.foodchem.2015.07.118. [DOI] [PubMed] [Google Scholar]
- Daniels B. J.; Prijic G.; Meidinger S.; Loomes K. M.; Stephens J. M.; Schlothauer R. C.; Furkert D. P.; Brimble M. A. Isolation, Structural Elucidation, and Synthesis of Lepteridine From Ma̅nuka (Leptospermum scoparium) Honey. J. Agric. Food Chem. 2016, 64, 5079–5084. 10.1021/acs.jafc.6b01596. [DOI] [PubMed] [Google Scholar]
- Lin B.; Loomes K. M.; Prijic G.; Schlothauer R.; Stephens J. M. Lepteridine as a unique fluorescent marker for the authentication of manuka honey. Food Chem. 2017, 225, 175–180. 10.1016/j.foodchem.2016.12.099. [DOI] [PubMed] [Google Scholar]
- Stephens J. M.; Loomes K. M.; Braggins T. J.; Bong J.; Lin B.; Prijic G.. Fluorescence: A Novel Method for Determining Manuka Honey Floral Purity. In Honey Analysis; Toledo V. A. A., Ed.; Intech, 2017; pp 95–113. [Google Scholar]
- Nguyen D. D.; Solah V. A.; Johnson S. K.; Charrois J. W. A.; Busetti F. Isotope dilution liquid chromatography–tandem mass spectrometry for simultaneous identification and quantification of beta-casomorphin 5 and beta-casomorphin 7 in yoghurt. Food Chem. 2014, 146, 345–352. 10.1016/j.foodchem.2013.09.057. [DOI] [PubMed] [Google Scholar]
- Wang Z.; Lau B. P. Y.; Tague B.; Sparling M.; Forsyth D. Determination of perchlorate in infant formula by isotope dilution ion chromatography/tandem mass spectrometry. Food Addit. Contam., Part A 2011, 28, 799–806. 10.1080/19440049.2010.521959. [DOI] [PMC free article] [PubMed] [Google Scholar]
- Ippoushi K.; Sasanuma M.; Oike H.; Kobori M.; Maeda-Yamamoto M. Absolute quantification of Pru av 2 in sweet cherry fruit by liquid chromatography/tandem mass spectrometry with the use of a stable isotope-labelled peptide. Food Chem. 2016, 204, 129–134. 10.1016/j.foodchem.2016.02.115. [DOI] [PubMed] [Google Scholar]
- Ippoushi K.; Sasanuma M.; Oike H.; Kobori M.; Maeda-Yamamoto M. Absolute quantification of protein NP24 in tomato fruit by liquid chromatography/tandem mass spectrometry using stable isotope-labelled tryptic peptide standard. Food Chem. 2015, 173, 238–242. 10.1016/j.foodchem.2014.10.008. [DOI] [PubMed] [Google Scholar]
- McGrath S. C.; Schieltz D. M.; McWilliams L. G.; Pirkle J. L.; Barr J. R. Detection and Quantification of Ricin in Beverages Using Isotope Dilution Tandem Mass Spectrometry. Anal. Chem. 2011, 83, 2897–2905. 10.1021/ac102571f. [DOI] [PubMed] [Google Scholar]
- Ong S.-E.; Mann M. Mass spectrometry–based proteomics turns quantitative. Nat. Chem. Biol. 2005, 1, 252–262. 10.1038/nchembio736. [DOI] [PubMed] [Google Scholar]
- Gerber S. A.; Rush J.; Stemman O.; Kirschner M. W.; Gygi S. P. Absolute quantification of proteins and phosphoproteins from cell lysates by tandem MS. Proc. Natl. Acad. Sci. U.S.A. 2003, 100, 6940–6945. 10.1073/pnas.0832254100. [DOI] [PMC free article] [PubMed] [Google Scholar]
- Beitlich N.; Lübken T.; Kaiser M.; Ispiryan L.; Speer K. Fluorescent Pteridine Derivatives as New Markers for the Characterization of Genuine Monofloral New Zealand Manuka (Leptospermum scoparium) Honey. J. Agric. Food Chem. 2016, 64, 8886–8891. 10.1021/acs.jafc.6b03984. [DOI] [PubMed] [Google Scholar]
- Magnusson B.; Ornemark U.. The Fitness for Purpose of Analytical Methods—A Laboratory Guide to Method Validation and Related Topics, 2nd ed.; Eurachem Guide, 2014. [Google Scholar]
Associated Data
This section collects any data citations, data availability statements, or supplementary materials included in this article.