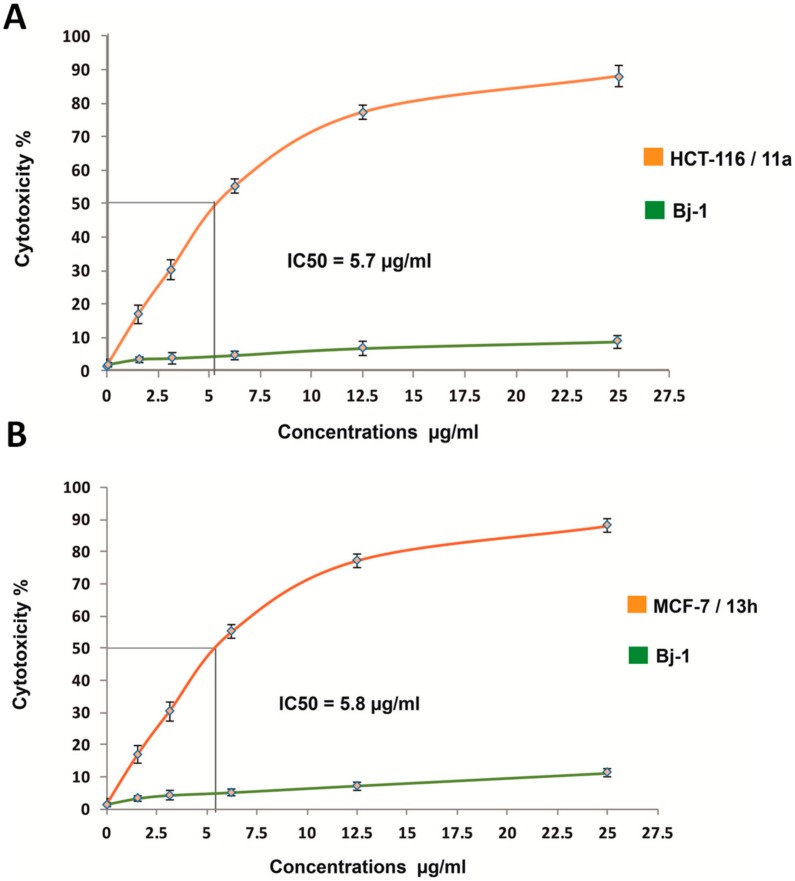
Figure 2.
Cytotoxicity (%) dose-response curves of increasing concentrations for selected synthesized spiro pyrazole-oxindole congeners against cancerous cells. (A) Dose-response curve of 11a congener against HCT-116 as compared to BJ-1. (B) (A) Dose-response curve of 13h congener against MCF-7 as compared to BJ-1. IC50 values in µg/mL were calculated by probit analysis using an Excel-based macro.

