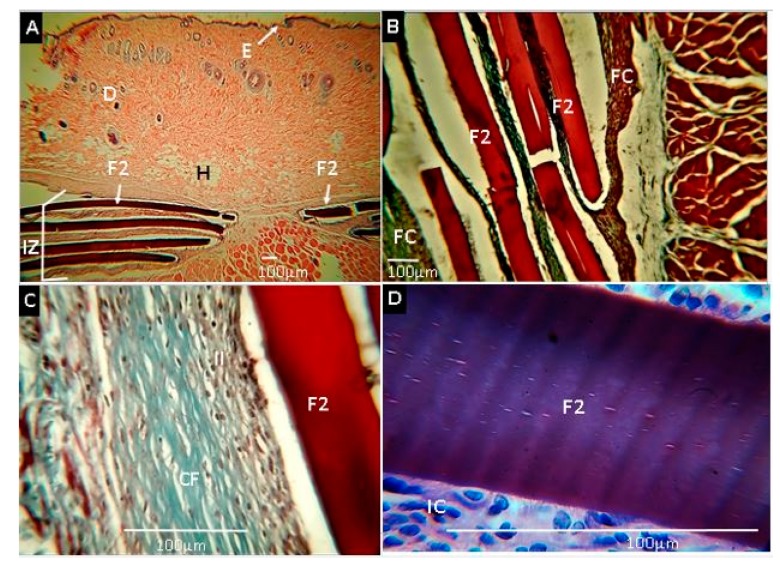
Figure 12.
Histological analysis of experimental sample F2 (CS:PVA:ox-CNO 29.50:70.00:0.50). Magnifications are as follows: (A) 4× H&E, (B) 10× H&E, (C) 40× MT, (D) 100× MT. E: epidermis. D: dermis. H: hypodermis. IZ: implanted zone. II: Inflammatory infiltrate. FC: Fibrous capsule. CF: Collagen fibers type I. IC: Inflammatory cells. F2: Film formulation 2: (CS:PVA:ox-CNO 29.50:70.00:0.50). Hematoxylin and eosin (H&E) and Masson’s trichrome stain (MT) techniques.

