

Graphical abstract

Keywords: Coronavirus Disease 2019, SARS-CoV-2, Rapid Diagnosis of COVID-19, Deep Learning, Bayesian Optimization
Highlights
-
•
To develop an intelligent diagnosis system for COVID-19.
-
•
To design a practical deep learning network for medical image processing.
-
•
To propose a novel and efficient decision making system for COVID-19.
-
•
To integrate conventional and state-of-the-art methods for chest X-ray images.
Abstract
The Coronavirus Disease 2019 (COVID-19) outbreak has a tremendous impact on global health and the daily life of people still living in more than two hundred countries. The crucial action to gain the force in the fight of COVID-19 is to have powerful monitoring of the site forming infected patients. Most of the initial tests rely on detecting the genetic material of the coronavirus, and they have a poor detection rate with the time-consuming operation. In the ongoing process, radiological imaging is also preferred where chest X-rays are highlighted in the diagnosis. Early studies express the patients with an abnormality in chest X-rays pointing to the presence of the COVID-19. On this motivation, there are several studies cover the deep learning-based solutions to detect the COVID-19 using chest X-rays. A part of the existing studies use non-public datasets, others perform on complicated Artificial Intelligent (AI) structures. In our study, we demonstrate an AI-based structure to outperform the existing studies. The SqueezeNet that comes forward with its light network design is tuned for the COVID-19 diagnosis with Bayesian optimization additive. Fine-tuned hyperparameters and augmented dataset make the proposed network perform much better than existing network designs and to obtain a higher COVID-19 diagnosis accuracy.
Introduction
Coronavirus outbreak continues to surprise the world. To date, over one million people across the two hundred countries have been infected according to the last updates of the World Health Organization (WHO). Approximately sixty thousand confirmed deaths among the cases are reported [1]. Humanity had not faced a pandemic through the history that spreads rapidly all over the earth. If a defined brand new virus is able to spread from person to person while infecting the contacts easily with a sustained and efficient way, then it is called a pandemic. The novel coronavirus (2019-nCoV) fulfills all those definitions strongly. At the end of the year 2019, Wuhan city of China cradled the first case of the novel coronavirus. Now from Europe to America, its deadly effects threaten the whole world. The WHO named the 2019-nCoV epidemic disease on February 11, 2020 as Coronavirus Disease 2019 (COVID-19). 2019-nCoV is a new member of the Severe Acute Respiratory Syndrome coronavirus family (SARS-CoV) and labeled as SARS-CoV-2 [2].
With its spike surface for binding to receptors (see Fig. 1 ), SARS-CoV-2 presents the COVID-19 with the symptoms of fever, sore throat and following pneumonia with severe acute respiratory distress. [3]. For all that, the respiratory symptoms are not in a specific form. There are so many isolated cases i.e. the existence of the COVID-19 may not appear at the first clinical symptoms [4]. The rapid spreading nature of the coronavirus and the serious respiratory effects to humans make the diagnosis of the COVID-19 an urgent situation [5]. Today, health specialists use the Reverse Transcription Polymerase Chain Reaction (RT-PCR) test for the detection of the nucleic acid forms stem from the SARS-CoV-2. In the process, the respiratory specimens (such as oropharyngeal swabs or nasopharyngeal sampling) are collected and the very important issue when doing this is the receipt place of the specimens. The operation is categorically open to malfunctions by the expert mistakes [6]. Besides the operation procedure, the PCR test is a time-consuming process. Because a patient has to be isolated in non-suitable circumstances for hours until getting the test results. In addition, these types of tests have a low detection rate of between 30 and 50%. Hence, most of the times they need to be repeated to make a confirmation [7].
Fig. 1.

Three-dimensional medical image representing the shape of the coronavirus [8].
To be able to procure an atmosphere where the patients could get quick treatment and care is a crucial task in the fight of the COVID-19. Because of the fast-spreading essence of the pandemic, patients apply to the health center in batches. At this point, the need for rapid diagnosis methods is a very important issue. For monitoring the SARS-CoV-2 infections to diagnose, there is another option of visualization using the radiological images, for instance, chest X-rays or Computed Tomography (CT). Former studies prove that COVID-19 causes abnormalities that are visible in the chest X-rays and CT images, in the form of ground-glass opacities. With a strong suggestion, a diagnostic with radiological images could be a first step in monitoring the COVID-19 [9]. Although the radiological images based diagnostic is a faster way and also it has some advances over the PCR testing in terms of the detection rate in earlier stages of the COVID-19, the backbone of the system is the need of experts in comprehending the images. Intrinsically, Artificial Intelligence (AI) based diagnostic options can encourage the experts to gain a rapid and accurate explication over the X-ray images on the way of the detection of the COVID-19 [10].
For this motivation, there are several studies in the literature including the analysis conducted on AI-based diagnostic of the COVID-19 with the help of the radiological images [11], [12], [13], [14], [15]. In [15], the authors propose a transfer learning model that processes a dataset including the CT images of the COVID-19 infected patients. They obtain a test accuracy of 79.3%. The study [14] indicates a three-class model that can distinguish the COVID-19, Influenza-A viral-based pneumonia, and healthy cases. The segmentation-based study reaches the 86.7% accuracy value with the CT images dataset. In [13], the authors propose a rapid AI development cycle using a deep learning-based CT image analysis. Heretofore, the mentioned studies in the literature use non-public datasets through developing a deep learning-based diagnostic of the COVID-19. The studies [11] and [12] provides public datasets including the COVID-19 X-ray images of infected patients. In [11], the authors propose a combined public dataset besides a deep learning model called COVID-Net for the detection of COVID-19. COVID-Net architecture relies on a tailored Convolutional Neural Network (CNN) model which uses the chest X-rays as inputs. The authors reach a test accuracy of 92.4% with restricted COVID-19 class images. In our study, we use the same dataset of the [11] to be able to outperform the existing COVID-Net accuracy in detecting the COVID-19. In addition, there are several more studies that we can consider in COVID-19 detection using chest X-rays [16], [17], [18], [19]. With a detailed pre-processed dataset, our study captures the flag with a specially designed deep learning model.
The usage of deep learning models in medical image processing and analysis is a challenging topic in the AI field [10], [20]. In [21], the authors propose a CNN model for pneumonia detection. The authors of the study [22] propose a vessel extraction from the fundus images. In [23], an expert system is proposed for brain tumor detection in high-resolution brain magnetic resonance images. To this end, in our study, we use a specially designed deep learning model called SqueezeNet first proposed in [24]. The proposed deep learning model for the diagnostic of the COVID-19 is based on SqueezeNet architecture, as because it has a smaller structure, compared to the well-known pre-trained network designs [25], [26].
In this study, we introduce a COVID-19 detection AI model, COVIDiagnosis-Net, based on deep SqueezeNet with Bayes optimization. With a view to obtain a higher accuracy rate, the hyper-parameter optimization of the deep learning models is a crucial task [27]. The backbone of the proposed model i.e. the dataset is a public dataset that is detailed in [11]. Differently from the study [11], we perform a multi-scale augmentation process to overcome the imbalance problem of the proposed public dataset. Since the focus is on COVID-19 diagnosis, we perform a detailed offline augmentation process for the limited number of COVID-19 infected chest X-rays of the patients. With the help of the offline well-defined augmentation process and Bayes-SqueezeNet, our proposed diagnostic model for COVID-19 outperforms the COVID-Net [11] while reaching a test accuracy of 0.983. In building our model, we first perform a detailed augmentation. After obtaining the augmented dataset, the data split is generated on the shuffled database to form the train, validation and test datasets. We manage the training process of the deep SqueezeNet while performing a Bayes optimization with the validation phase at the same time. Through the training, the best model is determined and the final network design is tested with the separate test dataset package. On through those developments, the proposed deep Bayes – SqueezeNet obtains a higher detection rate in the diagnosis of the COVID-19 using the chest X-ray images.
Herein, we can describe the contributions of our proposed model as listed below:
-
1)
Presents a novel model for the rapid diagnostic of the COVID-19 based on deep Bayes-SqueezeNet called COVIDiagnosis-Net,
-
2)
Overcomes the imbalance problem of the public dataset, a multi-scale offline augmentation is performed,
-
3)
Proposes an easy to implement deep learning network for embedded and mobile systems that could aid the health experts for a stable diagnosis of the COVID-19 in the control of the current epidemic.
The composition of the rest of the article is as follows: Section 2 describes the materials and methods with details of the proposed deep Bayes-SqueezeNet along with the model components i.e. SqueezeNet architecture, Bayesian optimization, and dataset description. Section 3 presents the explanation of what we design in experiments with evaluation criteria, findings, and a comparison sub-section to draw the big picture of where our study stands among the other state-of-the-art methods. Finally, Section 4 briefs a conclusion of the study.
Materials and methods
CNN models achieve human-like accuracies in image classification problems due to their self-learning abilities and superior classification results on multi-class problems. A convolution network occurs from a chain of a convolution layer (Conv) with a rectified linear unit (ReLu) activation functions, pooling layers (Pool) and batch normalization operation. CNNs are coordinated versions of multilayer perceptrons and each neuron in a layer is related to all neurons in the next layer. Layers convolute inputs with kernels and filters of the convolutions increase across the whole visual field. These processes compose more complex patterns using smaller and simpler patterns depending on the hierarchical patterns. Therefore, the hierarchical network structure provides high-level feature maps, reduced computation complexity and improved generalization ability [22], [28], [29]. Considering these types of characteristics, Bayesian optimization based deep SqueezeNet architecture for diagnostic of COVID-19 disease from X-ray images is proposed in this paper.
The main purpose of our framework is to provide distinctive visual properties as well as a rapid diagnostic system able to classify those properties on new COVID-19 X-ray images. This method may also be helpful for clinicians because it may be quickly decided which treatment plan to use depending on the type of infection. The following sections describe the proposed method, deep SqueezeNet architecture, Bayesian optimization, dataset description and offline augmentation techniques in detail.
Proposed method: Deep Bayes-SqueezeNet based COVIDiagnosis-Net
The overall architecture of the deep Bayes-SqueezeNet based rapid diagnostic system is presented in Fig. 2 . The proposed system is composed of three main stages as offline augmentation of the raw dataset, training of the Bayesian optimization-based SqueezeNet model and decision-making of the network with the testing phase. The proposed method classifies the three-class X-ray images labeled as Normal (no infection), Pneumonia (bacterial or none-COVID viral infection) and Covid (COVID-19 viral infection).
Fig. 2.

Architecture of the deep Bayes-SqueezeNet based rapid diagnostic system.
In the first stage, the offline augmentation method is utilized to the raw input x-ray images due to their uneven sample distributions. This method is preferred for smaller classes with fewer sample numbers in order to increase the size of the classes by a transformation factor. After the augmentation, the augmented dataset is divided into three subsets as train, validation and test sets. Train and validation sets are set as the input of the training and optimization stage. The test set is used for the testing input. In the training and optimization stage, the SqueezeNet convolution network is utilized and it uses the squeeze and expands layers of the fire modules to construct a smaller and more effective CNN architecture. SqueezeNet is a pre-trained CNN model and it is pre-trained on the ILSVRC-12 challenge ImageNet dataset [30], [31]. This supporting dataset is completely different from X-ray images and the SqueezeNet model needs to be fine-tuned to classify the COVIDx classes. In order to obtain the best decision-making model, the CNN network is optimized with the Bayesian-based method, which is a sequential design strategy, during training. A validation error is used to update the optimization process. Finally, the best SqueezeNet model is obtained and used for the decision-making process with the test set. The obtained best network model classifies the infection classes and classification performances are determined.
SqueezeNet architecture
SqueezeNet is a convolution network that executes better performance than AlexNet with 50x fewer parameters [23], [24], [30]. SqueezeNet consists of fifteen layers with five different layers as two convolution layers, three max pooling layers, eight fire layers, one global average pooling layer, and one output layer softmax. The architecture of the network is given in Fig. 3 .
Fig. 3.

Details on the designed SqueezeNet architecture.
As shown in Fig. 3, K × K notation represents the receptive field size of the filters, s denotes the stride size and l is the feature map length, respectively. The input of the network has 227 × 227 dimensions with RGB channels. The input images are generalized by convolution and max pooling is applied. Convolution layer convolutes between the weights and small regions in the input volumes, with 3 × 3 kernels. Each convolution layer performs an element-wise activation function as the positive part of its argument. SqueezeNet utilizes from the fire layers, which constructed of squeeze and expansion phases, between the convolution layers. The output tensor scale and input of the fire are consistent. The squeeze phase uses the filter of size 1 × 1, whereas expansion uses the filters of size 1 × 1 and 3 × 3. Firstly, the input tensor H × W × C passes through the squeeze and the number of convolution is equal to C/4 of the number of input tensor channels. After the first phase, the data passes through the expansions and depth of the data is expanded to C/2 of the output tensor depth. Both squeeze and expansion phases are connected to the ReLu units. The squeeze operation compresses the depth, and expansion increases the depth by keeping the same feature size. Finally, expansion outputs are stacked in the depth dimension of input tensor with concatenate operation. Fig. 4 summarizes the fire layer and sub-operations. Assuming FM and C define the feature maps and channels, the output layer f{y} of the squeeze operation with the kernel w can be expressed as [32]:
| (1) |
Fig. 4.
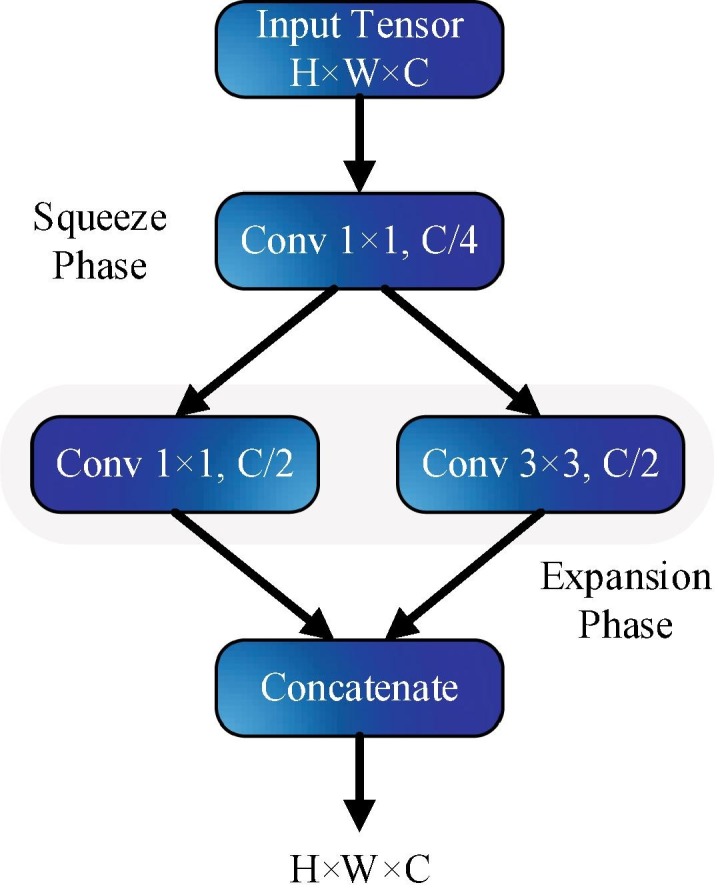
Microstructure of the fire layer.
Here, and . The squeeze outputs can be defined as a weighted combination of the feature maps of the different tensors. In the network, max pool layers execute a down-sampling operation along the spatial dimensions and global average pool convert the feature maps of the classes into one value. At the end of the network, softmax activation function gives the multiclass probability distributions.
Table 1 presents the detailed layer configuration of the SqueezeNet architecture. The motivation for designing the SqueezeNet architecture in COVID-19 diagnosis is that the network provides three main advantages [23], [24]: 1) The network is more efficient because it has fewer parameters, 2) Applications developed for this network are easy to move and require less communication, 3) It has a model size of less than 5 MB and it is easy to implement to embedded systems.
Table 1.
Detailed layer configuration of the designed network.
| Layer | Type | Kernel Size | Stride | Padding | Output Size |
|---|---|---|---|---|---|
| Input | – | – | – | – | 227 × 227 × 3 |
| Conv1 | {Conv + ReLu} | 3 × 3 | 2 | 0 | 113 × 113 × 64 |
| Pool1 | Max Pool | 3 × 3 | 2 | 0 | 56 × 56 × 64 |
| Fire2 | {Squeeze + ReLu-Expand + ReLu-Concat} {Expand + ReLu}//2 |
1 × 1 3 × 3 |
1 1 |
0 1 |
56 × 56 × 16 56 × 56 × 64 56 × 56 × 128 |
| Fire3 | {Squeeze + ReLu-Expand + ReLu-Concat} {Expand + ReLu}//2 |
1 × 1 3 × 3 |
1 1 |
0 1 |
56 × 56 × 16 56 × 56 × 64 56 × 56 × 128 |
| Pool3 | Max Pool | 3 × 3 | 2 | 0 | 28 × 28 × 128 |
| Fire4 | {Squeeze + ReLu-Expand + ReLu-Concat} {Expand + ReLu}//2 |
1 × 1 3 × 3 |
1 1 |
0 1 |
28 × 28 × 32 28 × 28 × 128 28 × 28 × 256 |
| Fire5 | {Squeeze + ReLu-Expand + ReLu-Concat} {Expand + ReLu}//2 |
1 × 1 3 × 3 |
1 1 |
0 1 |
28 × 28 × 32 56 × 56 × 128 56 × 56 × 256 |
| Pool5 | Max Pool | 3 × 3 | 2 | 0 | 14 × 14 × 256 |
| Fire6 | {Squeeze + ReLu-Expand + ReLu-Concat} {Expand + ReLu}//2 |
1 × 1 3 × 3 |
1 1 |
0 1 |
14 × 14 × 48 14 × 14 × 192 14 × 14 × 384 |
| Fire7 | {Squeeze + ReLu-Expand + ReLu-Concat} {Expand + ReLu}//2 |
1 × 1 3 × 3 |
1 1 |
0 1 |
14 × 14 × 48 14 × 14 × 192 14 × 14 × 384 |
| Fire8 | {Squeeze + ReLu-Expand + ReLu-Concat} {Expand + ReLu}//2 |
1 × 1 3 × 3 |
1 1 |
0 1 |
14 × 14 × 64 14 × 14 × 256 14 × 14 × 512 |
| Fire9 | {Squeeze + ReLu-Expand + ReLu-Concat} {Expand + ReLu}//2 |
1 × 1 3 × 3 |
1 1 |
0 1 |
14 × 14 × 64 14 × 14 × 256 14 × 14 × 512 |
| Conv10 | {Conv + ReLu} | 1 × 1 | 1 | 0 | 14 × 14 × 3 |
| Pool10 | Global Average Pool | – | – | – | 1 × 1 × 3 |
| Output | Softmax | – | – | – | 1 × 1 × 3 |
Bayesian optimization
Hyperparameters have a key role in both machine learning and deep learning algorithms inasmuch as those parameters are tightly managing the acts of the training algorithms and they affect the performance of the models significantly. Therefore, the optimization of hyperparameters is a crucial task, especially when it comes to deep learning in medical image processing. In general, there exist two ways of hyperparameters optimization called manual and automatic searching. The manual searching as the name suggests looks for the hyperparameters by hand. Hence, manual searching requires expertise. Unfortunately, when dealing with big data and so many model parameters for tuning, even expertise may be insufficient [27], [33]. To handle the difficulties of manually searching, automatic searching alternatives take place in the literature. Grid search and random search algorithms can be considered in this topic. Nevertheless, there are still problems remaining in both methods such as the curse of dimensionality, and unavailability of the highly efficient performance with the time-consuming operations [27], [34].
Tuning of hyperparameters is such an optimization problem that the objective function of it is latent and unknown, in other words, it is a black-box function. As its name suggests, stemming from the Bayesian theorem, the Bayesian optimization is an efficient algorithm dealing with such kind of optimization problem [27], [35]. Bayesian optimization relies on a typical kind of approximation. Dealing with an unknown function requires an approximation with the help of some known samples i.e. prior knowledge. It is like the concept of the posteriori probability. Here, the food of the algorithm is observations generated by the model evaluations in which the outputs of the online learning. This means that, in Bayesian optimization, we need a training process. During the training, the model will trace a function that we only have its knowledge from the learned data. In the center of the Bayesian optimization algorithm, the main purpose is to obtain the related hyperparameters that make learning outline maximum [36]. In mathematical expression, we can consider a global maximization or minimization problem of the black box (unknown) function,
| (2) |
Here, stands for a searching space of. Caused by the nature of the Bayes’ theorem [35], Bayesian optimization calculates the posteriori probability of a model with the aid of the learned data . Posteriori probability is proportional to the likelihood of observations and the multiplication of the prior probability:
| (3) |
Eq. (3) reflects the main behavior of the Bayesian optimization [27]. In brief, Bayesian optimization searches for the best model amid many of them. At this point, one can recall the cross – validation method. However, it is very hard to find the best model in many samples of pre-listed hundreds of alternatives. Thus, Bayesian optimization accelerates the operation by reducing the computational cost, and we do not need expertise to guess the outputs though [37]. The algorithm combines the prior distribution of thefunction with the samples of the prior knowledge to obtain the posteriors. Those posteriors calculate the value which describes the maximization point of the. Herein, the criterion of the maximization process is the expression called acquisition function. We introduce a pseudo-code format of Bayesian optimization via Algorithm 1 table. In the algorithm, reflects the training dataset, which includes observations of the function.
In the flow, we can clarify the two basic parts of the algorithm: 1) it updates the posterior distribution and 2) it maximizes the acquisition function. Bayesian optimization process continues repeatedly until the defined maximum iteration value is reached. Alternatively, it can also be quitted when it catches a threshold value, which is the difference between the actual value and the obtained optimal value [27], [36].
| Algorithm 1: Bayesian optimization | |
| 1: | for do |
| 2: | Search via optimizing the acquisition function , |
| 3: | Evaluate the objective function: |
| 4: | Augment data |
| Update the model | |
| 5: | end for |
In the proposed deep Bayes-SqueezeNet model, the most important hyperparameter of the deep network design called “initial learning rate” is optimized beside the L2-regularization and the momentum values. We also provide a validation dataset to be able to track the validation error (object function) in the online training. (Please find the experiment details of the Bayesian optimization in Section 3.)
Dataset description
As declared before, the general detection method for COVID-19 disease is the RT-PCR testing that identifies SARS-CoV-2 RNA from sputum or nasopharyngeal swab. However, RT-PCR testing has a long time complex process and it is very troublesome [6]. Another detection method is chest radiography imaging due to the abnormalities in chest X-ray images of patients infected with COVID-19 [2], [11]. Therefore, we have selected a distinctive and public dataset including chest X-ray images to respond to the need for a rapid disease diagnosis system [11]. In order to compose a special COVID-19 dataset, two different publicly available datasets were combined as COVID chest X-ray dataset [12] and Kaggle chest X-ray pneumonia dataset [38]. The obtained COVIDx dataset [11] consists of a total of 5949 posteroanterior chest radiography images for 2839 patient cases. The dataset includes 1583 normal, 4290 pneumonia and 76 COVID-19 infection cases. In the pneumonia samples, diseases were caused by none-COVID-19 viral and bacterial effects. Considering the number of cases, there are a total of 1203 uninfected normal patients, 1591 pneumonia cases with none-COVID-19 and 45 COVID-19 patient cases. The dataset includes three classes and Fig. 5 shows a batch of images that are randomly selected from class samples. The images are transformed to RGB with 8-bit depth and have variable pixel-based resolution values.
Fig. 5.

Randomly selected COVIDx X-ray samples: (a) Normal, (b) Pneumonia, (c) COVID-19.
The main purpose of the selection of COVIDx dataset is that it is public available, so it is accessible for researchers and to be extensible. Therefore, further studies based on this database may be more helpful in the diagnosis and treatment of COVID-19 cases.
Offline augmentation
In the classification process of both classical machine learning and deep learning algorithms, the imbalance ratio of the class distribution of the dataset has a huge impact on the performances of the models. In the study [39], the authors conduct systematic research on how imbalance data affects the classification performance of CNN. The findings of the study point out a detrimental effect of the imbalanced class distribution on classification performance. In our dataset, there are very few COVID-19 class images compared to the other classes. To overcome this unfavorable situation, we perform a detailed offline augmentation over the COVID-19 class images in our dataset. Firstly, we obtain the mirrored version of the original images by flipping each image. Then, the listed augmentation technics are applied to both original and flipped images.
-
1)
Noise: Adding Gaussian noise to images,
-
2)
Shear: Shearing the images in affine form,
-
3)
Brightness decrease: Decreasing the brightness of the images by subtracting 30 from every pixel,
-
4)
Brightness increase: Increasing the brightness of the images by adding 30 to every pixel.
As Fig. 6 describes, we obtain twelve different images from a single image with the aid of the augmentation techniques and their combinations. The same operations depicted in Fig. 6 are also implemented to the flipped images, which are the mirrored versions of the original images. At the end of the day, we gain twenty-four different images for a single image. Thus, the number of images in the COVID-19 class is augmented offline in the pre-processing of the dataset resulting in an acceptable amount. Fig. 7 shows a sample image both in original and flipped (mirrored) version.
Fig. 6.

Offline augmentation: A demonstration on original image.
Fig. 7.

Original image and its flipped version.
Experiments
In this section, the experimental setup and the evaluation of the proposed deep Bayes-SqueezeNet based rapid diagnosis system are presented. The impact of the proposed method on its accuracy and evaluation metrics are discussed with the computational efficiency. All the experiments are performed in MATLAB environment running on a workstation with 2.1 GHz dual Intel Xeon E5, Quadro M4000 8 GB GPU and 32 GB RAM memory. The remainder of the section includes the definitions of the evaluation metrics, findings of the experimental results and comparison of the state-of-the-art methods, respectively.
Evaluation metrics
In order to evaluate the quantitative performance of the proposed method, such evaluation metrics Accuracy (Acc), Correctness (COR), Completeness (COM), Specificity (SPE), F1 score and Matthew Correlation Coefficient (MCC) are statistically computed from the confusion matrix. Acc measures the classification performance, COR gives the rate of the truly classified X-ray images among the classes while COM defines the truly detected negative images. SPE represents the correctly classified the rate of opposite disease classes. F1 is a harmonic average and gives the combination of COR and COM. MCC measures the quality of the classification performance. According to the confusion matrix, the selected evaluation metrics are defined as:
| (4) |
| (5) |
| (6) |
| (7) |
| (8) |
| (9) |
Here, define the number of correctly classified diseases, number of correctly classified opposite classes, number of incorrectly classified diseases and number of the misclassified diseases, respectively. The classification procedure proves and determines the robustness, effectiveness and generalization ability of the proposed method using the aforementioned evaluation metrics.
Experimental results
In the experimental setup, firstly we perform an offline augmentation to the raw COVIDx dataset. After the pre-processing, the augmented dataset is divided into three packages as training, validation and testing sets. The triple split of the dataset packages is formed as 80% for training, 10% for validation and 10% for testing. Training and validation datasets are designed for the Bayesian optimization-based online learning structure. As because of the Bayesian contribution of our model, it needs a validation result to minimize the objective function error. After the Bayesian optimization-based online training process, we reach the best network model to implement the testing phase. With a separate test dataset, the obtained best model is evaluated. All the input images are resized to 227 × 227 pixel size and transformed to RGB with 8-bit depth. In the meantime, all the dataset packages are shuffled to overcome the negative effect of the overfitting. Thus, we reach a robust decision-making performance for the classification of the infected patient cases. In the training process, mini-batch size is given as 32 and all images are normalized with the mean subtracting operation.
Table 2 shows the class distribution of the raw and augmented dataset. In the pre-processing, we achieve 1536 images after the augmentation of COVID-19 class. Since other classes have sufficient images each, we perform the augmentation to just Covid class. We also provide a balanced dataset fixing the all class image numbers to 1536 samples to gain a robust training performance of the model. Briefly, our offline augmentation model enhances the Covid class approximately 20 times. In our proposed model, we improve the existing dataset by increasing the Covid class images.
Table 2.
COVIDx Dataset class distributions.
| Raw Dataset |
Augmented Dataset |
||||||
|---|---|---|---|---|---|---|---|
| No | Class Label | Train | Validation | Test | Train | Validation | Test |
| 1 | Covid | 66 | – | 10 | 1229 | 154 | 153 |
| 2 | Normal | 1349 | – | 234 | 1229 | 154 | 153 |
| 3 | Pneumonia | 3895 | – | 395 | 1229 | 154 | 153 |
| Total | 5310 | – | 639 | 3687 | 462 | 459 | |
Proposed deep Bayes-SqueezeNet includes the Bayesian optimization in the training stage with validation process. The objective function of the optimization process is given in Fig. 8 . It can be seen that function evaluation ends with 35 iterations because of the model saturation. At the end of the 10th iteration, the minimum observed objective is achieved to construct the best model.
Fig. 8.

Bayesian optimization - objective function tracking.
The optimized parameters i.e. initial learning rate (InitialLearnRate), momentum, and L2 Regularization are listed in Table 3 along with iterations, model result, run time and observed - estimation values of the objective function. During the optimization process, it is clearly seen that after catching five different best models, Bayesian optimization points out the model of the 10th iteration as selected “best model”. After the training process, the obtained best model parameters are used in the proposed deep Bayes-SqueezeNet network and highlighted in Table 3.
Table 3.
Bayesian optimization iteration results with model parameters.
| Iter | Result | Objective | Run Time (s) | Observed | Estimation | InitialLearn Rate | Momentum | L2Regularization |
|---|---|---|---|---|---|---|---|---|
| 1 | Best | 0.032468 | 2272.7 | 0.032468 | 0.032468 | 0.0012837 | 0.87056 | 1.81E-06 |
| 2 | Accept | 0.66667 | 2262 | 0.032468 | 0.065569 | 0.025992 | 0.83518 | 0.0037856 |
| 3 | Accept | 0.66667 | 2277.4 | 0.032468 | 0.032531 | 0.017693 | 0.80247 | 8.26E-06 |
| 4 | Best | 0.028139 | 2258.6 | 0.028139 | 0.028157 | 0.0001101 | 0.81225 | 0.00045464 |
| 5 | Best | 0.025974 | 2266.2 | 0.025974 | 0.025902 | 0.00040989 | 0.88376 | 6.65E-06 |
| 6 | Best | 0.02381 | 2274.5 | 0.02381 | 0.023529 | 0.00076553 | 0.83936 | 0.0035748 |
| 7 | Accept | 0.028139 | 2269.2 | 0.02381 | 0.023379 | 0.00019459 | 0.84492 | 0.00036228 |
| 8 | Accept | 0.030303 | 2273.2 | 0.02381 | 0.025605 | 0.0009296 | 0.87648 | 1.70E-06 |
| 9 | Accept | 0.030303 | 2277.9 | 0.02381 | 0.02698 | 0.00056948 | 0.81638 | 1.16E-05 |
| 10 | Best | 0.019481 | 2277.6 | 0.019481 | 0.021372 | 0.00029383 | 0.88203 | 0.00022577 |
| 11 | Accept | 0.036797 | 2275.4 | 0.019481 | 0.025349 | 0.00029004 | 0.82578 | 5.16E-05 |
| 12 | Accept | 0.034632 | 2285.1 | 0.019481 | 0.026358 | 0.00010122 | 0.8988 | 2.59E-05 |
| 13 | Accept | 0.028139 | 2277.4 | 0.019481 | 0.026446 | 0.00015502 | 0.86513 | 0.0081237 |
| 14 | Accept | 0.036797 | 2293.7 | 0.019481 | 0.027786 | 0.00087009 | 0.89525 | 0.0056389 |
| 15 | Accept | 0.032468 | 2252.8 | 0.019481 | 0.028436 | 0.00040269 | 0.87339 | 0.00048719 |
| 16 | Accept | 0.036797 | 2311.4 | 0.019481 | 0.0285 | 0.00015923 | 0.88656 | 2.72E-06 |
| 17 | Accept | 0.02381 | 2312.7 | 0.019481 | 0.02726 | 0.00026917 | 0.89282 | 0.00046382 |
| 18 | Accept | 0.02381 | 2289.3 | 0.019481 | 0.026458 | 0.00026301 | 0.88663 | 0.0014638 |
| 19 | Accept | 0.66667 | 2149.5 | 0.019481 | 0.023422 | 0.099966 | 0.84025 | 1.23E-06 |
| 20 | Accept | 0.028139 | 2329.2 | 0.019481 | 0.026443 | 0.0010675 | 0.80008 | 0.0038983 |
| 21 | Accept | 0.33333 | 2308.4 | 0.019481 | 0.026572 | 0.0042908 | 0.89651 | 1.02E-06 |
| 22 | Accept | 0.59307 | 2331.9 | 0.019481 | 0.02079 | 0.0022645 | 0.86662 | 0.0087526 |
| 23 | Accept | 0.02381 | 2291.2 | 0.019481 | 0.020999 | 0.00065536 | 0.899 | 1.17E-06 |
| 24 | Accept | 0.02381 | 2351.4 | 0.019481 | 0.024937 | 0.0001248 | 0.89723 | 0.0021482 |
| 25 | Accept | 0.028139 | 2205.2 | 0.019481 | 0.023971 | 0.00022965 | 0.84862 | 0.00011305 |
| 26 | Accept | 0.030303 | 2337.2 | 0.019481 | 0.025463 | 0.0011636 | 0.89847 | 1.69E-06 |
| 27 | Accept | 0.66667 | 2362.9 | 0.019481 | 0.021554 | 0.0071359 | 0.82765 | 0.00016296 |
| 28 | Accept | 0.025974 | 2356.6 | 0.019481 | 0.021647 | 0.00094407 | 0.8011 | 0.00010491 |
| 29 | Accept | 0.032468 | 2339.6 | 0.019481 | 0.021141 | 0.00010048 | 0.89832 | 0.0069219 |
| 30 | Accept | 0.034632 | 2377.5 | 0.019481 | 0.022613 | 0.00033962 | 0.8959 | 2.41E-06 |
| 31 | Accept | 0.02381 | 2397.9 | 0.019481 | 0.021599 | 0.00048047 | 0.8965 | 8.22E-06 |
| 32 | Accept | 0.021645 | 2383.8 | 0.019481 | 0.021614 | 0.0011022 | 0.80386 | 1.12E-06 |
| 33 | Accept | 0.025974 | 2395.4 | 0.019481 | 0.022638 | 0.00082936 | 0.80318 | 0.0084898 |
| 34 | Accept | 0.032468 | 2388.1 | 0.019481 | 0.021811 | 0.00070627 | 0.80414 | 2.20E-06 |
| 35 | Accept | 0.034632 | 2299.5 | 0.019481 | 0.022807 | 0.00049401 | 0.8699 | 1.03E-06 |
In order to evaluate the effectiveness of our augmentation improvement, we first present the raw dataset results. Here, our aim is to prove the negative effect of the imbalance distributions in the raw dataset over the performance. It should be noted that we tune the SqueezeNet with the best model parameters for a regular training process. The re-training and testing processes are performed with the train and test packages of the related dataset, please see Table 2. Fig. 9 demonstrates the confusion matrix of the test process of the re-trained SqueezeNet. In the confusion matrix presentation, accuracies and errors of each row and columns are given as the percentage value in the lower and right cells, respectively. The accuracy rates of each column show us the correctness value of each class and the accuracy values for each row state the single accuracy values of the classes.
Fig. 9.

Confusion matrix of the re-trained SqueezeNet with raw dataset.
As shown in Fig. 9, the false classification rate appears majorly within Normal and Pneumonia. Pneumonia class achieves nearly the perfect classification whereas Covid class has 70% accuracy within 10 test samples. In the Normal class distribution, 141 samples are misclassified as Pneumonia. This situation shows the negative effect of the imbalanced distribution of the dominant Pneumonia class.
In Table 4 , we can see the detailed classification results of the SqueezeNet for the raw dataset. The obtained results show that Normal class has the lower values of Acc, COM, and F1 as 38.89%, 38.89%, and 55.83%, respectively. The model with the raw dataset just reaches the 76.37% overall accuracy and 70.00% single accuracy value of the Covid class. While the highest accuracy is presented by Pneumonia class, the lower values of MCC and SPE in Pneumonia point out poor classification performance.
Table 4.
Classification results of the re-trained SqueezeNet with raw dataset (%).
| Class | Acc | COR | COM | SPE | F1 | MCC |
|---|---|---|---|---|---|---|
| Covid | 70.00 | 53.85 | 70.00 | 99.04 | 60.87 | 60.70 |
| Normal | 38.89 | 98.91 | 38.89 | 99.75 | 55.83 | 53.03 |
| Pneumonia | 98.73 | 73.03 | 98.73 | 40.98 | 83.96 | 52.07 |
| Overall | 76.37 | 75.26 | 69.21 | 79.93 | 66.89 | 55.27 |
The second phase of our experiments is performing the augmented dataset testing process. In this phase, the proposed deep Bayes-SqueezeNet model, which is obtained by the Bayesian optimization approach, is validated with the separate test dataset. It should be noted that the obtained best model is trained with the augmented dataset to overcome the above-mentioned imbalance effects as well as achieving a rapid system for COVID-19 diagnosis with a robust and sustainable structure. Fig. 10 presents the confusion matrix of the test phase. Here, we can see a tremendous performance boosting on all classes and overall accuracy. The deep Bayes-SqueezeNet model catches all the Covid samples in the X-rays, perfectly. There are just eight misclassified samples among 459 test samples. The error rate of the Normal class is 2% while it is 3.3% in Pneumonia. In addition, the most misclassification rate is presented by Pneumonia.
Fig. 10.

Confusion matrix of the proposed deep Bayes-SqueezeNet in testing phase.
We can interpret the detailed test results from Table 5 . In the decision-making system, Covid class reaches the perfect classification rate as showing the 100% test accuracy and completeness values. F1 and MCC values also prove that it is obtained a stable classification. The overall accuracy is 98.26% with a COM of 98.26%, it draws a picture that our model is well-trained and robust. Although Pneumonia accuracy decreases to 96.73% compared to former experiments, all other performance criteria of the related class are boosted and exhibit an effective prediction. The classification performance of the Normal class is visibly enhanced and it reaches to 98.04% Acc value.
Table 5.
Classification results of the proposed deep Bayes-SqueezeNet (%).
| Class | Acc | COR | COM | SPE | F1 | MCC |
|---|---|---|---|---|---|---|
| Covid | 100.00 | 99.35 | 100.00 | 99.67 | 99.67 | 99.51 |
| Normal | 98.04 | 97.40 | 98.04 | 98.69 | 97.72 | 96.58 |
| Pneumonia | 96.73 | 98.01 | 96.73 | 99.02 | 97.37 | 96.07 |
| Overall | 98.26 | 98.26 | 98.26 | 99.13 | 98.25 | 97.39 |
In order to analyze the performance comparison between the experiments of the raw dataset and the augmented one, we report the increase rates of the performance values as in Fig. 11 . The sharp bounce is experienced in the Normal class by a boosting of 2.5 times. As it is the focus of our model, when we concentrate on the performance of the Covid then we detect 2.5 times boosting. In Pneumonia class, there is a decreasing percentage of 2.06% considering just the accuracy value. The overall accuracy rate has also a performance increasing at the rate of 28.66%. The overall accuracy rate has also a performance increase at a rate of 28.66%.
Fig. 11.

Performance comparison of the raw and augmented dataset.
For a detailed visual analysis, we provide a class activation mapping images as shown in Fig. 12 . Class activation mapping is a way of generating visual explanations of the predictions of deep learning models. Misclassified or unreasonable predictions sometimes can rely on reasonable explanations. By the aid of the class activation mapping, we can investigate useful knowledge of the prediction regions. Activation mapping also defines the bias regions in the training images. The first column of Fig. 12 defines the original input images while the second column includes the heat map images of the predicted samples. When all the class activation mappings are examined in Fig. 12 (a) – (c), the probability values of the predictions are nearly 1.00. According to the heat maps of the images, the trained network distinguishes the classes with an acceptable feature mapping. To form an outlier example, Fig. 12 (d) presents a misclassified class sample i.e. Normal class is confused with Pneumonia. The probability values are 0.25 and 0.74, for Normal and Pneumonia respectively.
Fig. 12.

Class activation mapping visualization of the proposed deep Bayes-SqueezeNet on sample images: a) Covid b) Normal c) Pneumonia d) Misclassified prediction.
The proposed deep Bayes-SqueezeNet with its low model size is easy to implement in hardware deployments. As shown in Table 6 , the model size of the proposed network is less than 77.31 times lower compared to the AlexNet, which is the inspiration of the SqueezeNet architecture.
Table 6.
Model sizes in mega bytes.
| Deep Bayes-SqueezeNet | AlexNet | |
|---|---|---|
| Storage size of the models (MB) | 2.6 | 201 |
The overall experimental results show that proposed model has a significant and robust performance value. Over the COVID-19 patient cases, this study proposes a complete and compact solution using the chest X-ray images for rapid diagnosis.
Comparison between the State-of-the-Art methods
The coronavirus disease 2019 was announced as an outbreak by WHO on February 11, 2020 [1]. Due to the COVID-19 outbreak, the early diagnosis of this disease has become a key topic for clinicians and radiologists in the world. The AI techniques regarding the image classification approaches can help in early diagnose of the disease. Considering AI, CNN methods achieve better and faster results compared to the traditional diagnosis methods. In this paper, a rapid robust and efficient COVID-19 diagnosis method, which is namely deep Bayes-SqueezeNet, is proposed. The proposed method performs the X-ray images into multiclass as Normal, Pneumonia, and Covid. In order to evaluate the proposed CNN model, the general performance comparison of our study with the state-of-art methods is given in this section. In the model evaluations, the related studies depend on the multiclass classification of the chest X-ray images with various AI techniques. Table 7 shows the comparison results with the related studies uses the same or similar datasets.
Table 7.
The general comparison of the proposed method between the state-of-the-art methods.
| Study | Year | Methods | Class | Acc | COR | COM | SPE | F1 | MCC |
|---|---|---|---|---|---|---|---|---|---|
| Li and Zhu [16] | 2020 | DenseNet | 3 | 0.889 | – | – | – | – | – |
| Wang and Wong [11] | 2020 | Tailored CNN | 3 | 0.923 | 0.913 | 0.887 | – | 0.900 | – |
| Afshar et al. [17] | 2020 | Capsule Networks | 4 | 0.957 | – | 0.900 | 0.958 | – | – |
| Farooq and Hafeez [18] | 2020 | ResNet50 | 4 | 0.962 | 0.969 | 0.969 | – | 0.969 | – |
| Chowdhury et al. [19] | 2020 | Sgdm-SqueezeNet | 3 | 0.983 | 1.000 | 0.967 | 0.990 | 0.983 | – |
| Proposed Method | 2020 | Bayes-SqueezeNet | 3 | 0.983 | 0.983 | 0.983 | 0.991 | 0.983 | 0.974 |
Li and Zhu [16] propose a DenseNet based COVID-Xpert architecture classifying the three-class chest X-ray images. They use transfer learning and obtain an overall accuracy of 0.889. Wang and Wong [11] present COVID-Net design to the diagnosis of the COVID-19 and in their study the main model is based on the tailored CNN. Machine-driven design is used to improve the model architecture. The overall accuracy, COM, and COR metrics of [11] can be listed as 0.923, 0.887, and 0.913, respectively. The authors also share and collect the COVIDx dataset used in our study. Afshar et al. [17] introduce a deep learning model based on a capsule network using a four-class dataset. Their model produces a 0.957 overall accuracy. Farooq and Hafeez [18] present a ResNet based framework in a four-class dataset with augmentation. The model accuracy has remained as 0.962. Chowdhury et al. [19] explain a bundle structure that includes various deep learning models using four different chest X-ray datasets. Amid the performance metrics that Table 7 gives, our model outperforms similar studies that use chest X-rays in the diagnosis of the COVID-19. Although it seems that some of the performance values have been achieved the same with the study [19], the whole performance of the proposed method in our study is better than it.
In Table 8 , the performance values of the listed studies are given in terms of COVID-19 class accuracy. While Chowdhury et al. [19] have the same overall accuracy with our study, the COVID-19 class accuracy stays behind the proposed method. Farooq and Hafeez [18] obtain the same accuracy of COVID-19 class, but our study outperforms it in the overall accuracy. In addition, the test dataset of the study includes just eight samples of COVID-19.
Table 8.
COVID-19 class comparison of the proposed method between the state-of-the-art methods.
To the best of our knowledge, the proposed model reveals the excellent classification performance for the COVID-19 diagnosis with chest X-rays. The proposed model has a great advantage of owning a practical network architecture with a robust and stable operation. With its nature of including fewer parameters, our network is more favorable for embedded systems among existing deep learning models.
Conclusions
A rapid diagnosis method has a key role in the control of infectious diseases and pandemic situations like the up to date COVID-19. Some limitations of the RT-PCR nucleic acid-based test modules reveal a need for fast alternative methods to be able to serve the front-line experts to make them reach a quick and accurate diagnosis. In this study, we propose an AI-based decision-making system including the recognition of input X-ray images under the roof of a very practical deep learning model. This study is an important attempt including an easy to implement deep learning model which has an accuracy performance of 98.3% (among Normal, Pneumonia and Covid cases), and 100% for the single recognition of COVID-19 (among other classes). In these difficult days of the global COVID-19 pandemic, our model has a strong potential to build a tool design for COVID-19 monitoring. We would like to note that that the RT-PCR test method to detect the SARS-CoV-2 is still important. However, it is proved that there are also undeniable shortcomings along with the RT-PCR test method, which can be listed as follows: 1) its possible methodology lacks, 2) strict dependence on the level of the disease (timing), 3) the possibility for collecting the specimens in mistaken localizations and 4) its response time delay [6], [7]. In our model working with a deep learning-based practical structure, the early stage detections of the COVID-19 cases could be done to manage and control the pandemic disease. In medical image processing, while deep learning methods are preferred in many areas, it is becoming more and more important especially in the interpretation of radiological images. As such, our model, which is extremely satisfactory even with its initial results, opens the door for the implementation of a comprehensive product that can work mobile and appeal to the end-user.
Backbone of our model is the deep Bayes-SqueezeNet decision-making system for the COVID-19 diagnosis from X-ray images. SqueezeNet with much less model size is a state-of-the-art deep learning model, which is inspired by the well-known AlexNet. With its practical structure and generalization performance, the SqueezeNet is preferable in the embedded applications. We improve the SqueezeNet structure with Bayes optimization algorithm to build a robust and sustainable learning model. Bayesian optimization helps us to build a best-performed model with a validation dataset. The diagnosis system is trained using the public dataset proposed in [11] with its augmented form. A separate test, which is independent of train and validation sets, performs the experiments. Our experimental results also present the performance boosting of the augmentation contribution to the dataset pre-processing. Thus, model training can be performed with a rich image set of X-rays of COVID-19. After comprehensive literature research, the up to date studies, which use the same or similar public datasets are detected and we evaluate our model with those. The proposed diagnosis model for COVID-19 using the X-ray images, the deep Bayes-SqueezeNet outperforms its competitors. We believe that with increased training dataset, it is expected to get higher results.
In further works, we aim to plan our model to be able to work mobile appealing to the health care experts for diagnosis of the COVID-19. In addition, the possibility of presenting this diagnostic system as a solution for other medical image processing cases will also be explored.
Declaration of Competing Interest
The authors declare that they have no known competing financial interests or personal relationships that could have appeared to influence the work reported in this paper.
Footnotes
Supplementary data to this article can be found online at https://doi.org/10.1016/j.mehy.2020.109761.
Appendix A. Supplementary data
The following are the Supplementary data to this article:
References
- 1.WHO - Coronavirus disease 2019 info web site n.d. https://www.who.int/emergencies/diseases/novel-coronavirus-2019 (accessed April 6, 2020).
- 2.Lai C.C., Shih T.P., Ko W.C., Tang H.J., Hsueh P.R. Severe acute respiratory syndrome coronavirus 2 (SARS-CoV-2) and coronavirus disease-2019 (COVID-19): The epidemic and the challenges. Int J Antimicrob Agents. 2020;55 doi: 10.1016/j.ijantimicag.2020.105924. [DOI] [PMC free article] [PubMed] [Google Scholar]
- 3.Salman S, Salem ML. Routine childhood immunization may protect against COVID-19. vol. 140. Churchill Livingstone; 2020. doi:10.1016/j.mehy.2020.109689. [DOI] [PMC free article] [PubMed]
- 4.Wang D., Hu B., Hu C., Zhu F., Liu X., Zhang J. Clinical Characteristics of 138 Hospitalized Patients with 2019 Novel Coronavirus-Infected Pneumonia in Wuhan, China. JAMA - J Am Med Assoc. 2020;323:1061–1069. doi: 10.1001/jama.2020.1585. [DOI] [PMC free article] [PubMed] [Google Scholar]
- 5.Xie M, Chen Q. Insight into 2019 novel coronavirus — an updated intrim review and lessons from SARS-CoV and MERS-CoV. Int J Infect Dis 2020. doi:10.1016/j.ijid.2020.03.071. [DOI] [PMC free article] [PubMed]
- 6.Liu R., Han H., Liu F., Lv Z., Wu K., Liu Y. Positive rate of RT-PCR detection of SARS-CoV-2 infection in 4880 cases from one hospital in Wuhan, China, from Jan to Feb 2020. Clin Chim Acta. 2020;505:172–175. doi: 10.1016/j.cca.2020.03.009. [DOI] [PMC free article] [PubMed] [Google Scholar]
- 7.Chu D.K.W., Pan Y., Cheng S.M.S., Hui K.P.Y., Krishnan P., Liu Y. Molecular Diagnosis of a Novel Coronavirus (2019-nCoV) Causing an Outbreak of Pneumonia. Clin Chem. 2020;66:549–555. doi: 10.1093/clinchem/hvaa029. [DOI] [PMC free article] [PubMed] [Google Scholar]
- 8.3D medical animation corona virus.jpg - Wikimedia Commons. Wikimedia Commons n.d. https://commons.wikimedia.org/wiki/File:3D_medical_animation_corona_virus.jpg (accessed April 6, 2020).
- 9.Li Y, Xia L. Coronavirus Disease 2019 (COVID-19): Role of Chest CT in Diagnosis and Management. Am J Roentgenol 2020:1–7. doi:10.2214/ajr.20.22954. [DOI] [PubMed]
- 10.Kermany D.S., Goldbaum M., Cai W., Valentim C.C.S., Liang H., Baxter S.L. Identifying Medical Diagnoses and Treatable Diseases by Image-Based Deep Learning. Cell. 2018;172(1122–1131) doi: 10.1016/j.cell.2018.02.010. [DOI] [PubMed] [Google Scholar]
- 11.Wang L, Wong A. COVID-Net: A Tailored Deep Convolutional Neural Network Design for Detection of COVID-19 Cases from Chest Radiography Images. ArXiv 2200309871 2020. [DOI] [PMC free article] [PubMed]
- 12.Cohen JP, Morrison P, Dao L. COVID-19 Image Data Collection. ArXiv 200311597 2020.
- 13.Gozes O, Ayan Frid-Adar M’, Greenspan H, Browning PD, Zhang H, Ji W, et al. Rapid AI Development Cycle for the Coronavirus (COVID-19) Pandemic: Initial Results for Automated Detection & Patient Monitoring using Deep Learning CT Image Analysis Authors. ArXiv 200305037 2020.
- 14.Xiaowei Xu;, Xiangao Jiang;, Chunlian Ma;, Peng Du;, Xukun Li;, Shuangzhi Lv;, et al. Deep Learning System to Screen Coronavirus Disease 2019 Pneumonia. ArXiv 200209334 2020:1–29. [DOI] [PMC free article] [PubMed]
- 15.Wang S, Kang B, Ma J, Zeng X, Xiao M, Guo J, et al. A deep learning algorithm using CT images to screen for corona virus disease (COVID-19). MedRxiv 2020:2020.02.14.20023028. doi:10.1101/2020.02.14.20023028. [DOI] [PMC free article] [PubMed]
- 16.Li X, Zhu D. COVID-Xpert: An AI Powered Population Screening of COVID-19 Cases Using Chest Radiography Images. ArXiv:200403042 2020:1–6..
- 17.Afshar P, Heidarian S, Naderkhani F, Oikonomou A, Plataniotis KN, Mohammadi A, et al. Covid-Caps: A Capsule Network-Based Framework for Identification of Covid-19 Cases From X-Ray Images. ArXiv Prepr ArXiv200402696 2020:1–4. [DOI] [PMC free article] [PubMed]
- 18.Farooq M., Hafeez A. COVID-ResNet: A Deep Learning Framework for Screening of COVID19 from. Radiographs. 2020 [Google Scholar]
- 19.Chowdhury MEH, Rahman T, Khandakar A, Mazhar R, Kadir MA, Mahbub Z Bin, et al. Can AI help in screening Viral and COVID-19 pneumonia? ArXiv 200313145 2020.
- 20.Lakhani P., Sundaram B. Deep learning at chest radiography: Automated classification of pulmonary tuberculosis by using convolutional neural networks. Radiology. 2017;284:574–582. doi: 10.1148/radiol.2017162326. [DOI] [PubMed] [Google Scholar]
- 21.Varshni D, Thakral K, Agarwal L, Nijhawan R, Mittal A. Pneumonia Detection Using CNN based Feature Extraction. Proc. 2019 3rd IEEE Int. Conf. Electr. Comput. Commun. Technol. ICECCT 2019, Institute of Electrical and Electronics Engineers Inc.; 2019. doi:10.1109/ICECCT.2019.8869364.
- 22.Budak Ü., Cömert Z., Çıbuk M., Şengür A. DCCMED-Net: Densely connected and concatenated multi Encoder-Decoder CNNs for retinal vessel extraction from fundus images. Med Hypotheses. 2020;134 doi: 10.1016/j.mehy.2019.109426. [DOI] [PubMed] [Google Scholar]
- 23.Özyurt F., Sert E., Avcı D. An expert system for brain tumor detection: Fuzzy C-means with super resolution and convolutional neural network with extreme learning machine. Med Hypotheses. 2020;134 doi: 10.1016/j.mehy.2019.109433. [DOI] [PubMed] [Google Scholar]
- 24.Iandola F.N., Han S., Moskewicz M.W., Ashraf K., Dally W.J., Keutzer K. SqueezeNet: AlexNet-level accuracy with 50x fewer parameters and <0.5MB model size. Arxiv. 2016;160207360:1–13. [Google Scholar]
- 25.Fan G., Chen F., Chen D., Dong Y. Recognizing Multiple Types of Rocks Quickly and Accurately Based on Lightweight CNNs Model. IEEE Access. 2020;8:55269–55278. doi: 10.1109/ACCESS.2020.2982017. [DOI] [Google Scholar]
- 26.Chappa RTNV., El-Sharkawy M. Squeeze-and-Excitation SqueezeNext: An Efficient DNN for Hardware Deployment. 2020 10th Annu. Comput. Commun. Work. Conf., IEEE; 2020, p. 0691–7. doi:10.1109/ccwc47524.2020.9031119.
- 27.Wu J., Chen X.Y., Zhang H., Xiong L.D., Lei H., Deng S.H. Hyperparameter optimization for machine learning models based on Bayesian optimization. J Electron Sci Technol. 2019;17:26–40. doi: 10.11989/JEST.1674-862X.80904120. [DOI] [Google Scholar]
- 28.Gu J., Wang Z., Kuen J., Ma L., Shahroudy A., Shuai B. Recent advances in convolutional neural networks. Pattern Recognit. 2018;77:354–377. doi: 10.1016/j.patcog.2017.10.013. [DOI] [Google Scholar]
- 29.Raghu S., Sriraam N., Temel Y., Rao S.V., Kubben P.L. EEG based multi-class seizure type classification using convolutional neural network and transfer learning. Neural Networks. 2020;124:202–212. doi: 10.1016/j.neunet.2020.01.017. [DOI] [PubMed] [Google Scholar]
- 30.Jadhav P., Rajguru G., Datta D., Mukhopadhyay S. Automatic sleep stage classification using time–frequency images of CWT and transfer learning using convolution neural network. Biocybern Biomed Eng. 2020;40:494–504. doi: 10.1016/j.bbe.2020.01.010. [DOI] [Google Scholar]
- 31.Sun W., Zhang Z., Huang J. RobNet: real-time road-object 3D point cloud segmentation based on SqueezeNet and cyclic CRF. Soft Comput. 2019;24:5805–5818. doi: 10.1007/s00500-019-04355-y. [DOI] [Google Scholar]
- 32.Su L., Ma L., Qin N., Huang D., Kemp A.H. Fault Diagnosis of High-Speed Train Bogie by Residual-Squeeze Net. IEEE Trans Ind Informatics. 2019;15:3856–3863. doi: 10.1109/TII.2019.2907373. [DOI] [Google Scholar]
- 33.Sameen M.I., Pradhan B., Lee S. Application of convolutional neural networks featuring Bayesian optimization for landslide susceptibility assessment. Catena. 2020;186 doi: 10.1016/j.catena.2019.104249. [DOI] [Google Scholar]
- 34.Snoek J, Rippel O, Swersky K, Kiros R, Satish N, Sundaram N, et al. Scalable Bayesian Optimization Using Deep Neural Networks. 32nd Int. Conf. Mach. Learn. ICML 2015, vol. 3, International Machine Learning Society (IMLS); 2015, p. 2161–70.
- 35.Mockus J. On the Bayes Methods for Seeking the Extremal Point. IFAC Proc. 1975;8:428–431. doi: 10.1016/s1474-6670(17)67769-3. [DOI] [Google Scholar]
- 36.Shahriari B., Swersky K., Wang Z., Adams R.P., De Freitas N. Taking the human out of the loop: A review of Bayesian optimization. Proc IEEE. 2016;104:148–175. doi: 10.1109/JPROC.2015.2494218. [DOI] [Google Scholar]
- 37.Shallow Understanding on Bayesian Optimization - Towards Data Science 2020. https://towardsdatascience.com/shallow-understanding-on-bayesian-optimization-324b6c1f7083 (accessed April 9, 2020).
- 38.Kermany, Daniel; Zhang, Kang; Goldbaum M. Labeled Optical Coherence Tomography (OCT) and Chest X-Ray Images for Classification. Mendeley Data, V2 2018. http://dx.doi.org/10.17632/rscbjbr9sj.2.
- 39.Buda M., Maki A., Mazurowski M.A. A systematic study of the class imbalance problem in convolutional neural networks. Neural Networks. 2018;106:249–259. doi: 10.1016/j.neunet.2018.07.011. [DOI] [PubMed] [Google Scholar]
Associated Data
This section collects any data citations, data availability statements, or supplementary materials included in this article.