Abstract
Single-molecule detection enables direct characterization of annealing/melting kinetics of nucleic acids without the need for synchronization of molecular states, but the current experiments are not carried out in a native cellular context. Here we describe an integrated 3D single-molecule tracking and lifetime measurement method that can follow individual DNA molecules diffusing inside a mammalian cell and observe multiple annealing and melting events on the same molecules. By comparing the hybridization kinetics of the same DNA strand in vitro, we found the association constants can be 13- to 163-fold higher in the molecular crowding cellular environment.
Short nucleic acid (NA) oligomers are involved in many key cellular processes1 and can be used as treatment for diseases.2 While hybridization with their specific targets is the most critical function of these short NAs inside cells, directly observing the annealing/melting kinetics of individual NA molecules in a cellular environment is challenging. Forster resonance energy transfer (FRET)-based ensemble methods can probe hybridization kinetics of small oligomers in live cells,3 but the required external perturbation to synchronize molecular states (e.g., temperature jump) puts the cells under an unhealthy, non-native physiological condition. Although single-molecule detection methods bypass the need of external perturbation, the current kinetics measurements are carried out on a surface4–8 or inside a trap.9–11 As the conditions for these single-molecule experiments are not physiologically relevant, there has been speculation that the hybridization kinetics are different inside cells.3,12,13
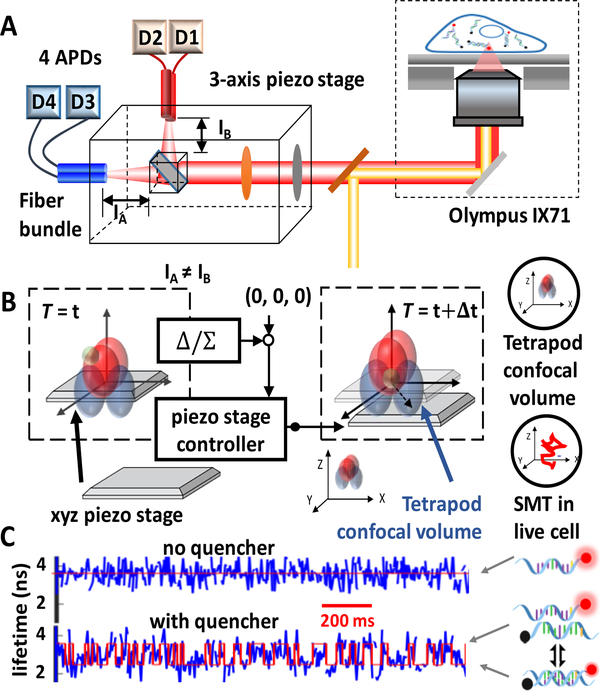
Here we show a time-resolved 3D single-molecule tracking (3D-SMT) method that allows us to follow a single DNA molecule diffusing in solution or in a cell for hundreds of milliseconds to a few seconds and observe changes of the binding states multiple times on the same molecule. The 3D position of the DNA molecule is estimated by spatial filtering using multiple pinholes/detectors14–16 (Figures 1A and S1). Through active 3D tracking, our single-molecule observation window is 100 to 1000 times longer than the typical 1 ms single-molecule observation time in fluorescence correlation spectroscopy (FCS). While following a DNA molecule diffusing in the 3D space, we simultaneously monitor the lifetime of the fluorescent tag on the oligomer (Figures 1B and S2). When this fluorophore-labeled strand (termed the reporter strand) hybridizes with a quencher-tagged complementary strand (termed the quencher strand), the fluorescent tag is partially quenched, leading to a shorter lifetime. In our model system (Figure S3), the duplex is unstable, with an average dwell time for the annealing state (τon) of 101 ms. As a result, “digital” switching between the melting/unquenched state (long lifetime) and the annealing/quenched state (short lifetime) can be observed in the fluorescence lifetime trace (Figure 1C). Without the quencher strand, the lifetime shows no sign of digital switching. The state evolution can be uncovered using a hidden Markov model.17 The hybridization/melting kinetics of DNA can then be derived from the transition probability matrix18,19 (Figure 2).
Figure 1.
(A) Optical design and (B) schematic of the confocal-feedback 3D-SMT system. By comparing the differences in photon counts measured by 4 detection channels, the 3D position of the tracked molecule is estimated. A feedback algorithm then drives the piezo stage to bring the molecule back to the center of confocal volumes. Thus, the motion history of the xyz piezo stage represents the 3D trajectory of the tracked molecule. (C) Composite lifetime traces are different with and without the quencher strand.
Figure 2.
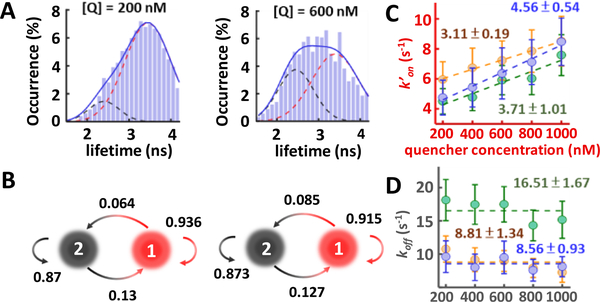
Using a time-correlated single-photon counting (TCSPC) module, we can time tag the arrival photons and group them into consecutive time windows for lifetime analysis. Here “1” represents the annealing/bound state while “2” represents the melting/unbound state. A hidden Markov model is then used to identify the state transitions in the lifetime trace.
While our measurements well represented the real kinetics in solution (preserving molecule’s conformational, rotational and binding degrees of freedom9 and eliminating any interferences from the surface or the trap16), the 3D-SMT method has not been applied to measure the hybridization kinetics of small oligomers directly inside mammalian cells. Using 3D-SMT, here we evaluated and compared the in vitro and in vivo kinetics of 3 reporter strands with different GC content and DNA modification: (1) 87.5% GC strand (TGGGCGGG), (2) 37.5% GC strand (TGATTGTG), and (3) 87.5% phosphorothioate (PS)-modified GC strand (T*GG*GC*GG*G). For in vitro measurements, with the corresponding quencher strand in solution, two states could be clearly seen in both lifetime traces (3.6 ns vs 2.4 ns Figures S4–S6) and lifetime histograms (Figure S7). When the concentration of the quencher strand increased by 3-fold, the histogram of the reporter strand (87.5% GC) showed a 2-fold increase in the bound-state population (Figure 3A). Transition probability (P12) from the unbound state (state 1) to the bound state (state 2) also increased by 1.3-fold (Figure 3B). The apparent annealing rate k′on exhibited a linear dependence on the quencher strand concentration, while the melting rate koff was concentration independent (Figure 3C, 3D, and Table S1). Our in vitro measurements showed that the 87.5% GC strand had the highest annealing rate (kon = 4.56 (±0.54)·106 M−1 s−1), the lowest melting rate (koff = 8.56 ± 0.93 s−1), and the largest association constant (Ka = 0.53 ± 0.08 μM−1) among the three reporter strands tested (Table S3).
Figure 3.
(A) Lifetime histograms of the 87.5% GC strand showing two lifetime states. At higher quencher concentration, the bound-state population increased. This in vitro experiment was carried out in the 70 wt % glycerol/20 mM Tris–HCl pH 8.0 solution. (B) Transition probabilities between the melting and the annealing states at 200 and 600 nM quencher concentrations. (C) Apparent annealing rates k′on of the 3 model DNA. The annealing rates kon were characterized by the slopes of the linear fits of k′on. (D) Melting rates koff of the 3 model DNA. The melting rates were independent of quencher concentration. 87.5% GC, 37.5% GC, and 87.5% PS-GC are represented by blue, green, and yellow filled circles.
Whereas 3D-SMT provides bias-free single-molecule kinetics measurements in solution, extending in vitro measurements to in vivo measurements faces a number of challenges, including unknown cellular delivery efficiency of the probes and low signal-to-noise ratio (S/N ratio) in the cellular environment. Here we used electroporation for delivering reporter and quencher strands into HeLa cells (Figures S8 and S9). Using FCS, we estimated the delivery efficiency to be 5–18% (Figures S10–S13). To overcome the cellular autofluorescence, the highly fluorescent Atto633 dye was used to label all reporter strands in this study, reaching a signal level of 14 kHz and S/N ratio of 2.5 in live HeLa cells (Figure S14). A clear photon-antibunching signature (Figure S15) confirmed the in vivo tracking of single Atto633-labeled reporter strands. In our time resolved tracking algorithm, ~100 recorded photons were sufficient for a lifetime estimate (Figures S16–S18).
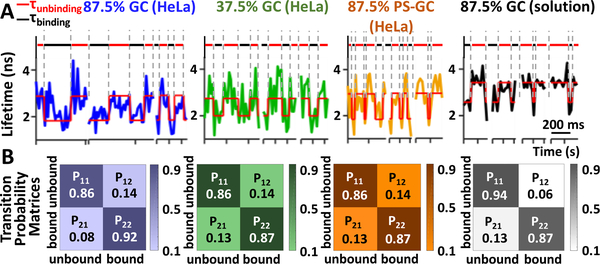
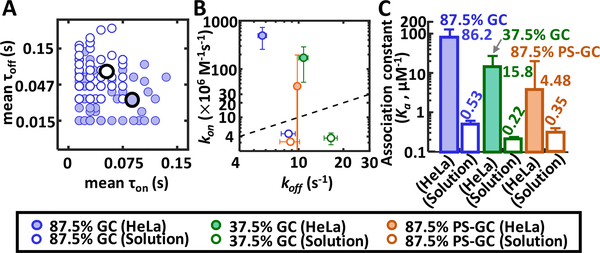
By integrating a spinning disk unit with the 3D-SMT system (Figure S1), we could map the 3D trajectory of a reporter strand to the 3D volumetric image of a HeLa cell (Video S1). The diffusivity of the reporter strand in HeLa cells was found to be 0.34 ± 0.11 μm2 s−1 (Figure S19). Without any quencher strand in HeLa cell, the reporter strand exhibited a single lifetime of 2.71 ± 0.33 ns. With the corresponding quencher strand, digital switching could be clearly seen in the lifetime traces, showing a quenched-state lifetime of 1.70 ± 0.38 ns (Figures S20 and S21). We noticed a 0.7 ns difference in the in vitro and in vivo lifetime values (Figure 4), due to the fact that fluorescence lifetime is a function of pH, viscosity, temperature, oxygen, glucose and ion concentrations, and refractive index of the measurement environment.20 While the 87.5% GC strand still exhibited the longest average dwell time in the bound state (τon = 180 ms, Figure 4A), the highest annealing rate (kon = 492 (±236)·106 M−1 s−1), and the lowest melting rate (koff = 5.70 ± 0.38 s−1), we found the in vivo hybridization kinetics of 87.5% GC strand 108fold higher than its in vitro value (492 vs 4.56 × 10⁶ M−1 s−1, Tables S2 and S3). Compared to the in vitro studies, τon of the 87.5% GC strand became longer in vivo but τoff got shorter (Figure 5A). From the kinetics map, while we could see the ranking of kon was 87.5% GC > 37.5% GC > 87.5% PS-GC and koff was 37.5% GC > 87.5% PS-GC > 87.5% GC for both in vivo and in vitro studies (Figure 5B), the kon variation became much larger in vivo. Other than the changes in kon and koff, the transition probability matrices were also quite different in vivo vs in vitro (Figure 4B). The 87.5% GC strand was more likely to switch from the bound state to the unbound state in vitro (P21 > P12), whereas the 87.5% GC strand was easier to switch from the unbound state to the bound state in vivo (P12 > P21). All the above findings indicated a generally accelerated DNA hybridization in vivo, which might result from the molecular crowding13 and the existence of recombination mediator proteins in cells.3 The difference in the acceleration extent among the 3 model DNA might be related to sequence and modification.
Figure 4.
(A) Representative lifetime traces of the 3 model DNA. The Viterbi path and the corresponding states (red, unbound state; black, bound state) reveal different kinetic behaviors among these systems. (B) Transition probability matrices of the 4 tested systems.
Figure 5.
(A) Mean bound vs mean unbound dwell times per Single-molecule trajectory. Blue filled circle: 87.5% GC in vivo. Blue hollow circles: 87.5% GC in vitro. (B) Kinetics map of kon and koff showing the difference between in vivo and in vitro measurements. The markers represent different reporter strands either in live HeLa cells or in solution. (C) Bar graph showing measured association constants (Ka) for in vivo and in vitro experiments.
While the in vitro high-resolution melting (HRM) analysis indicated PS modifications made the duplex less stable21 (Figure S22, Table S5), there is no causative relationship between the thermostability and the hybridization kinetics (see Supporting Information). Whereas both ensemble (Figures S23 and S24) and single-molecule measurements (Figure 3) showed the same kon trend among the 3 model DNA in vitro, the results may not reflect the real kinetics in live cells. Although previous reports showed that more GC base pairs in the duplex allow for faster zippering reactions,22,23 recent results indicated that structure-free DNA sequences are the key to faster hybridization kinetics.24 However, even structure-free sequences exhibit more than 2 orders of magnitude of variation in annealing rates.24 Whereas new models that predict DNA hybridization kinetics from sequence just started to appear,24 these models have not considered the molecular crowding effect. While we found the hybridization accelerates in the cellular environment, others have reported decelerated hybridization kinetics in cells for oligomers with certain lengths and sequences.3 To elucidate the sequence-dependent kon in vivo, it is necessary to measure kon of many sequences in the native cellular context. Here we offer a bias-free 3D-SMT method to probe single-molecule hybridization kinetics directly in cellular environment. Interestingly, while the ranking of association constant (Ka) was 87.5% GC strand (0.53 μM−1) > 87.5% PS-GC strand (0.35 μM−1) > 37.5% GC strand (0.22 μM−1) in vitro, the ranking changed to 87.5% GC strand (86.2 μM−1, 163-fold increase) > 37.5% GC strand (15.8 μM−1, 72-fold increase) > 87.5% PS-GC strand (4.48 μM−1, 13-fold increase) in vivo (Figure 5C). This meant the phosphorothioate-modified strands can be thermodynamically less stable in the cellular environment than we expected (which cannot be predicted by HRM analysis). This information is critical to the use of modified nucleic acids in disease treatment, despite the fact that they are resistant to the nuclease degradation.
In contrast to other confocal-feedback 3D single-particle tracking demonstrations,14,15 here we demonstrate tracking of a single DNA reporter strand inside a live cell and measuring its annealing-melting kinetics. Although camera-based techniques combined with point-spread function engineering can achieve 3D tracking in live cells,25 they do not offer any lifetime monitoring capability that can be used to reveal the molecular binding kinetics. While two-color colocalization and 2D tracking can provide a full dimerization kinetics analysis of G protein-coupled receptor in live cells,26 the 2D-TIRF imaging method is not suitable to probe the binding kinetics of a biomolecule deep in cytoplasm. On the contrary, our 3D-SMT method uses multiple single-photon detectors27 or multiplexed pulsed laser illuminations28 to achieve spatial filtering,27 which not only allows for deep and high-resolution 3D localization of single molecules in live cells,29 but enables simultaneous characterization of molecular binding state through a continuous lifetime measurement.16 The data acquired can be used to generate new models that can predict in vivo hybridization kinetics from sequence, study the molecular crowding inside cells and probe the cellular development and transition states.
Supplementary Material
ACKNOWLEDGMENTS
The authors thank Prof. David Zhang at Rice University, Prof. Eric Mayo Peterson at University of Utah, Prof. Erik Holmstrom at University of Zurich and Dr. Shih-Chu Jeff Liao at ISS Inc. for discussions and suggestions. The authors also thank Prof. Shelly Sakiyama-Elbert and Prof. Ning Jenny Jiang at UT Austin for equipment supports. This work is supported by Texas 4000, Robert A. Welch Foundation (F-1833, F-1691), National Institute of General Medical Sciences (GM129617), National Institutes of Health (R01GM106137), National Science Foundation (CHE-1611451) and CPRIT grant (RR160005). T.E.Y. is a CPRIT scholar of cancer research.
Footnotes
The authors declare no competing financial interest.
ASSOCIATED CONTENT
Supporting Information
The Supporting Information is available free of charge on the ACS Publications website at DOI: 10.1021/jacs.9b08036.
Materials, experimental methods, optical system, additional discussion, data analysis, tables and figures (PDF) 3D trajectory of a reporter strand to the 3D volumetric image of a HeLa cell (AVI)
REFERENCES
- (1).Gorski SA; Vogel J; Doudna JA RNA-based recognition and targeting: sowing the seeds of specificity. Nat. Rev. Mol. Cell Biol 2017, 18 (4), 215–228. [DOI] [PubMed] [Google Scholar]
- (2).Rinaldi C; Wood MJ Antisense oligonucleotides: the next frontier for treatment of neurological disorders. Nat. Rev. Neurol 2018, 14 (1), 9. [DOI] [PubMed] [Google Scholar]
- (3).Schoen I; Krammer H; Braun D Hybridization kinetics is different inside cells. Proc. Natl. Acad. Sci. U. S. A 2009, 106 (51), 21649–21654. [DOI] [PMC free article] [PubMed] [Google Scholar]
- (4).Johnson-Buck A; Su X; Giraldez MD; Zhao M; Tewari M; Walter NG Kinetic fingerprinting to identify and count single nucleic acids. Nat. Biotechnol 2015, 33 (7), 730–732. [DOI] [PMC free article] [PubMed] [Google Scholar]
- (5).Jungmann R; Steinhauer C; Scheible M; Kuzyk A; Tinnefeld P; Simmel FC Single-molecule kinetics and super-resolution microscopy by fluorescence imaging of transient binding on DNA origami. Nano Lett. 2010, 10 (11), 4756–4761. [DOI] [PubMed] [Google Scholar]
- (6).Peterson EM; Manhart MW; Harris JM Single-Molecule Fluorescence Imaging of Interfacial DNA Hybridization Kinetics at Selective Capture Surfaces. Anal. Chem 2016, 88 (2), 1345–1354. [DOI] [PubMed] [Google Scholar]
- (7).Schickinger M; Zacharias M; Dietz H Tethered multifluorophore motion reveals equilibrium transition kinetics of single DNA double helices. Proc. Natl. Acad. Sci. U. S. A 2018, 115 (32), E7512–E7521. [DOI] [PMC free article] [PubMed] [Google Scholar]
- (8).Dupuis NF; Holmstrom ED; Nesbitt DJ Single-molecule kinetics reveal cation-promoted DNA duplex formation through ordering of single-stranded helices. Biophys. J 2013, 105 (3), 756–766. [DOI] [PMC free article] [PubMed] [Google Scholar]
- (9).Wang Q; Moerner W Single-molecule motions enable direct visualization of biomolecular interactions in solution. Nat. Methods 2014, 11 (5), 555–558. [DOI] [PubMed] [Google Scholar]
- (10).Cisse II; Kim H; Ha T A rule of seven in Watson-Crick basepairing of mismatched sequences. Nat. Struct. Mol. Biol 2012, 19 (6), 623. [DOI] [PMC free article] [PubMed] [Google Scholar]
- (11).Tyagi S; VanDelinder V; Banterle N; Fuertes G; Milles S; Agez M; Lemke EA Continuous throughput and long-term observation of single-molecule FRET without immobilization. Nat. Methods 2014, 11 (3), 297. [DOI] [PubMed] [Google Scholar]
- (12).Tsourkas A; Behlke MA; Rose SD; Bao G Hybridization kinetics and thermodynamics of molecular beacons. Nucleic Acids Res. 2003, 31 (4), 1319–1330. [DOI] [PMC free article] [PubMed] [Google Scholar]
- (13).Nakano S.-i.; Miyoshi D; Sugimoto N Effects of molecular crowding on the structures, interactions, and functions of nucleic acids. Chem. Rev 2014, 114 (5), 2733–2758. [DOI] [PubMed] [Google Scholar]
- (14).Wells NP; Lessard GA; Goodwin PM; Phipps ME; Cutler PJ; Lidke DS; Wilson BS; Werner JH Time-resolved three-dimensional molecular tracking in live cells. Nano Lett. 2010, 10 (11), 4732–4737. [DOI] [PMC free article] [PubMed] [Google Scholar]
- (15).Welsher K; Yang H Multi-resolution 3D visualization of the early stages of cellular uptake of peptide-coated nanoparticles. Nat. Nanotechnol 2014, 9 (3), 198. [DOI] [PubMed] [Google Scholar]
- (16).Liu C; Obliosca J; Liu Y-L; Chen Y-A; Jiang NJ; Yeh HC 3D single-molecule tracking enables direct hybridization kinetics measurement in solution. Nanoscale 2017, 9 (17), 5664–5670. [DOI] [PMC free article] [PubMed] [Google Scholar]
- (17).van de Meent J-W; Bronson JE; Wiggins CH; Gonzalez RL Empirical Bayes methods enable advanced population-level analyses of single-molecule FRET experiments. Biophys. J 2014, 106 (6), 1327–1337. [DOI] [PMC free article] [PubMed] [Google Scholar]
- (18).McKinney SA; Joo C; Ha T Analysis of single-molecule FRET trajectories using hidden Markov modeling. Biophys. J 2006, 91 (5), 1941–1951. [DOI] [PMC free article] [PubMed] [Google Scholar]
- (19).Hadzic MCAS; Börner R; König SLB; Kowerko D; Sigel RKO Reliable State Identification and State Transition Detection in Fluorescence Intensity-Based Single-Molecule Förster Resonance Energy-Transfer Data. J. Phys. Chem. B 2018, 122 (23), 6134–6147. [DOI] [PubMed] [Google Scholar]
- (20).Chung P-H; Tregidgo C; Suhling K Determining a fluorophore’s transition dipole moment from fluorescence lifetime measurements in solvents of varying refractive index. Methods Appl. Fluoresc 2016, 4 (4), No. 045001. [DOI] [PubMed] [Google Scholar]
- (21).Kibler-Herzog L; Zon G; Uznanski B; Whittier G; Wilson WD Duplex stabilities of phosphorothioate, methylphosphonate, and RNA analogs of two DNA 14-mers. Nucleic Acids Res 1991, 19 (11), 2979–2986. [DOI] [PMC free article] [PubMed] [Google Scholar]
- (22).Ouldridge TE; Šulc P; Romano F; Doye JP; Louis AA DNA hybridization kinetics: zippering, internal displacement and sequence dependence. Nucleic Acids Res. 2013, 41 (19), 8886–8895. [DOI] [PMC free article] [PubMed] [Google Scholar]
- (23).Zhang DY; Winfree E Control of DNA strand displacement kinetics using toehold exchange. J. Am. Chem. Soc 2009, 131 (47), 17303–17314. [DOI] [PubMed] [Google Scholar]
- (24).Zhang JX; Fang JZ; Duan W; Wu LR; Zhang AW; Dalchau N; Yordanov B; Petersen R; Phillips A; Zhang DY Predicting DNA hybridization kinetics from sequence. Nat. Chem 2018, 10 (1), 91. [DOI] [PMC free article] [PubMed] [Google Scholar]
- (25).Thompson MA; Casolari JM; Badieirostami M; Brown PO; Moerner W Three-dimensional tracking of single mRNA particles in Saccharomyces cerevisiae using a double-helix point spread function. Proc. Natl. Acad. Sci. U. S. A 2010, 107 (42), 17864–17871. [DOI] [PMC free article] [PubMed] [Google Scholar]
- (26).Kasai RS; Suzuki KG; Prossnitz ER; Koyama-Honda I; Nakada C; Fujiwara TK; Kusumi A Full characterization of GPCR monomer–dimer dynamic equilibrium by single molecule imaging. J. Cell Biol 2011, 192 (3), 463–480. [DOI] [PMC free article] [PubMed] [Google Scholar]
- (27).Liu C; Liu Y-L; Perillo EP; Dunn AK; Yeh H-C Single-molecule tracking and its application in biomolecular binding detection. IEEE J. Sel. Top. Quantum Electron 2016, 22 (4), 64–76. [DOI] [PMC free article] [PubMed] [Google Scholar]
- (28).Perillo EP; Liu Y-L; Huynh K; Liu C; Chou C-K; Hung M-C; Yeh H-C; Dunn AK Deep and high-resolution three-dimensional tracking of single particles using nonlinear and multiplexed illumination. Nat. Commun 2015, 6, 7874. [DOI] [PMC free article] [PubMed] [Google Scholar]
- (29).Liu Y-L; Perillo EP; Liu C; Yu P; Chou C-K; Hung MC; Dunn AK; Yeh H-C Segmentation of 3D trajectories acquired by TSUNAMI microscope: an application to EGFR trafficking. Biophys. J 2016, 111 (10), 2214–2227. [DOI] [PMC free article] [PubMed] [Google Scholar]
Associated Data
This section collects any data citations, data availability statements, or supplementary materials included in this article.


