Abstract
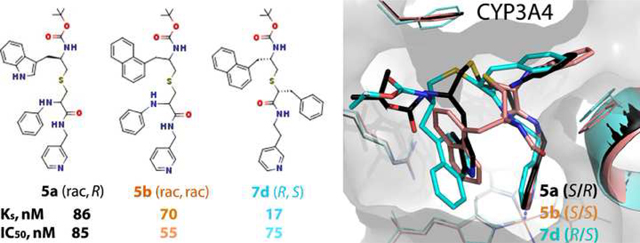
Identification of structural determinants required for potent inhibition of drug-metabolizing cytochrome P450 3A4 (CYP3A4) could help develop safer drugs and more effective pharmacoenhancers. We utilize a rational inhibitor design to decipher structure-activity relationships in analogues of ritonavir, a highly potent CYP3A4 inhibitor marketed as pharmacoenhancer. Analysis of compounds with the R1 side-group as phenyl or naphthalene and R2 as indole or naphthalene in different stereo configuration showed that (i) analogues with the R2-naphthalene tend to bind tighter and inhibit CYP3A4 more potently than the R2-phenyl/indole containing counterparts; (ii) stereochemistry becomes a more important contributing factor, as the bulky side-groups limit the ability to optimize protein-ligand interactions; (iii) the relationship between the R1/R2 configuration and preferential binding to CYP3A4 is complex and depends on the side-group functionality/interplay and backbone spacing; and (iv) three inhibitors, 5a-b and 7d, were superior to ritonavir (IC50 of 0.055–0.085 μM vs. 0.130 μM, respectively).
Keywords: CYP3A4, ligand binding, inhibitor design, crystal structure, structure-activity relations
Graphical Abstract
INTRODUCTION
Human cytochrome P450 3A4 (CYP3A4) is a major hepatic and intestinal isoform and a versatile catalyst that plays a central role in drug metabolism [1]. Drugs can serve not only as substrates but also as inducers and inhibitors of CYP3A4 [2]. Inhibition of CYP3A4 is usually undesired, because it could lead to clinically significant drug-drug interactions, toxicity and therapeutic failures. Thus, unraveling the mechanisms that underline high promiscuity and adaptability of CYP3A4 to structurally diverse ligands could help predict and eliminate the inhibitory potential and other side effects in drug candidates early in the discovery process.
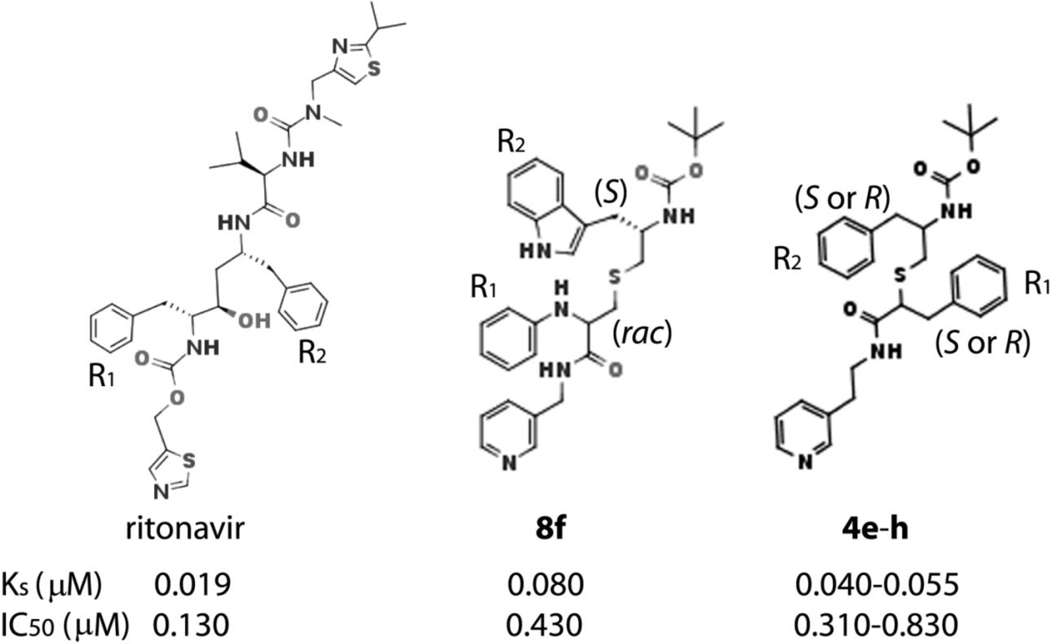
Another area that could benefit from in-depth studies on the CYP3A4 ligand binding and inhibitory mechanism is pharmacoenhancement. Currently, three CYP3A4 inhibitors are used as pharmacoenhancers for quickly-metabolized antiviral and immunosuppressant drugs: ritonavir (originally designed as an HIV protease inhibitor; Figure 1), its derivative cobicistat, and the antifungal agent ketoconazole [3–6]. Neither booster is highly specific for CYP3A4 or was designed based on its crystal structure. The same is true for itraconazole and clarythromycine, used as alternatives to highly toxic ketoconazole in drug development drug-drug interaction studies [7, 8]. Therefore, elucidation of structure-activity relations for CYP3A4 inhibitors could help develop safer, more potent and highly specific index inhibitors and pharmacoenhancers.
Figure 1.
Chemical structures of ritonavir and the most potent/high affinity CYP3A4 inhibitors, 8f and 4e-h, from the previously designed series II and III, respectively.15–16 The R1 and R2 side-groups are indicated. In ritonavir, the phenyl side-groups would be in R,R configuration if the hydroxyl group is removed.
Based on our previous studies on the interaction of CYP3A4 with ritonavir and its analogues [9–12], we developed a pharmacophore model for a CYP3A4-specific inhibitor [13] and utilized a build-from-scratch approach to elucidate the relative importance of each pharmacophoric determinant. Three groups of inhibitors (series I-III) with different backbones and side-groups attached to the pyridine ring, serving as the heme-ligating moiety, have been already characterized [14–16]. These studies demonstrated that the binding and inhibitory strength of ritonavir-like compounds depends on the backbone length and composition, spacing between the functional groups, H-bonding to the active site Ser119, hydrophobic interactions mediated by the R1/R2 side-groups and, to a lesser degree, their stereo configuration.
The current study was designed to test one of the earlier predictions that an increase in the R2 hydrophobicity could improve the inhibitory strength [15, 16]. Eight (series IV) analogues were developed by modifying the R2 functionality in two different scaffolds used for synthesis of 8f, the most potent series II inhibitor [15], and 4e-h, the high-affinity subgroup from series III [16] (Figure 1). Here we report that, indeed, compounds with the larger, more hydrophobic naphthalene ring at R2 position tend to bind tighter and inhibit CYP3A4 more potently than their phenyl- or indole-containing counterparts. The backbone spacing and side-group configuration were other factors that strongly influenced the inhibitory strength and preferential binding to CYP3A4. Most importantly, for the first time, this study identified three compounds that were chemically simpler than ritonavir but inhibited CYP3A4 twice as stronger.
MATERIALS AND METHODS
Chemistry General Methods –
All reactions were performed with commercially available reagents (Aldrich, Thermo-Fisher, Alfa Aesar, Acros, Oakwood, Millipore) without further purification. Anhydrous solvents were acquired through a solvent purification system (Inert PureSolv and JC Meyer systems) or purified according to standard procedures. 1H NMR spectra were recorded on Bruker DRX 400 MHz, Bruker DRX 500 MHz, or Bruker Avance 600 MHz spectrometer and processed using TopSpin 3.5 software. LRMS and HRMS data were obtained via ESI LC-TOF on a Waters (Micromass) LCT Premier spectrometer (Waters), with PEG as the calibrant for HRMS. Optical rotation was recorded on a Rudolph Autopol III Automatic Polarimeter at room temperature in methanol. TLC was performed using EMD Millipore silica gel 60 F254 aluminum plates. Separation by column chromatography was conducted using Fisher silica gel 60 (230–400 mesh). Purity of final products was verified by 1H NMR with TMS as a standard and by UPLC-MS (Waters Acquity UPLC H-class QDA with a FTN) with a C18 column (2.1 x 50 mm; Acquity UPLC BEH C18; 1.7 μm particles). All investigated compounds were >95% pure as determined by UPLC-MS. High resolution mass spectrometry data, NMR spectra, and UPLC-MS chromatograms are included in the Supplementary Material.
Synthesis of analogues
Typical procedure for amino alcohols from amino acids (compounds 1a-e)[17, 18] –
To a flask containing DL-1-Naphthylalanine (1a) (1.0 g, 4.6 mmol), TMSCl (1.51 g, 14 mmol, 3 eq) was added, followed by anhydrous methanol (10 mL). The reaction was allowed to stir at room temperature overnight. Upon completion, the volatiles were removed in vacuo, affording the crude methyl ester hydrochloride (1.34 g). The crude salt was then dissolved in ethyl ether:methanol (7.5:1; 30 mL:4 mL) and cooled to −10 °C. Triethylamine (6 mL) was slowly added and the reaction was stirred for one hour at −10 °C. After reaction completion, the solution was filtered through a pad of celite to remove Et3N salt, and the filtrate was evaporated in vacuo affording the free base methyl ester (1.14 g). The methyl ester was dissolved in methanol (35 mL) and placed on an ice bath. Sodium borohydride (10 eq) was added portion-wise over 20 minutes and the reaction was allowed to come to room temperature overnight. The solvent was then evaporated, diluted with H2O (80 mL), and extracted with EtOAc (3 x 100 mL). The combined organic layers were dried over MgSO4, filtrated and concentrated in vacuo affording 2a as a white powder (0.87 g, 94%), which was used without further purification. 1H NMR (400 MHz, CDCl3T) δ 8.05 (d, J = 7.0 Hz, 1H), 7.88 (d, J = 9.1 Hz, 1H), 7.77 (d, J = 8.7 Hz, 1H), 7.53 (sext, J = 7.6 Hz, 2H), 7.43 (t, J = 7.7 Hz, 1H), 7.36 (d, J = 6.2 Hz, 1H), 3.72 (dd, J = 3.7, 10.6 Hz, 1H), 3.49 (dd, J = 6.6, 10.6 Hz, 1H), 3.33 (m, 2H), 2.95 (dd, J = 9.7, 14.8 Hz, 1H). HRMS m/z calculated for C13H16NO [M + H]+: 202.1232. Found: 202.1227.
Synthesis of Boc protected, tosylated, amino alcohols (compounds 3a-e) –
Compounds 3a-e were prepared using methods described previously [14], as outlined in Scheme 1.
Scheme 1.
General Procedure for Synthesis of Compounds 4a-b (Scheme 2) –
Scheme 2.
To a solution of N-phenylcysteine hydrobromide, prepared as described previously [14], (0.093 g, 0.34 mmol, 1.5 eq) in DMF (4 mL), compound 3b (0.1 g, 0.22 mmol) was added. The reaction was allowed to stir for 30 min at 50 °C, after which 1 N NaOH (2 mL) was added dropwise. The reaction was then stirred at 50 °C overnight. The flask was cooled to room temperature and pH was examined/adjusted to 8.0. The solvent was evaporated in vacuo to give the crude oily product 4a, which was used in the next step without any further purification. LRMS m/z calculated for C25H31N3O4S [M + Na]+: 492.2. Found: 492.1. 4b LRMS m/z calculated for C27H32N2O4S [M + Na]+: 503.2. Found: 503.1.
General Procedure for Synthesis of Compounds 5a-b (Scheme 2) –
Crude 4a (0.37 g, 0.78 mmol (Theoretical: 0.10 g, 0.22 mmol)) was dissolved in DMF (9 mL). To this solution, EDAC (0.23 g, 1.2 mmol, 1.5 eq) and HOBt (0.18 g, 1.2 mmol, 1.5 eq) were added, followed by the addition of 3-(aminomethyl)pyridine (0.13 g, 1.2 mmol, 1.5 eq) and DIPEA (0.31 g, 2.4 mmol, 3 eq). was then washed with saturated NaHCO3 (50 mL), water (2 x 50 mL), and brine (50 mL). The combined organic layers were dried over MgSO4, filtrated and concentrated in vacuo to give the crude product, which was purified via column chromatography (95:5 EtOAc:MeOH). The pure product 5a was obtained as a white fluffy solid (0.03 g, 24%). TLC: EtOAc/MeOH 90:10 (Rf. 0.58). 1H NMR (400 MHz, CDCl3) δ 8.46 (m, 2H), 8.33 (bs, 1H (NH)), 7.62 (d, J = 7.9 Hz, 1H), 7.50 (t, J = 6.3 Hz, 1H), 7.36 (m, 2H), 7.19 (m, 3H), 7.11 (m, J = 3.8 Hz, 1H), 6.98 (s, 1H), 6.83 (t, J = 6.9 Hz, 1H), 6.64 (dd, J = 7.8, 14.4 Hz, 2H), 4.78 (t, J = 10.2 Hz, 1H), 4.68 (bd, J = 27.6 Hz, 1H (NH)), 4.39 (m, 2H), 4.11 (bs, 1H), 3.94 (bd, J = 43.7 Hz, 1H (NH)), 3.15 (dt, J = 4.4, 13.7 Hz, 1H), 3.00 (m, 3H), 2.63 (m, 2H), 1.87 (bs, 1H (NH)), 1.42 (d, J = 12.1 Hz, 9H). HRMS m/z calculated for C31H37N5O3SNa [M + Na]+: 582.2515. Found: 593.2516. The pure product 5b was acquired as a white fluffy solid (0.029 g, 23%). TLC: EtOAc/MeOH 90:10 (Rf. 0.6). 1H NMR (400 MHz, CDCl3) δ 8.46 (s, 2H), 8.14 (d, J = 7.2 Hz, 1H), 7.85 (s, 1H) 7.75 (t, J = 7.4 Hz, 1H), 7.50 (m, 3H), 7.31 (d, J = 5.7 Hz, 2H), 7.18 (m, 3H), 6.83 (q, J = 6.4 Hz, 1H), 6.63 (t, J = 10.2 Hz, 2H), 4.80 (dd, J = 8.0, 27.7 Hz, 1H), 4.61 (bd, J = 29.3 Hz, 1H (NH)), 4.40 (m, 2H), 4.18 (sext, J = 6.8 Hz, 1H), 3.95 (bd, J = 36.6 Hz, 1H (NH)), 3.34 (dd, J = 7.2, 14.0 Hz, 1H), 3.23 (dd, J = 7.3, 13.5 Hz, 1H), 3.08 (m, 2H), 2.68 (t, J = 5.8 Hz, 2H). 1.37 (d, J = 14.0 Hz, 9H). HRMS m/z calculated for C33H38N4O3SNa [M + Na]+: 593.2562. Found: 593.2545.
General Procedure for Synthesis of Compounds 6a-d (Scheme 3) –
Scheme 3.
To a solution of L-α-thiophenylalanine, prepared as described previously [18], (0.05 g, 0.28 mmol, 1.3 eq in 4 mL of DMF), compound 3b (0.1 g, 0.22 mmol) was added. The reaction was allowed to stir for 30 min at 50 °C, after which 1 N NaOH (2 mL) was added dropwise. The reaction was then stirred at 50 °C overnight. The flask was cooled to room temperature and pH was examined/adjusted to 8.0. The solvent was evaporated, diluted with 10% HCl (50 mL), and extracted with Et2O (3 x 50 mL). The combined organic layers were dried over MgSO4, filtrated and concentrated in vacuo to give the crude oily product 6a, which was used in the next step without any further purification. LRMS m/z calculated for C25H30N2O4S [M + Na]+: 477.2. Found: 477.1. 6b LRMS m/z calculated for C25H30N2O4S [M + Na]+: 477.2. Found: 477.1. 6c LRMS m/z calculated for C27H31NO4S [M + Na]+: 488.2. Found: 488.1. 6d LRMS m/z calculated for C27H31NO4S [M + Na]+: 488.2. Found: 488.1.
General Procedure for Synthesis of Compounds 7a-d (Scheme 3) –
Crude 6a (0.11 g, 0.24 mmol) was dissolved in DMF (4 mL). To this solution, EDAC (0.07 g, 0.36 mmol, 1.5 eq) and HOBt (0.055 g, 0.36 mmol, 1.5 eq) were added, followed by the addition of 3-(2-aminoethyl)pyridine (0.04 g, 0.36 mmol, 1.5 eq) and DIPEA (0.09 g, 0.72 mmol, 3 eq). The reaction was stirred at room temperature overnight. Upon completion, the solvent was evaporated and the reaction mixture was diluted with ethyl acetate (80 mL). The organic layer was then washed with saturated NaHCO3 (50 mL), water (2 x 50 mL), and brine (50 mL). The combined organic layers were dried over MgSO4, filtrated and concentrated in vacuo to give the crude product, which was purified via column chromatography (95:5 EtOAc:MeOH). The pure product 7a was obtained as a light yellow fluffy solid (0.029 g, 22%). TLC: EtOAc/MeOH 90:10 (Rf. 0.5). 1H NMR (400 MHz, CDCl3) δ 8.43 (m, 2H), 8.29 (s, 2H), 8.25 (s, 1H (NH)), 7.56 (dt, J = 7.4, 23.3 Hz, 2H), 7.41–7.07 (m, 8H), 6.97 (s, 1H), 6.35 (t, J = 6.3 Hz, 1H), 4.66 (s, 1H (Boc-NH)), 4.21 (m, 1H), 4.05 (m, 1H), 3.41 (q, J = 6.5 Hz, 1H), 3.35 (m, 1H), 3.23 (dd, J = 7.3, 13.5 Hz, 2H), 3.03 (m, 1H), 2.92 (dd, J = 6.7, 13.3 Hz, 2H), 2.58 (m, 1H), 2.51 (dd, J = 6.1, 13.1 Hz, 1H), 1.43 (s, 9H). HRMS m/z calculated for C32H38N4O3SNa [M + Na]+: 581.2562. Found: 581.2573. The pure product 7b was acquired as a light yellow fluffy solid (0.018g, 12%). TLC: EtOAc/MeOH 90:10 (Rf. 0.5). 1H NMR (400 MHz, CDCl3) δ 8.42 (d, J = 4.64 Hz, 2H), 8.29 (s, 2H), 8.20 (s, 1H (NH)), 7.59 (dd, J = 7.9, 13.5 Hz, 2H), 7.41–7.08 (m, 8H), 6.97 (s, 1H), 6.35 (t, J = 5.7 Hz, 1H), 4.66 (s, 1H (Boc-NH)), 4.20 (m, 1H), 4.05 (m, 1H), 3.41 (q, J = 6.2 Hz, 1H), 3.35 (m, 1H), 3.23 (dd, J = 7.5, 13.4 Hz, 2H), 3.03 (t, J = 6.3 Hz, 1H), 2.92 (dd, J = 7.0, 13.5 Hz, 2H), 2.58 (m, 1H), 2.51 (dd, J = 5.9, 13.1 Hz, 1H), 1.42 (s, 9H). HRMS m/z calculated for C32H38N4O3SNa [M + Na]+: 581.2562. Found: 581.2543. The pure product 7c was obtained as an off-white fluffy solid (0.04 g, 27%). TLC: EtOAc/MeOH 90:10 (Rf. 0.58). 1H NMR (400 MHz, CDCl3) δ 8.41 (d, J = 4.4 Hz, 2H), 8.27 (s, 1H), 8.12 (d, J = 8.4 Hz, 1H), 7.82 (d, J = 8.2 Hz, 1H), 7.73 (d, J = 8.1 Hz, 1H), 7.55 (t, J = 7.5 Hz, 1H), 7.48 (t, J = 7.4 Hz, 1H), 7.37 (t, J = 7.6 Hz, 1H), 7.32–7.19 (m, 6H), 7.12 (t, J = 6.4 Hz, 1H), 6.38 (t, J = 6.0 Hz, 1H), 4.72 (d, J = 7.3 Hz, 1H), 4.11 (sext, J = 6.8 Hz, 1H), 3.39 (t J = 7.2 Hz, 2H), 3.25 (dd, J = 7.3, 13.8 Hz, 2H), 3.19 (m, 1H), 2.92 (dd, J = 6.8, 13.8 Hz, 1H), 2.61 (t, J = 7.0 Hz, 2H), 2.55 (d, J = 7.0 Hz, 2H), 1.39 (s, 9H). HRMS m/z calculated for C34H39N3O3SNa [M + Na]+: 592.2610. Found: 592.2607. The pure product 7d was acquired as a light yellow fluffy solid (0.02 g, 13.5%). TLC: EtOAc/MeOH 90:10 (Rf. 0.58). 1H NMR (400 MHz, CDCl3) δ 8.41 (d, J = 3.9 Hz, 2H), 8.27 (s, 1H), 8.12 (d, J = 8.0 Hz, 1H), 7.83 (d, J = 8.2 Hz, 1H), 7.73 (d, J = 7.9 Hz, 1H), 7.55 (t, J = 7.8 Hz, 1H), 7.48 (t, J = 6.9 Hz, 1H), 7.37 (t, J = 7.6 Hz, 1H), 7.31–7.17 (m, 6H), 7.12 (t, J = 6.5 Hz, 1H), 6.36 (t, J = 6.0 Hz, 1H), 4.70 (d, J = 8.4 Hz, 1H), 4.12 (sext, J = 6.7 Hz, 1H), 3.39 (t J = 7.1 Hz, 2H), 3.25 (dd, J = 7.4, 13.9 Hz, 2H), 3.19 (m, 1H), 2.92 (dd, J = 7.0, 13.7 Hz, 1H), 2.61 (t, J = 7.0 Hz, 2H), 2.56 (d, J = 6.4 Hz, 2H), 1.39 (s, 9H). HRMS m/z calculated for C34H39N3O3SNa [M + Na]+: 592.2610. Found: 592.2599.
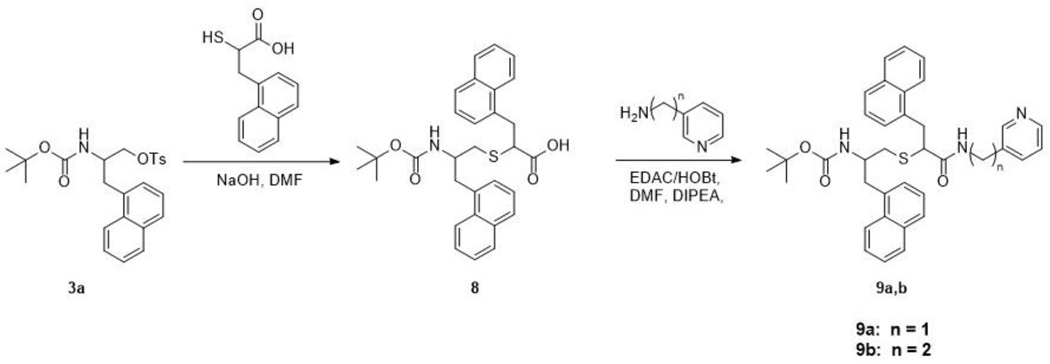
Synthesis of Compound 8 (Scheme 4) –
Scheme 4.
To a solution of α-thio-napthylalanine, prepared as described previously [18], (0.2 g, 0.86 mmol, 1.3 eq) in DMF (5 mL), compound 3a (0.3 g, 0.66 mmol) was added. The reaction was allowed to stir for 30 min at 50 °C, after which 1 N NaOH (2 mL) was added dropwise. The reaction was then stirred at 50 °C overnight. The flask was cooled to room temperature and pH was examined/adjusted to 8.0. The solvent was evaporated, diluted with 10% HCl (50 mL), and extracted with Et2O (3 x 50 mL). The combined organic layers were dried over MgSO4, filtrated and concentrated in vacuo to give the crude oily product 8, which was used in the next step without any further purification. LRMS m/z calculated for C31H33NO4S [M + Na]+: 538.2. Found: 538.1.
General Procedure for Synthesis of Compounds 9a-b (Scheme 4) –
Crude 8 (0.15 g, 0.3 mmol) (0.07 g, 0.45 mmol, 1.5 eq) were added, followed by the addition of 3-(aminomethyl)pyridine (0.05 g, 0.45 mmol, 1.5 eq) and DIPEA (0.12 g, 0.9 mmol, 3 eq). The reaction was stirred at room temperature overnight. Upon completion, the solvent was evaporated and the reaction mixture was diluted with ethyl acetate (70 mL). The organic layer was then washed with saturated NaHCO3 (30 mL), water (50 mL), and brine (50 mL). The combined organic layers were dried over MgSO4, filtrated and concentrated in vacuo to give the crude product, which was purified via column chromatography (95:5 EtOAc:MeOH). The pure product 9a was acquired as a light yellow solid (0.053 g, 29%). TLC: EtOAc/MeOH 90:10 (Rf. 0.62). 1H NMR (400 MHz, CDCl3) δ 8.42 (s, 2H), 8.32 (s, 1H), 8.21 (d, J = 8.22 Hz, 2H), 8.06 (m, 6H), 7.94–7.29 (m, 8H), 5.11 (s, 1H (Boc-NH)), 4.71 (q, J = 7.9 Hz, 2H), 4.39 (m, 1H), 4.35 (m, 1H), 4.24 (t, J = 4.9 Hz, 2H), 3.76 (m, 1H), 3.64 (m, 1H), 3.36–3.22 (m, 2H), 2.71 (m, 2H), 1.32 (s, 9H). HRMS m/z calculated for C37H39N3O3SNa [M + Na]+: 628.2610. Found: 628.2632. (0.15g, 0.7 mmol (Theoretical: 0.1g, 0.22 mmol)) was dissolved in DMF (9 mL). 8 and 3-(aminoethyl)pyridine afforded the pure product 9b as a white solid (0.01 g, 5%). TLC: EtOAc/MeOH 90:10 (Rf. 0.6). 1H NMR (400 MHz, CDCl3) δ 8.40 (s, 1H), 8.32 (s, 1H), 8.06 (m, 2H), 7.86 (m, 6H), 7.74–7.36 (m, 8H), 4.65 (m, 2H), 4.14 (m, 2H), 3.76 (m, 2H), 3.41 (m, 2H), 3.23 (m, 2H), 2.86 (m, 1H), 2.83 (m, 1H), 1.30 (m, 9H). HRMS m/z calculated for C38H41N3O3SNa [M + Na]+: 642.2766. Found: 642.2747.
Protein Expression and Purification –
Codon-optimized full-length and Δ3–22 human CYP3A4 were produced as reported previously [19] and used for assays and crystallization, respectively.
Spectral Binding Titrations –
Equilibrium ligand binding to CYP3A4 was monitored in a Cary 300 spectrophotometer at ambient temperature in 0.1 M phosphate buffer, pH 7.4, supplemented with 20% glycerol and 1 mM dithiothreitol. Inhibitors were dissolved in dimethyl sulfoxide (DMSO) and added to a 2 μM protein solution in small aliquots, with the final solvent concentration <2%. Spectral dissociation constants (Ks) were determined from quadratic fits to titration plots.
Thermal Denaturation –
Thermal denaturation curves were recorded in 0.1 M phosphate buffer, pH 7.4, in a Cary 300 spectrophotometer. Protein (1 μM) was mixed with a ligand (20 μM) and incubated for 15 min at 23 °C. Melting curves were recorded at 260 nm using a 0.2 °C measurement step, 0.9 °C/min ramp rate, and 50–75 °C temperature range. A denaturation midpoint (melting temperature; Tm) was determined from non-linear fittings to the melting curve as described earlier [16].
Inhibitory Potency Assays –
Inhibitory potency for the 7-benzyloxy-4-(trifluoromethyl)coumarin (BFC) O-debenzylation activity of CYP3A4 was evaluated fluorometrically in a soluble reconstituted system. The full-length CYP3A4 and rat cytochrome P450 reductase (40 μM and 60 μM, respectively) were preincubated at room temperature for 1 hr before 20-fold dilution with the reaction buffer consisting of 0.1 M potassium phosphate, pH 7.4, catalase and superoxide dismutase (2 Units/mL each), and 0.0025% CHAPS (3-[(3-cholamidopropyl)dimethyl-ammonio]-1-propanesulfonate). Prior to measurements, 85 μl of the reaction buffer was mixed with 10 μl of the NADPH-regenerating system (10 mM glucose, 0.2 mM NADP+, and 2 Units/mL glucose-6-phosphate dehydrogenase), 5 μl of the protein mixture (0.1 μM final CYP3A4 concentration), and 2 μl of the inhibitor solution or DMSO. The mixture was incubated for 2 min, after which 1 μl of 2 mM BFC and 1 μl of 7 mM NADPH were added to initiate the reaction. Accumulation of the fluorescent product, 7-hydroxy-4(trifluoromethyl)coumarin, was monitored for 2 min at room temperature in a Hitachi F400 fluorimeter (λex = 404 nm; λem = 500 nm). Within this time interval, fluorescence changes were linear. The average of three measurements was used to calculate the remaining activity, with the DMSO-containing sample used as a control (100% activity). The IC50 values were derived from the [% activity] vs. [inhibitor] plots as described previously [16].
Kinetics of Ligand Binding and Heme Reduction –
Kinetics of ligand binding to CYP3A4 and its reduction with sodium dithionite were measured at 426 nm and 443 nm, respectively, in a SX.18MV stopped flow apparatus (Applied Photophysics, UK), as described earlier [16].
Determination of the X-ray Structures –
Δ3–22 CYP3A4 was co-crystallized with the inhibitors at room temperature by a microbatch method under oil. Protein (70–80 mg/mL) was incubated with a 5–10-fold ligand excess and centrifuged to remove the precipitate. The supernatant (0.40.6 μl) was mixed with 0.4–0.6 μl of the crystallization solution, containing 10–12% polyethylene glycol 3350 and either 60–80 mM sodium malonate, pH 6.0–7.0 (for 5a, 7b-d and 9b), 80 mM succinate pH 7.0 (for 5b and 7a) or 80 mM malate, pH 7.0 (for 9a), and covered with paraffin oil. After harvesting, crystals were cryoprotected with Paratone-N and frozen in liquid nitrogen. X-ray diffraction data were collected at the Stanford Synchrotron Radiation Lightsource beamlines 9–2, 12–2 and 14–1, and the Advanced Light Source beamline 5.0.2. The high resolution cutoffs were chosen based on the CC1/2 value as recommended [20]. Crystal structures were solved by molecular replacement with PHASER [21] and the 5VCC structure as a search model. Ligands were built with eLBOW [22] and manually fit into the density with COOT [23]. The initial models were rebuilt and refined with COOT and PHENIX [22]. For racemic compounds, the side-group configuration was automatically assigned during the first refinement cycle. The following refinement was conducted with all possible stereoisomer combinations to confirm that the assigned chirality was most optimal. Polder omit electron density maps were calculated with PHENIX. Data collection and refinement statistics are summarized in Tables S1 and S2. The atomic coordinates and structure factors for the 5a-, 5b-, 7a-, 7b-, 7c-, 7d-, 9a- and 9b-bound CYP3A4 were deposited in the Protein Data Bank with the ID codes 6UNE, 6UNG, 6UNH, 6UNI, 6UNJ, 6UNK, 6UNL and 6UNM, respectively.
RESULTS AND DISCUSSION
Rationale for series IV analogues
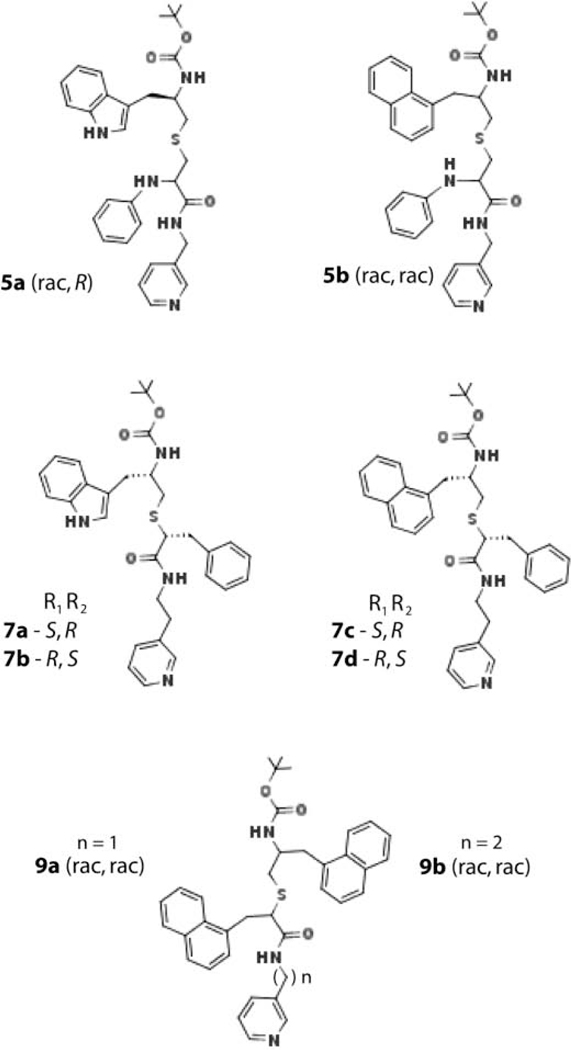
Structure-activity studies on series II and III analogues suggested that an increase in hydrophobicity of the R2 side-group, which preferably binds near the heme-ligating pyridine (designated as P2 site), could increase the inhibitory potency for CYP3A4 [15, 16]. To test this prediction, series IV analogues were produced by modifying two different scaffolds/parent compounds: 8f, the most potent series II inhibitor [15], and 4e-h, the high-affinity subgroup from series III [16] (Figure 1). Compared to the latter compounds, 8f has a shorter pyridyl linker, racemic N-phenyl at the R1 position, longer R1-R2 spacer, and indole instead of phenyl as R2. The 8f scaffold was modified by either changing the R2 stereochemistry or replacing indole with naphthalene: compounds 5a (rac,R) and 5b (rac,rac), respectively (Figure 2). In the 4e-h scaffold, the R1-phenyl was kept unchanged and R2 was substituted with indole or naphthalene in opposite configuration: 7a (S,R)/7b (R,S) and 7c (R,S)/7d (S,R) pairs, respectively (Figure 2). The opposing R1/R2 configuration is less favorable for the inhibition of CYP3A4 [16] and, hence, we reasoned that a pairwise comparison of the S/R and R/S stereoisomers would help better detect the impacts of R2 substitution. Two additional analogues with racemic naphthalene at R1 and R2 positions, and pyridyl-methyl or pyridyl-ethyl linker (9a and 9b, respectively) were synthesized to determine how an increase in bulkiness/hydrophobicity of both side-groups affects the binding mode and selectivity of ligand binding. Interaction of analogues with the full-length CYP3A4 was spectrally, kinetically and functionally analyzed, and their co-crystal structures with Δ3–22 CYP3A4 were determined.
Figure 2.
Chemical structures of the investigated compounds.
Earlier, we identified parameters that, collectively, tend to correlate with the inhibitory potency of ritonavir-like compounds [16]. These include: a) an absorbance maximum for the ligand-bound CYP3A4 (λmax) and a peak/trough amplitude in the difference spectra for ferric ligand-free/ligand-bound forms (ΔAmax), which reflect electronic properties of the ligating group and steric properties/environment distant from the heme, respectively; b) spectral dissociation constant (Ks), a measure of the binding affinity; c) changes in the melting temperature (ΔTm), reflecting protein stability; and d) CYP3A4 reduction rate (kET) that depends on accessibility and redox potential of the heme cofactor. These parameters, as well as the ligand binding rate, were measured for all new analogues and 8f, whose interaction with the full-length CYP3A4 has not been previously investigated. Although ritonavir is generally considered as a mechanism-based inhibitor [24–27], our prior work on series III inhibitors showed that preincubation of ritonavir or its analogues with NADPH in a lipid-free reconstituted system leads to a small increase rather than decrease in IC50, likely to due to partial metabolism [16]. Therefore, in this study, inhibitory assays with NADPH preincubation were not conducted.
Series II Modification (5a-b)
Spectral and biochemical properties –
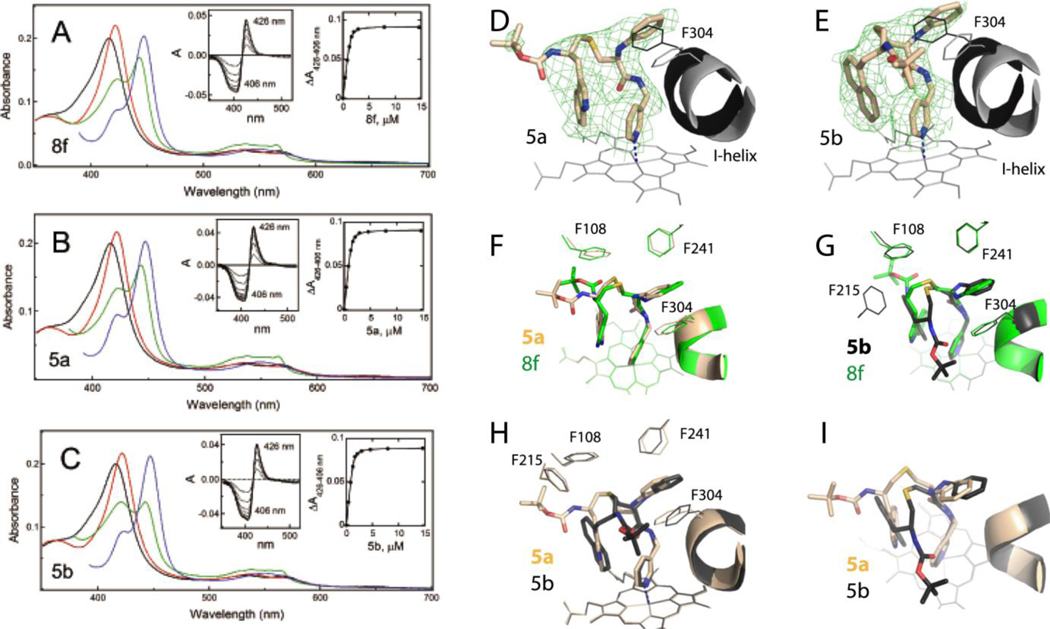
As expected, upon binding to CYP3A4, 8f and its derivatives, 5a and 5b, induced a red shift in the Soret band (red spectra in Figure 3A-C), indicative of the pyridine nitrogen ligation to the heme iron. While λmax remained the same (422 nm; Table 1), the ΔAmax value, expressed as a percentage of that for ritonavir (Figure S1), decreased from 111% for 8f to 104 and 107% for 5a and 5b, respectively. One striking difference was a considerably lower amplitude of the 443 nm peak for the ferrous CYP3A4-5b complex (compare green spectra in Figure 3A-C). This could result from a decreased accessibility of the reductant, sodium dithionite, as no conversion to the inactivated P420 form was observed during lengthy titrations (spectra of the ferrous CO-adduct are shown in blue in Figure 3A-C).
Figure 3.
A-C, Spectral changes in CYP3A4 induced by 8f and 5a-b, respectively. Absorbance spectra of oxidized ligand-free and ligand-bound CYP3A4 are in black and red, respectively. Spectra of ferrous ligand-bound CYP3A4 and its CO-adduct are in green and blue, respectively. Left insets are difference spectra recorded during equilibrium titrations. Right insets are titration plots with quadratic fittings. Spectral dissociation constants (Ks) derived from titration plots are listed in Table 1.
D and E, The S/R and S/S conformers of 5a and 5b, respectively, bound to CYP3A4 in the crystal structures (PDB ID 6UNE and 6UNG, respectively). The adjacent I-helix and F304 in the inhibitory complexes and water-bound CYP3A4 (4I3Q structure) are shown in gray and black, respectively. Polder omit maps contoured at 3σ level are shown as green mesh.
F and G, Structural overlay of the CYP3A4-8f (S, S) complex (PDB ID 6BDM) with the 5a- and 5b-bound models, respectively.
H and I, Side and top views at superimposed 5a/b-CYP3A4 structures.
Table 1.
Properties of series IV inhibitors
| compound | λmax (nm) ligand-bound |
ΔAmax (%)a | Ksb μM |
IC50c μM |
IC50/Ks | ΔTmd °C |
kfaste s−1 |
kETfastf s−1 |
|---|---|---|---|---|---|---|---|---|
|
5-atom R1-R2 spacer, pyridyl-methyl linker R1-N-phenyl/R2-indole | ||||||||
| 8f (rac,S) | 422 | 111 | 0.074±0.003 | 0.320±0.018 | 4.3 | +4.0 | 2.7 (55%) | 0.061 (23%) |
| 5a (rac,R) | 422 | 104 | 0.086±0.003 | 0.085±0.005 | 1.0 | +2.5 | 7.5 (39%) | 0.047 (35%) |
| R1-N-phenyl/R2-naphthalene | ||||||||
| 5b (rac,rac) | 422 | 107 | 0.070±0.002 | 0.055±0.005 | 0.8 | +3.3 | 6.5 (40%) | 0.038 (36%) |
|
4-atom R1-R2 spacer pyridyl-ethyl linker R1-phenyl/R2-indole | ||||||||
| 7a (S, R) | 422 | 108 | 0.062± 0.002 | 0.173±0.016 | 2.8 | +3.8 | 4.1 (49%) | 0.015 (46%) |
| 7b (R, S) | 422 | 110 | 0.085± 0.002 | 0.102±0.009 | 1.2 | +4.1 | 6.8 (43%) | 0.020 (28%) |
|
pyridyl-ethyl linker R1-phenyl/R2-naphthalene | ||||||||
| 7c (S, R) | 422 | 110 | 0.052± 0.002 | 0.356±0.031 | 6.8 | +4.5 | 9.0 (41%) | 0.016 (15%) |
| 7d (R, S) | 422 | 108 | 0.017± 0.001 | 0.075±0.006 | 4.4 | +4.5 | 10.2 (43%) | 0.027 (25%) |
|
pyridyl-methyl linker
R1-naphthalene/R2-naphthalene | ||||||||
| 9a (rac,rac) | 421 | 98 | 0.190±0.010 | 0.244±0.012 | 1.3 | +4.0 | 1.3 (33%) | 0.035 (32%) |
|
pyridyl-ethyl linker R1-naphthalene/R2-naphthalene | ||||||||
| 9b (rac,rac) | 422 | 105 | 0.037± 0.002 | 0.218±0.0235 | 5.9 | +4.1 | 3.9 (33%) | 0.027 (41%) |
Maximal absorbance change in the ferric ligand-bound CYP3A4 was calculated from the difference spectra (Figure S1) and expressed as a percentage relative to that induced by ritonavir.
Spectral dissociation constant for the CYP3A4-inhibitor complex determined from titration plots.
The half maximal inhibitory concentration for the BFC debenzylase activity of CYP3A4.
Ligand-dependent change in the melting temperature of CYP3A4.
Rate constants for the fast phase of the ligand binding reaction and reduction of the ligand-bound CYP3A4 with sodium dithionite, respectively.
Comparable dissociation constants derived for 8f and 5a-b (0.070–0.086 μM; Table 1) suggest that the binding affinity is only weakly affected by changes in R2 hydrophobicity and configuration. In contrast, the IC50 values for BFC debenzylase activity of CYP3A4 varied by 4-to-6-fold: from 0.320 μM for 8f to 0.085 and 0.055 μM for 5a and 5b, respectively. To better understand this result, the ligand binding and heme reduction rates were compared. Within the studied time interval, both reactions had a fast phase and one or two slow phases. The rate constants for the fast phase (kfast and kETfast, respectively) and their relative percentage are listed in Table 1, whereas kinetic traces and the rate constants for the slow phase(s) can be seen in Figures S2 and S3. Ligation of 5a-b to CYP3A4 proceeded faster than the parent compound (kfast of 6.5–7.5 s−1 vs. 2.7 s−1 for 8f), and the resulting complexes were reduced with a slower rate (~30% decrease in kETfast). This suggests that 5a-b lower the heme accessibility to the higher degree and, as a consequence, inhibit the substrate access and metabolism more potently than 8f. It should be noted also that a slow decay of the 443 nm absorbance was observed for the 5bbound CYP3A4 (Figure S3), likely due to structural rearrangements in the active site. The ability of 5b to destabilize the ferrous form could contribute to the inhibitory potency, which was the highest in the subgroup.
Although there was no clear correlation between IC50, ΔAmax, Ks and Tm (Table 1), a relationship between the side-group stereochemistry and IC50 was noticeable for 8f and 5a. Therefore, structural information on the inhibitory complexes was obtained to identify stereo configuration preferably selected by CYP3A4.
5a-b binding modes and configuration –
Crystal structures of CYP3A4 bound to 5a and 5b were solved to 2.55 and 2.30 Å resolution, respectively (Table S1). Assignment of stereo configuration was based on visual inspection and refinement statistics, where lower R/Rfree-factors indicate better agreement between the model and observed X-ray diffraction data. Similar to 8f (rac,S), whose S/S stereoisomer co-crystallized with CYP3A4 [15], the S-configuration of R1-N-phenyl was found to provide a better fit for both 5a and 5b. The 5b R2-naphthalene was also in S-configuration. Thus, for this particular scaffold, the S/S side-group conformation appears to promote association to CYP3A4.
Positioning of 5a-b relative to the central I-helix and electron density maps is shown in Figure 3D,E. Both compounds bind in a traditional orientation, with R1 inserted into a hydrophobic pocket adjacent to the I-helix (P1 site) and R2 near the heme-ligating pyridine (P2 site). 5a-b also establish an H-bond with the active site S119 and largely displace the I-helix (by 1.5 and 1.9 Å, respectively). As shown in Figure 3F,G, 5a (S,R) orients similarly to 8f (S,S) (6BDM structure), whereas 5b (S,S) adopts a different conformation to accommodate and optimally place the bulky R2-naphthalene. As a result, the terminal tert-butyloxycarbonyl (Boc)-group of 5b points in opposite direction.
The outlined differences are better seen in Figure 3H,I, where orientations of 5a and 5b are directly compared. One striking feature is the coinciding location of the aromatic side-groups, leading to an equal overlap between the R1/F304 and R2/pyridine rings (Table 2). Even so, 5b ligates to the heme stronger (forms the shortest Fe-N bond), establishes more extensive hydrophobic interactions at P2 site through the bulkier R2-naphtalene, and inserts R1-phenyl deeper into the P1 pocket. This explains why this analogue inhibits CYP3A4 more potently than 5a.
Table 2.
Structural features of the CYP3A4-inhibitor complexes
| compound | Fe-N bond |
pyridine ring rotation (°)b |
I-helix displacement (Å)c |
H-bond with Ser119 (Å)d |
pyridine-R2 ring angle and overlap |
Phe304-R1 ring angle and overlap |
F-G disorder |
Boc-group conformation/contacts |
|
|---|---|---|---|---|---|---|---|---|---|
| distance (Å) | angle (°)a | ||||||||
| 5a (S,R)e | 2.34 | 12 | 37 | 1.54–1.49 | 2.68 | 55°; half | parallel; half | 210–212 | disordered |
| 5b (S,S)e | 2.20 | 2 | 30 | 1.89–1.85 | 2.85 | 56°; partial | 20°; half | 210–212 | disordered |
| 7a (S,R) | 2.25 | 8 | 25 | 1.77–1.52 | 2.85 | −38°; half | parallel; full | 198–217 | disordered |
| 7b (R,S) | 2.40 | 3 | 28 | 1.77–1.97 | 3.31 | 44°; half | 42°; half | 210–212 | traceable; 105–108, 120 |
|
7c (S,R) molecule A |
2.82 | 0 | 15 | 2.18–2.25 | - | −85°; nonef | 52°; partialf | none | ordered; 213, 215, 371, 482 |
| 7d (R,S) | 2.37 | 3 | 35 | 1.55–1.25 | 2.32 | 35°; partial | 45°; partial | 210–213 | traceable; 106, 108, 215, 374 |
| 9a (S,R)e | 2.40 | 10 | 32 | 1.20–1.93 | 3.28 | 25°; half | 20°; half | 198–217 | ordered; 108, 220 |
|
9b (S,S)e molecule A |
2.30 | 10 | 35 | 2.03–1.83 | 2.57 | 25°; full | 25°; partial | 204–217 | traceable, 105–108, 374 |
Deviation from perpendicularity.
Angle between the planes passing through the pyridine ring and the NB-ND heme atoms
Distance between Cα-atoms of Phe304 and Ala305 in the inhibitor-bound and ligand-free CYP3A4 (PDB ID 5VCC).
Hydrogen bond length between inhibitor’s carbonyl oxygen atom and Ser119 hydroxyl group.
These setereoisomers selectively co-crystallized with CYP3A4.
In 7c, R1 and R2 side groups are in reverse orientation and placed near the heme-ligating pyridine and Phe304, respectively.
Series III Modification (7a-d)
Spectral and biochemical properties –
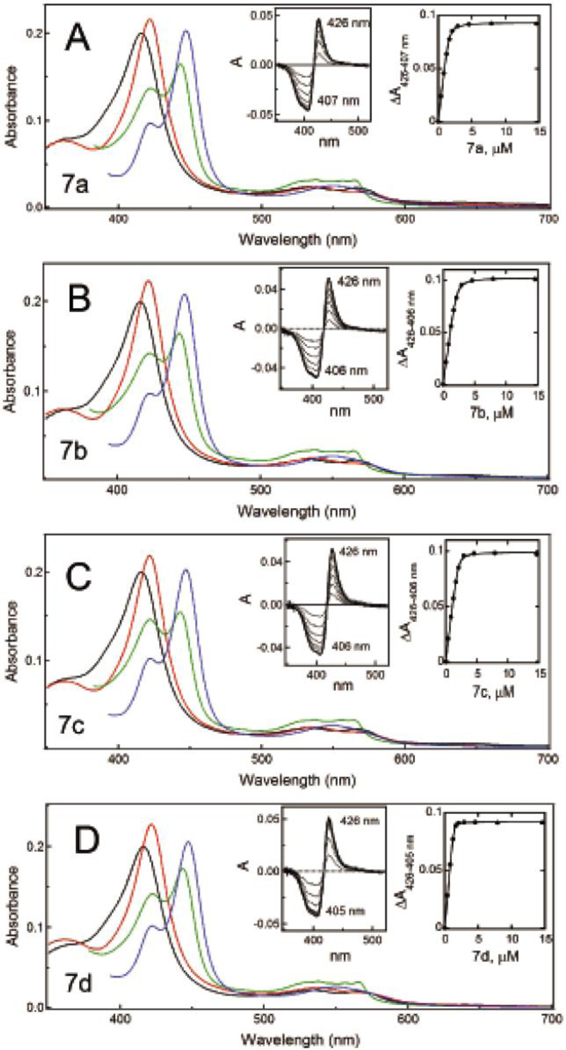
The λmax and ΔAmax values derived for the 7a-d subseries were similar (Figure 4A-D; Table 1). The only spectral difference was the lower amplitude of the 443 nm peak for the ferrous CYP3A4-7c complex. A pairwise comparison shows that 7a-b have comparable binding affinity (0.062–0.085 μM) and association rate (4.1–6.8 s−1), and their complexes with CYP3A4 are equally stable (ΔTm of 3.8–4.1 °C) and reduced with a similar rate (0.017–0.020 s−1; Table 1). This correlates well with a small difference in the IC50 values: 0.173 and 0.102 μM for 7a and 7b, respectively.
Figure 4.
A-D, Spectral changes in CYP3A4 induced by 7a-d, respectively. Absorbance spectra of oxidized ligand-free and ligand-bound CYP3A4 are in black and red, respectively. Spectra of ferrous ligand-bound CYP3A4 and its CO-adduct are in green and blue, respectively. Left insets are difference spectra recorded during equilibrium titrations. Right insets are titration plots with quadratic fittings. Spectral dissociation constants (Ks) derived from titration plots are listed in Table 1.
For the naphthalene-containing 7c-d, kfast and ΔTm were also similar and the highest overall (9.0–10.2 s−1 and 4.5 °C, respectively). Conversely, the heme reduction rate was one of the lowest (0.016–0.027 s−1). For comparison, kETfast for the ligand-free enzyme is >100-fold higher (4.6 s−1; Figure S3). Thus, ligation of 7c-d and other analogues drastically decreases accessibility of the active site, even for small molecules such as sodium dithionite. Importantly, in the subseries, 7d had the highest binding affinity and inhibitory potency (0.017 μM and 0.075 μM, respectively), which were 3-to-5-fold lower for 7c (Table 1). This further confirms that, for the series III scaffold, the S/R configuration is less favorable for association and inhibition of CYP3A4.
Crystal structures of CYP3A4 complexed with 7a-d were solved to 2.60–2.75 Å resolution (Tables S1 and S2) and will also be compared in a pairwise fashion.
7a-b binding modes –
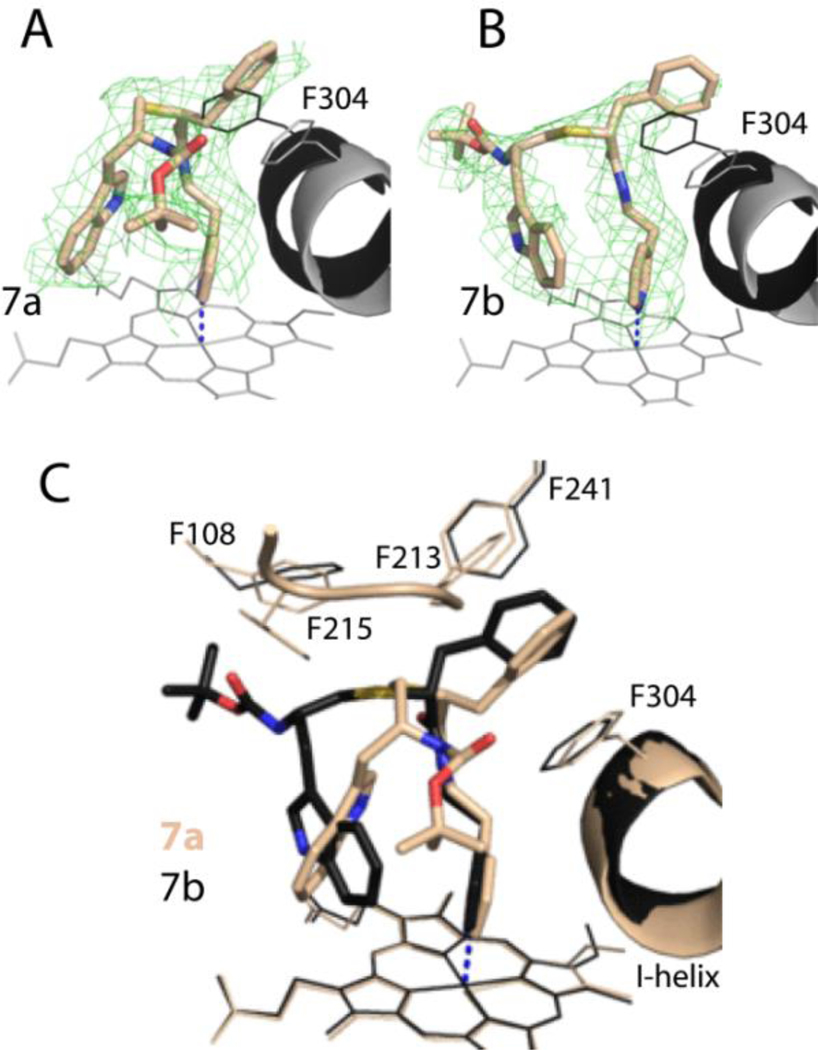
Both 7a and 7b bind to CYP3A4 in a traditional orientation and trigger a large distortion in the I-helix (1.8–2.0 Å; Figure 5 A,B). Because of distinct backbone curvatures, the Boc-groups point in opposite directions (Figure 5C). Structure comparison shows that 7a forms shorter Fe-N and O21-S119 bonds, has larger aromatic overlap between the parallel stacked R1-phenyl and F304 rings, and its F’-G’ fragment and end-group are more ordered, enabling formation of multiple van der Waals contacts (Table 2). Nonetheless, 7b has a higher inhibitory potency for CYP3A4 (Table 1), which could be explained by its distinct, less compact fold. Unlike the S/R conformer, 7b partially occupies the substrate binding channel and, hence, could more efficiently block the substrate access to the catalytic center.
Figure 5.
A and B, The binding mode of 7a and 7b. The adjacent I-helix and F304 in the inhibitory complexes and water-bound CYP3A4 (4I3Q structure) are shown in black and gray, respectively. Polder omit maps contoured at 3σ level are shown as green mesh.
C, Superposition of the 7a/b-bound CYP3A4 (6UNH and 6UNI structures, respectively.
7c-d binding modes –
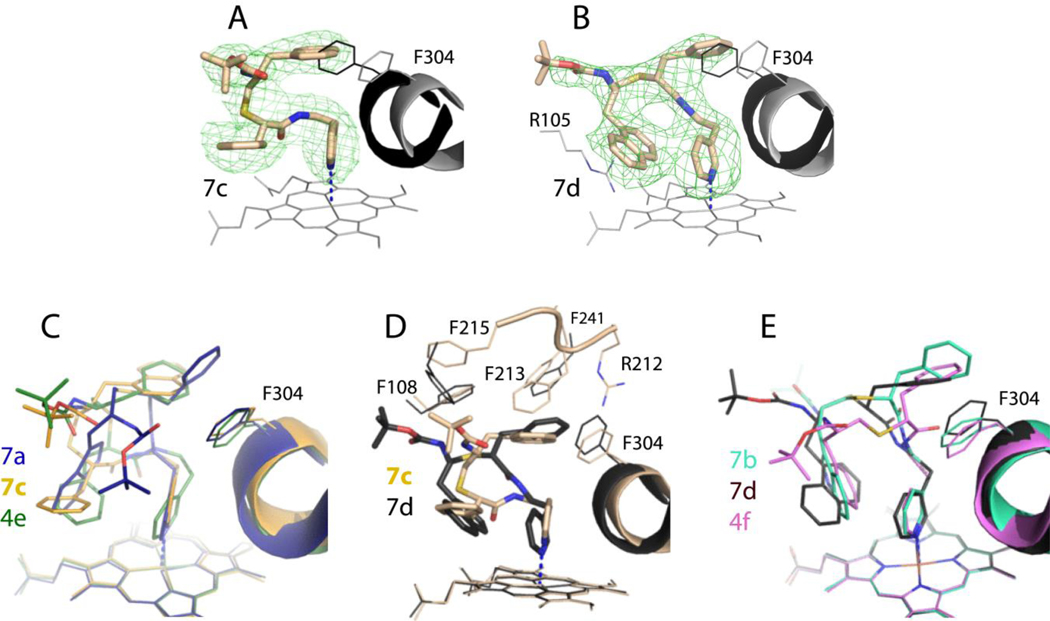
The CYP3A4-7c complex was crystallized in the C2 space group, with two molecules per asymmetric unit. The better defined molecule A was used for comparative analysis outlined below. One characteristic feature of 7c is the reverse side-group orientation: R1-phenyl is placed at P2 site perpendicular to the heme-ligating pyridine and parallel to the cofactor, whereas R2-naphthalene is in the P1 pocket (Figure 6A). This is the third incident when the ritonavir-like compound ligates to CYP3A4 in such a distinct conformation. Two previous cases involved series III analogs, 4a and 4e (6DA2 and 6DAB structures, respectively), whose R1/R2-phenyls were also in S/R configuration [16], Evidently, the 7c conformation is unfavorable because it markedly weakens the Fe-N bond, leads to an extreme I-helix distortion, prevents H-bonding to S119, and minimizes/eliminates aromatic overlap mediated by the side-groups (Table 2).
Figure 6.
A and B, The binding mode of 7c and 7d, respectively. The adjacent I-helix and F304 in the inhibitory complexes and water-bound CYP3A4 (4I3Q structure) are shown in black and gray, respectively. Polder omit maps contoured at 3σ level are shown as green mesh. The CYP3A4-7c complex crystallizes in a distinct space group (Table S2) with two molecules per asymmetric unit; the better-defined molecule A was used for structural comparison.
C, Superposition of the 7a-, 7c- and 4e-bound structures of CYP3A4 (6UNH, 6UNJ and 6DAB, respectively). 4e is a series III inhibitor with a similar backbone and R1/R2-phenyls in S/R configuration.
D, Superposition of the 7c/d-bound CYP3A4.
E, Superposition of the 7b-, 7d- and 4f-bound structures of CYP3A4 (6UNI, 6UNK and 6DAC, respectively). 4f is a series III inhibitor with a similar backbone and R1/R2-phenyls in R/S configuration.
To better understand the impact of R2 substitution, we compared the binding modes of 7c, 7a and 4e stereoisomers, whose R2 functionality is represented by naphthalene, indole and phenyl, respectively. As seen in Figure 6C, 7a changes the side-group tilt angle and depth of immersion to overcome the disadvantage of the S/R configuration. It is possible that the higher polarity of the indole ring precludes its embedment into the highly hydrophobic P1 pocket. However, that all three S/R analogues have similar Ks (0.052, 0.062 and 0.042 μM for 7c, 7a and 4e [16], respectively) suggests that the binding affinity is not significantly affected by changes in R2 hydrophobicity and/or side-group placement. The IC50 value, however, varied more dramatically and decreased by 2-fold upon R2-phenyl-to-naphthalene substitution (0.83 vs. 0.36 μM for 4e and 7c, respectively), and by another 2-fold for the R2-indole containing 7a (0.17 μM). Thus, hydrophobic and aromatic interactions mediated by R2 at P2 site are important and largely affect the inhibitory potency for CYP3A4.
Figure 7.
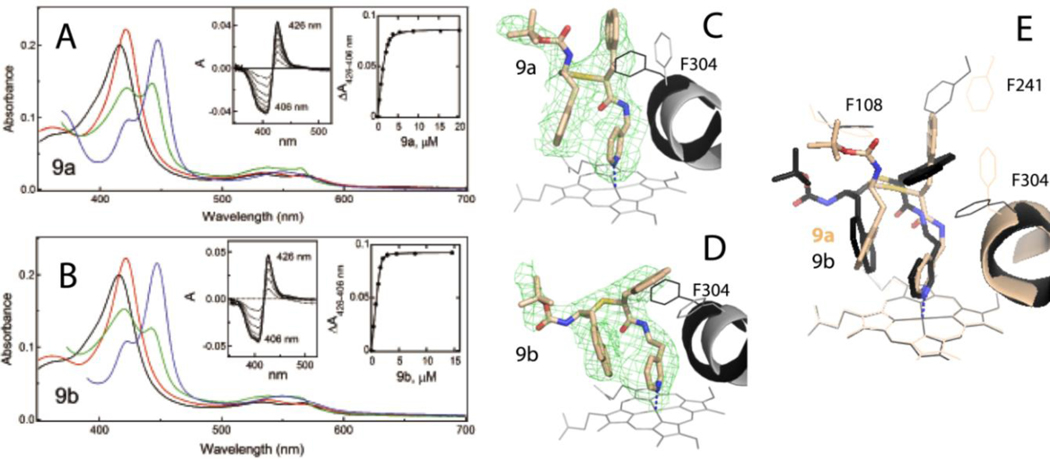
A and B, Spectral changes in CYP3A4 induced by 9a-d, respectively. Absorbance spectra of oxidized ligand-free and ligand-bound CYP3A4 are in black and red, respectively. Spectra of ferrous ligand-bound CYP3A4 and its CO-adduct are in green and blue, respectively. Left insets are difference spectra recorded during equilibrium titrations. Right insets are titration plots with quadratic fittings. Spectral dissociation constants (Ks) derived from titration plots are listed in Table 1.
C and D, The binding mode of 9a and 9b (PDB ID 6UNL and 6UNM, respectively). The adjacent I-helix and F304 in the inhibitory complexes and water-bound CYP3A4 (4I3Q structure) are shown in gray and black, respectively. Polder omit maps contoured at 3 σ level are shown as green mesh. The CYP3A4-9b complex was crystallized in a distinct space group (Table S2) with two molecules per asymmetric unit; the better-defined molecule A was used for structural comparison.
E, Superposition of the 9a/b-bound CYP3A4.
Unlike 7c, its enantiomer 7d binds to CYP3A4 in a traditional orientation that enables strong heme ligation and H-bonding to S119 (Figure 6B; Table 2). The 7d R2-naphthalene is placed considerably closer to the heme than R1-phenyl of 7c (3.5 Å vs. 5.0 Å, respectively) and with a larger tilt angle, which not only increases an area of aromatic overlap but also enables π-cation interactions with the nearby R105 guanidine (Figure 6B). One advantage of 7c is the lower R2 position, preventing steric clashing with the adjoining F’-G’-loop (residues 212–215). As a result, the latter fragment stays in place and provides stabilizing hydrophobic and van der Waals contacts in the CYP3A4-7c complex but becomes partially disordered upon binding of 7d (Figure 6D). It is possible though that this conformational distinction arises from different crystal packing.
It was also of interest to compare orientations of 7d, 7b and 4f stereoisomers, differing only in the R2 group (naphthalene, indole and phenyl, respectively). As seen in Figure 6E, the R2 moieties occupy virtually the same spot at P2 site, which is achieved through adjustments in the backbone curvature and R1-F304 interplay. Despite this conformational similarity, modification of R2 had a larger impact on the binding and inhibitory strength than for respective S/R analogues. The phenyl-to-indole substitution in R2 led to a 2-fold increase in Ks (0.045 vs. 0.085 μM for 4f and 7b, respectively), whereas the binding affinity of naphthalene-containing 7d was 3-to-5-fold lower (0.017 μM). A more drastic improvement was observed in IC50, which decreased from 0.68 μM for 4f to 0.102 and 0.075 μM for 7b and 7d, respectively. This further supports the notion that the potency of ritonavir-like inhibitors largely depends on the R2 side-group functionality.
Analogues with naphthalene at R1 and R2 positions
Since placement of naphthalene at R2 position markedly lowered IC50 for 5b and 7d, we next tested if substitution of both side-groups with naphthalene could further improve the inhibitory strength. For this purpose, two analogues were synthesized with either pyridyl-methyl or pyridyl-ethyl linker, for length comparison, and racemic R1/R2-naphthalene, for group size investigation: 9a and 9b, respectively (Figure 2).
Spectral and biochemical properties –
Absorbance changes induced by 9a-b and titration plots are shown in Figure 7A,B. As evident from the lowest λmax and ΔAmax values (Table 1), 9a triggers the least prominent perturbations in the Soret band upon ligation. The common features of 9a-b were the lowest 443 nm absorption of the ferrous ligand-bound forms (compare green spectra in Figures 3A-C, 4, and 7A-B) and slow association rates (1.3–3.9 s−1). Both analogues had a similar stabilizing effect (ΔTm of 4.0–4.1 °C) and inhibitory potency (IC50 of ~0.22–0.24 μM) but largely differed in the binding affinity for CYP3A4: Ks of 0.190 and 0.037 μM for 9a and 9b, respectively. Thus, simultaneous placement of naphthalene at R1 and R2 positions does not improve the inhibitory potency, whereas elongation of the pyridyl spacer enhances the binding affinity regardless of the side-group chemical nature.
9a-b binding modes –
Crystal structures of the 9a/b-CYP3A4 complexes were determined to 2.55–2.83 Å resolution (Table S2). Similar to the 7c-bound form, CYP3A4-9b crystallized in the C2 space group, with two molecules per asymmetric unit. The better defined molecule A was used for comparative analysis, which revealed that 9a and 9b were in S/R and S/S configuration, respectively. The ligand orientation and electron density maps can be seen in Figure 7C,D. Both analogues ligate to the heme in a traditional orientation, with the R2-naphthalenes occupying the same spot near the pyridine ring but with a different tilt angle. In 9a, the shorter pyridyl-linker disallows insertion of the R1-naphthalene into the P1 pocket, owing to which this moiety points upward toward the roof of the active site, pushing F241 aside. In contrast, the elongated 9b adopts more relaxed conformation, with R1 fully immersed into the P1 site. Nonetheless, both R1-naphthalenes are near parallel to the F304 ring, which flips to maximize aromatic overlap (Figure 7E). Structure comparison shows that 9b ligates to the heme stronger, forms a shorter H-bond with S119, and has a larger R2/pyridine overlap which, collectively, could improve the binding affinity and inhibitory strength. That 9a-b had similar IC50 (Table 1) could be due to utilization of racemic mixtures in the functional assays.
Comparison of 7d and ritonavir
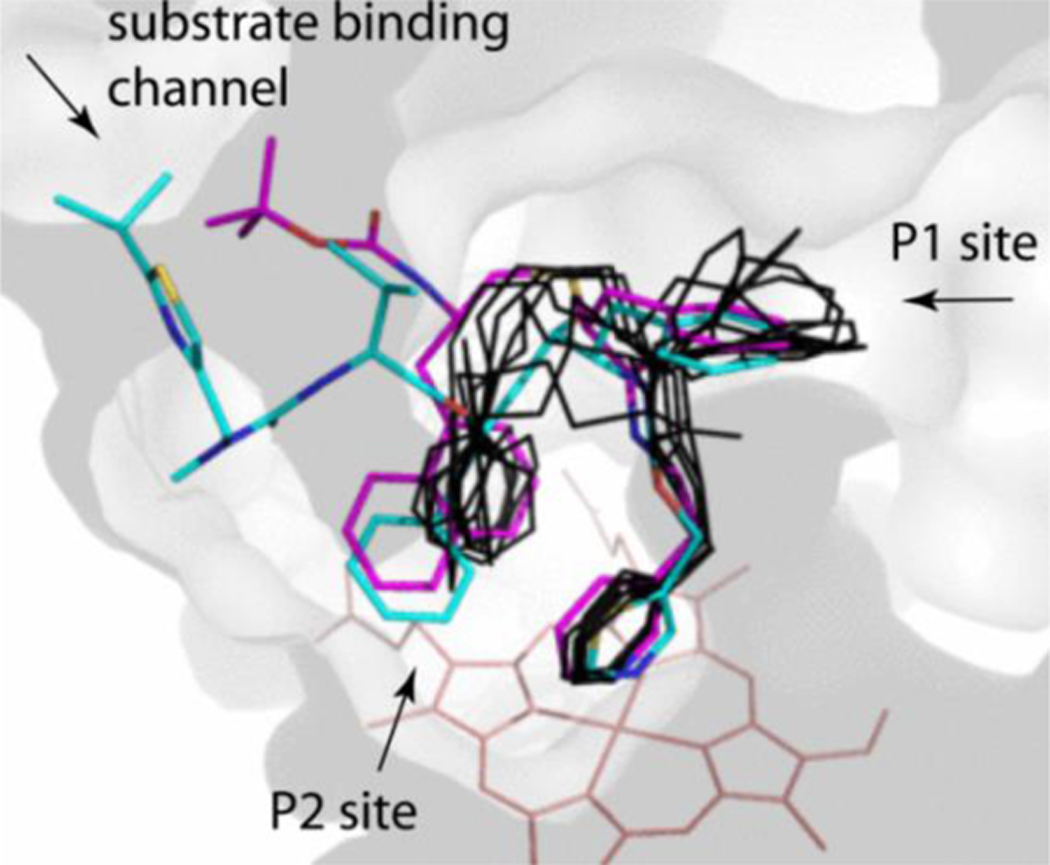
Series IV had three lead compounds, 5a-b and 7d, whose IC50 was in the low submicromolar range (<0.1μM). For comparison, under identical experimental conditions, ritonavir inhibits CYP3A4 with IC50 of 0.13 μM [16]. Besides being a better inhibitor, 7d was also a high affinity ligand for CYP3A4: Ks 0.017 vs. 0.019 μM for ritonavir [16]. Moreover, among the high affinity/potency inhibitors that were designed so far, only 7d orients most similarly to ritonavir (Figure 8). The R1-phenyls of both compounds penetrate the P1 pocket equally as deep and nearly coincide, whereas the 7d R2-naphthalene trails ritonavir’s R2-phenyl but has a larger tilt angle (25° difference vs. 40–80° for other analogues). Having two conjoined phenyl rings, the naphthalene is poised to form stronger aromatic interactions with the heme and pyridine rings and, unlike ritonavir’s R2-phenyl, can establish π-cation interactions with the R105 guanidine. These additional protein-ligand contacts are important because they not only strengthen and stabilize the inhibitory complex but also decrease the ligand mobility and allow a more efficient blockage of the active site. That 7d is structurally simpler and easier to synthesize than ritonavir but inhibits CYP3A4 twice as strongly gives grounds for optimism that more potent and less expensive pharmacoenhancers could be developed.
Figure 8.
Relative positioning of 7d (in magenta), ritonavir (in cyan; 5VCO structure) and other high affinity/inhibitory potency analogues (8f, 5a-b, 7b and 4f-h; in black), whose end-groups were removed for clarity of presentation. Location of the P1 and P2 sites and the entrance to the substrate binding channel are indicated.
CONCLUDING SUMMARY
This work was a continuation of our studies on ritonavir-like inhibitors of CYP3A4, aimed to determine the relative impact of the side-group size and hydrophobicity on the binding and inhibitory strength. Two different scaffolds were used to design eight series IV inhibitors with phenyl or naphthalene at R1 position and indole or naphthalene as R2. Interaction of the analogues with CYP3A4 was spectrally, biochemically and structurally characterized and, when appropriate, comparisons with the previously reported compounds were conducted to better understand structure-activity relationships.
In agreement with the prior suggestions, our results demonstrate that an increase in size and hydrophobicity/aromaticity of the R2-substituent markedly increases the inhibitory potential of ritonavir-like molecules, with IC50 decreasing from mid- to low-submicromolar range upon phenyl>indole>naphthalene substitution. In contrast, simultaneous placement of naphthalene at R1 and R2 position improves the binding but not inhibitory strength.
For the series IV compounds, stereochemistry became a more important contributing factor, as the bulky side-groups limit the ability to adjust and optimize interactions within the active site. Usage of racemic mixtures complicated experimental data interpretation but, at the same time, provided valuable insights into stereoselectivity of ligand binding. The relationship between R1/R2-configuration and preferential binding to CYP3A4 was not straightforward and depended on both the backbone spacing and side-group functionalities and interplay. The S/S and R/S configurations seem to be more preferable for the association to CYP3A4, as the S/R conformers tend to ligate with the unfavorable reverse side-group orientation.
Finally, for the first time, this study demonstrated that less structurally complex inhibitors that are more potent than ritonavir could be rationally developed. Among three lead compounds, 5a-b and 7d, the latter had the highest affinity for CYP3A4 and, thus, it could be used as a template for further optimization.
Supplementary Material
ACKNOWLEDGEMENTS
This work involves research carried out at the Stanford Synchrotron Radiation Lightsource and the Advanced Light Source. Use of the Stanford Synchrotron Radiation Lightsource, SLAC National Accelerator Laboratory, is supported by the U.S. Department of Energy, Office of Science, Office of Basic Energy Sciences under Contract No. DE-AC02-76SF00515. The SSRL Structural Molecular Biology Program is supported by the DOE Office of Biological and Environmental Research, and by the National Institutes of Health, National Institute of General Medical Sciences (including P41GM103393). The Advanced Light Source is supported by the Director, Office of Science, Office of Basic Energy Sciences, of the U.S. Department of Energy under Contract No. DE-AC02-05CH11231.
FUNDING
This work was supported by the National Institutes of Health Grant ES025767.
ABBREVIATIONS
- CYP3A4
cytochrome P450 3A4
- BFC
7-benzyloxy-4-(trifluoromethyl)coumarin
- Boc
tert-butyloxycarbonyl
Footnotes
SUPPLEMENTARY MATERIAL
Difference spectra for the ligand-free and ligand bound CYP3A4, kinetic traces and rate constants for the CYP3A4-ligand binding and reduction kinetics, X-ray data collection and refinement statistics, high resolution mass spectrometry data, 1H NMR spectra, and UPLC-MS chromatograms.
The authors declare no competing financial interest.
Declaration of interests
The authors declare that they have no known competing financial interests or personal relationships that could have appeared to influence the work reported in this paper.
Publisher's Disclaimer: This is a PDF file of an unedited manuscript that has been accepted for publication. As a service to our customers we are providing this early version of the manuscript. The manuscript will undergo copyediting, typesetting, and review of the resulting proof before it is published in its final form. Please note that during the production process errors may be discovered which could affect the content, and all legal disclaimers that apply to the journal pertain.
REFERENCES
- [1].Zanger UM, Schwab M, Cytochrome P450 enzymes in drug metabolism: regulation of gene expression, enzyme activities, and impact of genetic variation, Pharmacol. Ther, 138 (2013) 103–141. [DOI] [PubMed] [Google Scholar]
- [2].Zhou SF, Drugs behave as substrates, inhibitors and inducers of human cytochrome P450 3A4, Curr. Drug Metab, 9 (2008) 310–322. [DOI] [PubMed] [Google Scholar]
- [3].Xu L, Desai MC, Pharmacokinetic enhancers for HIV drugs, Curr. Opin. Investig. Drugs, 10 (2009) 775–786. [PubMed] [Google Scholar]
- [4].Chapman SA, Lake KD, Solbrack DF, Milfred SK, Marshall PS, Kamps MA, Considerations for using ketoconazole in solid organ transplant recipients receiving cyclosporine immunosuppression, J. Transpl. Coord, 6 (1996) 148–154. [DOI] [PubMed] [Google Scholar]
- [5].Kempf DJ, Marsh KC, Denissen JF, McDonald E, Vasavanonda S, Flentge CA, Green BE, Fino L, Park CH, Kong XP, et al. , ABT-538 is a potent inhibitor of human immunodeficiency virus protease and has high oral bioavailability in humans, Proc. Natl. Acad. Sci. U S A, 92 (1995) 2484–2488. [DOI] [PMC free article] [PubMed] [Google Scholar]
- [6].Brayer SW, Reddy KR, Ritonavir-boosted protease inhibitor based therapy: a new strategy in chronic hepatitis C therapy, Expert Rev. Gastroenterol. Hepatol, 9 (2015) 547–558. [DOI] [PubMed] [Google Scholar]
- [7].Ke AB, Zamek-Gliszczynski MJ, Higgins JW, Hall SD, Itraconazole and clarithromycin as ketoconazole alternatives for clinical CYP3A inhibition studies, Clin. Pharmacol. Ther, 95 (2014) 473–476. [DOI] [PubMed] [Google Scholar]
- [8].Greenblatt DJ, Harmatz JS, Ritonavir is the best alternative to ketoconazole as an index inhibitor of cytochrome P450–3A in drug-drug interaction studies, Br. J. Clin. Pharmacol, 80 (2015) 342–350. [DOI] [PMC free article] [PubMed] [Google Scholar]
- [9].Sevrioukova IF, Poulos TL, Interaction of human cytochrome P4503A4 with ritonavir analogs, Arch. Biochem. Biophys, 520 (2012) 108–116. [DOI] [PMC free article] [PubMed] [Google Scholar]
- [10].Sevrioukova IF, Poulos TL, Pyridine-substituted desoxyritonavir is a more potent cytochrome P450 3A4 inhibitor than ritonavir, J. Med. Chem, 56 (2013) 3733–3741. [DOI] [PMC free article] [PubMed] [Google Scholar]
- [11].Sevrioukova IF, Poulos TL, Dissecting cytochrome P450 3A4-ligand interactions using ritonavir analogues, Biochemistry, 52 (2013) 4474–4481. [DOI] [PubMed] [Google Scholar]
- [12].Sevrioukova F, Poulos TL, Structure and mechanism of the complex between cytochrome P4503A4 and ritonavir, Proc. Natl. Acad. Sci. U S A, 107 (2010) 18422–18427. [DOI] [PMC free article] [PubMed] [Google Scholar]
- [13].Sevrioukova IF, Poulos TL, Ritonavir analogues as a probe for deciphering the cytochrome P450 3A4 inhibitory mechanism, Curr. Top. Med. Chem, 14 (2014) 1348–1355. [DOI] [PMC free article] [PubMed] [Google Scholar]
- [14].Kaur P, Chamberlin AR, Poulos TL, Sevrioukova IF, Structure-based inhibitor design for evaluation of a CYP3A4 pharmacophore model, J. Med. Chem, 59 (2016) 4210–4220. [DOI] [PMC free article] [PubMed] [Google Scholar]
- [15].Samuels ER, Sevrioukova IF, Inhibition of human CYP3A4 by rationally designed ritonavir-like compounds: Impact and interplay of the side group functionalities, Mol. Pharm, 15 (2018) 279–288. [DOI] [PMC free article] [PubMed] [Google Scholar]
- [16].Samuels ER, Sevrioukova I, Structure-activity relationships of rationally designed ritonavir analogs: Impact of side-group stereochemistry, head-group spacing, and backbone composition on the interaction with CYP3A4, Biochemistry, 58 (2019) 2077–2087. [DOI] [PMC free article] [PubMed] [Google Scholar]
- [17].Chong HS, Song HA, Dadwal M, Sun X, Sin I, Chen Y, Efficient synthesis of functionalized aziridinium salts, J. Org. Chem, 75 (2010) 219–221. [DOI] [PubMed] [Google Scholar]
- [18].Samuels E, Sevrioukova I, Direct synthesis of alpha-thio aromatic acids from aromatic amino acids, Tetrahedron lett, 59 (2018) 1140–1142. [DOI] [PMC free article] [PubMed] [Google Scholar]
- [19].Sevrioukova IF, High-level production and properties of the cysteine-depleted cytochrome P450 3A4, Biochemistry, 56 (2017) 3058–3067. [DOI] [PMC free article] [PubMed] [Google Scholar]
- [20].Karplus PA, Diederichs K, Linking crystallographic model and data quality, Science, 336 (2012) 1030–1033. [DOI] [PMC free article] [PubMed] [Google Scholar]
- [21].McCoy AJ, Grosse-Kunstleve RW, Adams PD, Winn MD, Storoni LC, Read RJ, Phaser crystallographic software J. Appl. Crystallogr, 40 (2007) 658–674. [DOI] [PMC free article] [PubMed] [Google Scholar]
- [22].Adams PD, Afonine PV, Bunkoczi G, Chen VB, Davis IW, Echols N, Headd JJ, Hung LW, Kapral GJ, Grosse-Kunstleve RW, McCoy AJ, Moriarty NW, Oeffner R, Read RJ, Richardson DC, Richardson JS, Terwilliger TC, Zwart PH, PHENIX: a comprehensive Python-based system for macromolecular structure solution, Acta Crystallogr. Section D, 66 (2010) 213–321. [DOI] [PMC free article] [PubMed] [Google Scholar]
- [23].Emsley P, Lohkamp B, Scott WG, Cowtan K, Features and development of Coot, Acta Crystallogr. Section D, 66 (2010) 486–501. [DOI] [PMC free article] [PubMed] [Google Scholar]
- [24].Koudriakova T, Iatsimirskaia E, Utkin I, Gangl E, Vouros P, Storozhuk E, Orza D, Marinina J, Gerber N, Metabolism of the human immunodeficiency virus protease inhibitors indinavir and ritonavir by human intestinal microsomes and expressed cytochrome P4503A4/3A5: mechanism-based inactivation of cytochrome P4503A by ritonavir, Drug Metab. Dispos, 26 (1998) 552–561. [PubMed] [Google Scholar]
- [25].von Moltke LL, Durol AL, Duan SX, Greenblatt DJ, Potent mechanism-based inhibition of human CYP3A in vitro by amprenavir and ritonavir: comparison with ketoconazole, Eur. J. Clin. Pharmacol, 56 (2000) 259–261. [DOI] [PubMed] [Google Scholar]
- [26].Obach RS, Walsky RL, Venkatakrishnan K, Mechanism-based inactivation of human cytochrome p450 enzymes and the prediction of drug-drug interactions, Drug Metab. Dispos, 35 (2007) 246–255. [DOI] [PubMed] [Google Scholar]
- [27].Rock BM, Hengel SM, Rock DA, Wienkers LC, Kunze KL, Characterization of ritonavir-mediated inactivation of cytochrome P450 3A4, Mol. Pharmacol, 86 (2014) 665–674. [DOI] [PubMed] [Google Scholar]
Associated Data
This section collects any data citations, data availability statements, or supplementary materials included in this article.


