

Abstract
Here we characterize and summarize the pharmacokinetic changes for metabolized drugs when drug-drug interactions and pharmacogenomic variance is observed. Following multiple dosing to steady-state, oral systemic concentration-time curves appear to follow a one-compartment body model, with a shorter rate limiting half-life, often significantly shorter than the single dose terminal half-life. This simplified disposition model at steady-state allows comparisons of measurable parameters (i.e., area under the curve, half-life, maximum concentration and time to maximum concentration) following drug interaction or pharmacogenomic variant studies to be utilized to characterize whether a drug is low versus high hepatic extraction ratio, even without intravenous dosing. The characteristics of drugs based on the ratios of area under the curve, maximum concentration and half-life are identified with recognition that volume of distribution is essentially unchanged for drug interaction and pharmacogenomic variant studies where only metabolic outcomes are changed and transporters are not significantly involved. Comparison of maximum concentration changes following single dose interaction and pharmacogenomic variance studies may also identify the significance of intestinal first pass changes. The irrelevance of protein binding changes on pharmacodynamic outcomes following oral and intravenous dosing of low hepatic extraction ratio drugs, versus its relevance for high hepatic extraction ratio drugs is re-emphasized.
Keywords: Drug-drug interactions, pharmacogenomics, area under the curve, operational half-lives, maximum systemic concentrations
Tribute to Dr. Panos Macheras
Recently we derived the theoretical basis for the extended clearance model of organ elimination following both oral and intravenous dosing and critically analyzed the approaches previously taken [1]. Here in this special issue of the Journal honoring our friend and colleague, Professor Panos Macheras, we extend these analyses to understand and emphasize specific applications of these concepts, reflecting the approach taken by Professor Macheras in applying complex pharmacokinetic concepts and using them to elucidate the time course of various process in vitro and in vivo.
The Importance of Changes or Lack of Change in Volume of Distribution
As our laboratory has pointed out [1, 2], drug-drug interactions and changes in disposition related to pharmacogenomic (PG) variance can potentially lead to changes in volume of distribution when transporters more than minimally affect drug disposition. Volume of distribution changes will not impede the ability to accurately predict changes in exposure (AUC, area under the systemic concentration-time curve) when transporters are involved. However, if both clearance and volume of distribution change as a result of transporters being significantly involved in a drug-drug interaction or as a result of a PG variance, it will be difficult to predict and understand the time-course of drug concentrations resulting from the modification, since mean residence time (MRT ) is directly related to volume of distribution (Vss, volume of distribution steady-state) and inversely related to clearance (CL), as shown in Eq. 1 [3].
| (1) |
We use MRT here rather than half-life to obviate the necessity of discussing multicompartment systems.
Single Dose Terminal Half-life vs. Operational Half-life at Steady State
It is important to note that many interactions are clinically relevant for drugs upon multiple dosing at steady-state, and as pointed out by Sahin and Benet [4], the elimination half-life of this steady-state disposition model will be less (and often markedly less) than the terminal half-life observed following a single dose. This is because at steady-state, distribution has less impact on the concentration time-course, and therefore a simple one-compartment disposition model can be used.
We illustrate this difference in single vs. multiple dosing half-life in Fig. 1, where Fig. 1A depicts the logarithmic concentration-time curve following a single 100 mg oral dose of a low hepatic extraction drug with the following two compartment body model parameters: volume of the central compartment (V1) is 100 L, the rate constant of elimination from the central compartment (k10 ) is 0.1 hr−1, the distribution rate constants into and out of the peripheral compartment (k12 and k21 ) are 0.06 hr−1and 0.08 hr−1, respectively (resulting in two-compartment exponential functions of λ1 = 0.2 hr−1 and λ2 = 0.04 hr−1), an hepatic clearance of 10 L/hr, a first order absorption rate constant (ka) of 1.0 hr−1 and a bioavailability (F ) of 0.8 when FA·FG (as defined below) is 0.9. The equation describing this single oral dose concentration-time course is:
| (2) |
And the resulting single dose terminal half-life is 17.3 hr. Above the single dose curve in Fig. 1A, we depict the concentration-time curve at steady-state where the 100 mg oral dose is given every 12 hr. It is obvious in Fig. 1A that the concentration-time curves during a dosing interval at steady-state approximate a one-compartment body model, since with multiple dosing and accumulation the peripheral compartment becomes fuller and less distribution is evident, with a half-life that appears to be between 8.5 and 9 hr. As pointed out by Sahin and Benet [4], it is the multiple dosing operational half-life that predicts accumulation, with no evidence that the 17.3 hr terminal half-life is relevant.
Fig. 1.
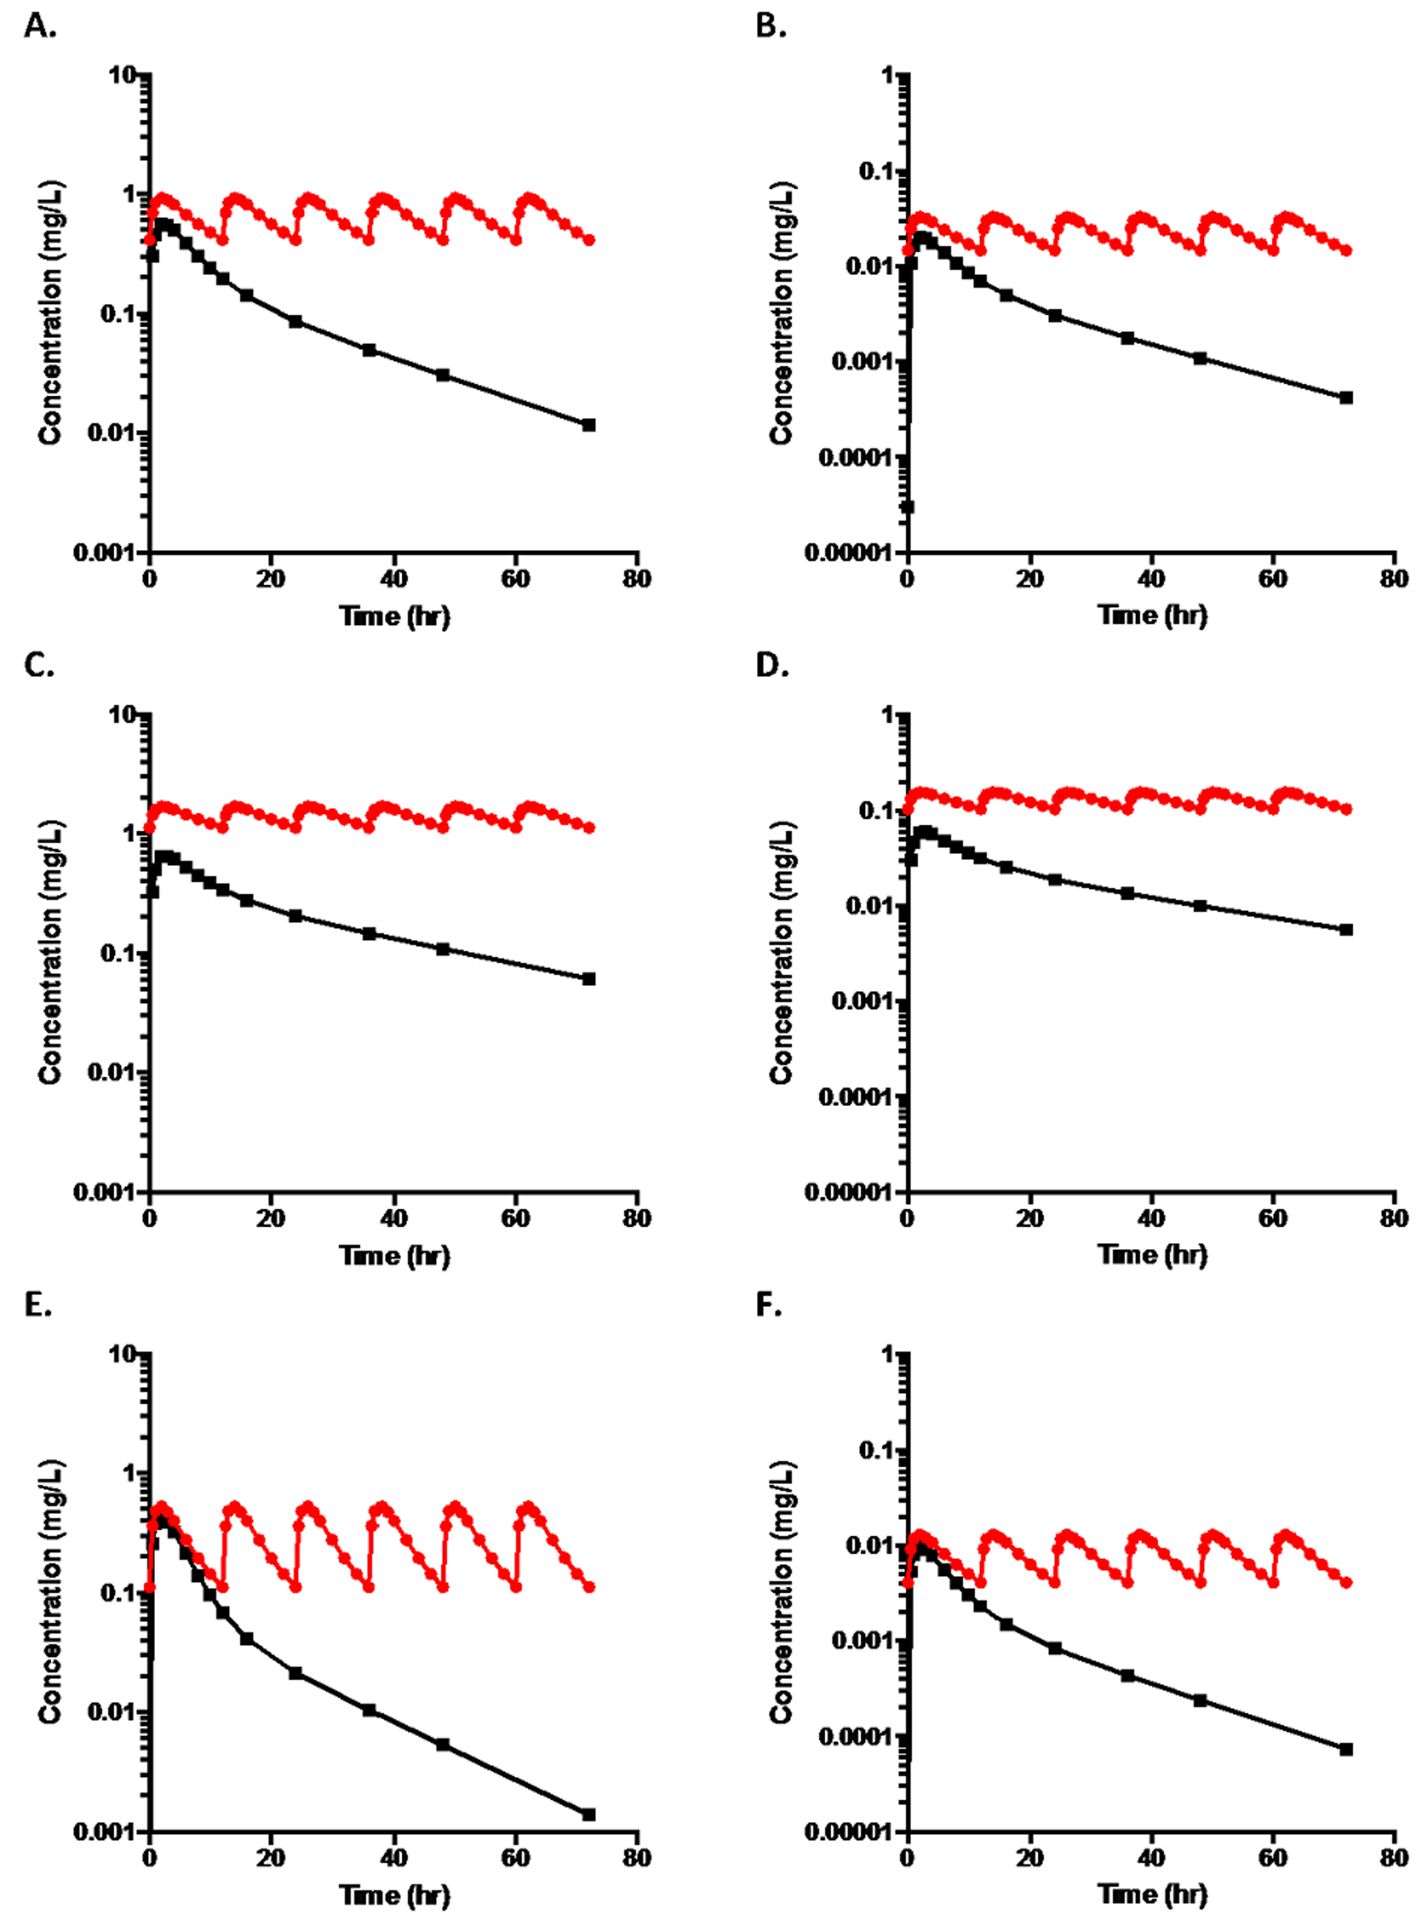
A. Log concentration-time plots for an orally dosed drug (100mg) following two compartment disposition kinetics where volume of the central compartment (V1) is 100 L, the rate constant of elimination from the central compartment (k10) is 0.1 hr−1, the distribution rate constants into and out of the peripheral compartment (k12 and k21) are 0.06 hr−1and 0.08 hr−1, respectively (resulting in two-compartment exponential functions of λ1 = 0.2 hr−1 and λ2 = 0.04 hr−1), an hepatic clearance of 10 L/hr, a first order absorption rate constant (ka) of 1.0 hr−1and a bioavailability (F ) of 0.8 where the upper curve represents steady state dosing every 12 hr and the lower curve depicts a single oral dose. The terminal half-life from the lower curve is 17.3 hr, while t½,op for the multiple dosing upper curve is 8.8 hr.
B. The log concentration time curves for a high extraction ratio drug where the values for dose, FA·FG , distribution, elimination and absorption rate constants are unchanged from that in Fig. 1A but hepatic clearance is increased to 70 L/hr, which results in F becoming 0.2. V1 is increased to 700L so that the terminal half-life for the single oral dose remains at 17.3 hr, while t½,op from the multiple dosing upper curve is 7.8 hr.
C. The single dose and multiple dose time curves for the low ERH drug depicted in Fig. 1A when clearance is decreased by 50% to 5 L/hr, which results in F becoming 0.85. From the upper steady state curve, t½,op = 17.2 hr; from the lower single dose curve the terminal half-life is 28.9 hr.
D. The single dose and multiple dose time curves for the high ERH drug depicted in Fig. 1B when clearance is decreased by 50% to 35 L/hr, which results in F becoming 0.55. From the upper steady state curve, t½,op = 17.2 hr; from the lower single dose curve the terminal half-life is 28.9 hr.
E. The single dose and multiple dose time curves for the low ERH drug depicted in Fig. 1A when clearance is doubled to 20 L/hr, which results in F becoming 0.70. From the upper steady state curve, t½,op = 4.7 hr; from the lower single dose curve the terminal half-life is 12.4 hr.
F. The single dose and multiple dose time curves for the high ERH drug depicted in Fig. 1B when clearance is increased by 10L/hr to 80 L/hr, which results in F becoming 0.1. From the upper steady state curve, t½,op = 6.2 hr; from the lower single dose curve the terminal half-life is 14.1 hr.
Considerations of Metabolic (vs. Transporter) Drug-Drug Interactions and PG Variance
Changes in drug metabolism related to drug interactions or PG variance have the potential to alter drug clearance, but not via any changes in transporter function. Therefore, it is expected that volume of distribution of drug should remain unchanged. Although we have not exhaustively analyzed the drug-drug interaction and PG variance database, we are not aware of any changes in drug volume of distribution that result from metabolic changes only. Further, changes in renal or biliary elimination are not expected, as they frequently are affected by transporters. Thus, the present analysis assumes that for metabolism-related changes resulting from drug interactions or PG variance there are no changes in volume of distribution, renal clearance or biliary clearance. Therefore, MRT and steady-state half-life are inversely related to clearance, and any observed changes in exposure (AUC), maximum concentration following an oral dose (Cmax) and half-life result from metabolic changes only. The equations for AUC will all be analyzed assuming that the hepatic extraction ratio is determined as the ratio of hepatic blood clearance to hepatic blood flow as we recently reviewed [5], so that hepatic first pass bioavailability following oral dosing (FH) is given by Eq. 3:
| (3) |
where CLH is the hepatic metabolic blood clearance and QH is the hepatic blood flow.
Exposure Following Oral Dosing and Impact on Pharmacodynamics
As shown in our recent publication [1] and by many others
| (4) |
where FA is the fraction of the dose absorbed, FG is the fraction of the dose escaping intestinal metabolism, D is dose, fu,B is the fraction of unbound drug in blood calculated as the fraction unbound in plasma divided by the blood to plasma concentration ratio, and is the sum of the irreversible elimination intrinsic clearances from the liver. Equation 4 is applicable to all oral dosing conditions where only metabolism is considered and volume of distribution is a constant. That is, Eq. 4 is valid for high hepatic extraction (ERH), intermediate and low ERH drugs. Thus, the exposure following oral dosing will change inversely with and fu,B and directly with FA · FG.
Exposure following oral dosing can also be markedly affected by changes in FG though inhibition, induction and/or genomic variance of intestinal enzymes. This will be particularly true for CYP3A substrates, since CYP3A4 is the major enzyme present in the intestinal epithelia. As will be addressed subsequently, the importance of FG in changes of exposure following a single oral dose can be approximated by comparing the changes in AUC and Cmax to the changes in half-life or MRT.
Clinically relevant changes, those where pharmacodynamics are altered, will be expected based on the extent of the exposure changes resulting from drug-drug interactions and PG variance. However pharmacodynamic changes will not be observed when total drug AUC varies due to fu,B changes. As emphasized by Benet and Hoener [6], Eq. 5 shows that the area under the concentration-time curve for unbound drug (AUCu) following oral dosing will be unaffected by changes in protein binding.
| (5) |
It is also possible to derive the relationship for the exposure within the liver following oral dosing (AUCH,oral) as given in Eq. 6:
| (6) |
where fu,H is the fraction of drug unbound within the liver. Again, one can see by multiplying through by fu,H that changes related to intrahepatic unbound drug concentrations will have no effect on a pharmacodynamic outcome.
Using AUC, Maximum Concentrations and Steady-State Half-Life to Characterize Extraction Ratio Following Oral Dosing
In understanding changes in pharmacokinetics for metabolized drugs, we concentrate on the ready measures that a clinician or scientist can observe following drug dosing. Following oral dosing, these include AUC, Cmax, half-life and tmax, the time when Cmax occurs. Most approved orally administered drugs have not been studied following intravenous dosing in humans and therefore as seen in Eq. 7, bioavailability (F, which equals FA·FG·FH) cannot be distinguished from clearance.
| (7) |
However, drug interaction and pharmacogenomic variance studies can provide useful information as to whether a drug is a high ERH drug, where F is small, versus a low ERH drug, where F approaches 1. As we demonstrate below, the analysis should consider AUC, Cmax and apparent half-life at steady-state.
The data described in Fig.1A represents a low ERH drug for which all elimination is via metabolism, where FH = 0.889 and FA·FG = 0.9, giving the F value of 0.8 for both single and multiple dosing. In Fig. 1B we depict the single dose oral concentration-time curve for a high ERH drug, keeping the dose, FA·FG , distribution, elimination and absorption rate constants unchanged, but hepatic clearance increased to 70 L/ hr and V1 to 700 L. Above the single dose curve in Fig. 1B we depict the concentration time curve for every 12 hour dosing. Here again the terminal half-life following oral dosing is 17.3 hr and the half-life for steady-state dosing appears to be approximately 8 hr.
Obviously, we could have chosen an infinite set of parameters to define the low and high extraction ratio drugs depicted in Figs. 1A and 1B, respectively, but to allow comparison of the effects of inhibition and induction on low versus high ERH drugs, we wanted to have control conditions and half-lives that were approximately the same.
Inhibition, Induction and Pharmacogenomic Variance Outcomes Following Oral Dosing
In Figs. 1C and 1D we depict the concentration time curves when metabolism is inhibited, clearance is decreased by 50%, for the low and high ERH drugs, respectively. When metabolism is inhibited, for the low ERH drug, CLH = 5 L/hr, which results in F becoming 0.85. For the high ERH drug CLH = 35 L/hr, which results in F becoming 0.55.
In Fig.1E we depict the concentration time curves when enzyme induction has occurred and have doubled the hepatic clearance of the low ERH drug to 20 L/hr, which results in F becoming 0.70. In Fig. 1F we have increased the hepatic clearance of the high ERH drug to 80 L/hr, which results in F becoming 0.1. It is obvious that the terminal half-life of the drug in each single dose plot is markedly different from the apparent one-compartment half-lives upon multiple dosing as noted in the figure legend.
Table 1 summarizes the ratios of the various parameters for the altered condition (either decreased-inhibited or increased-induced metabolism) relative to the control condition for both low and high ERH drugs. The AUC ratio will be the same for the first dose and at steady-state, since the single dose AUC0→∞ is equal to the multiple dose steady-state AUC0→τ, during a dosing interval τ. The half-life value ratios reported in Table 1A are the multiple dosing values, the operational multiple dosing half-life, t½op, defined by Sahin and Benet [4]. The Cmax ratios in Table 1A are for steady-state values (Cmax,ss).
Table 1A.
More Definitive Ratios: Altered Condition/Control
| AUC | t½, op | Cmax, ss | |
|---|---|---|---|
| Low ERH | |||
| Inhibited | 2.13 | 1.95 | 1.82 |
| Induced | 0.44 | 0.53 | 0.57 |
| High ERH | |||
| Inhibited | 5.50 | 2.20 | 4.71 |
| Induced | 0.44 | 0.80 | 0.39 |
A very useful relationship is observed when comparing the AUC, Cmax,ss and t½op ratios. For low ERH drugs, these three ratios are approximately the same for inhibited conditions and for induced conditions. In contrast, for high ERH drugs, the AUC and Cmax,ss ratios are approximately the same but markedly different from the t½op ratios. Thus, even without IV dosing it is possible from these interaction or PG variance studies to learn whether a drug is high or low ERH. The marked difference in the operational half-life ratios versus AUC and Cmax ratios for high versus low ERH drugs is primarily due to the relative magnitude of change possible in FH for high versus low ERH drugs. For low ERH drugs marked changes in clearance will have minimal impact on FH (as evident in Eq. 3) and therefore on overall F. Since AUC and Cmax can be influenced by changes in both clearance and F, and F is expected to be relatively unchanged for low ERH drugs, it follows that changes in half-life related to clearance changes will be similar in magnitude to AUC and Cmax changes. For high ERH drugs, a small change in hepatic clearance can lead to a marked change in FH (and therefore AUC and Cmax ) much larger in magnitude than the observed change in half-life. Additionally, on a percentage basis for high ERH drugs a marked increase in clearance may not be possible, since clearance already approaches hepatic blood flow. Further, with a marked decrease in the hepatic clearance of a high ERH compound, the drug would no longer be high ERH.
Table 1B summarizes less definitive ratios, but some interesting outcomes should be noted. For a low ERH drug, inhibition yields little change in Cmax for a single dose study. This is true, since although AUC is the same for the first dose and the steady-state dosing interval, Cmax accumulates during multiple dosing and little effect is seen for a single dose. In contrast for a high ERH drug, there will be an observable first dose increase in Cmax with inhibition, but not as much as the increase in AUC. Although mathematically we can calculate the first dose changes in Cmax due to induction, and experimental studies can be designed to evaluate this ratio, this will not be useful in a relevant study or clinical situation since there will be little induction following the first dose of a concomitant inducer, and by the time induction has occurred, the subjects will be at steady-state. However, the first dose effect can be analyzed for increased PG metabolism. The Cmin,ss values do show differentiation between high and low ERH drugs for inhibition and induction, however, the disadvantage is that there is no further confirming comparison as in the case of the Cmax,ss ratios. The advantage of analyzing the Cmax,ss ratios is that they should be similar to the AUC ratios in discriminating high and low ERH drugs. It will also be very difficult to make any conclusions based on tmax ratios either at steady-state or from a single dose inhibition study, since all of the ratio values are so close to 1.0. However, we will always expect the multiple dosing tmax to be smaller in magnitude than the single dose tmax for all situations. Similar to the t½op ratios, the change in terminal half-life following a single dose will show the appropriate inhibition/induction effects, but it is often more difficult to determine these terminal half-life values versus the apparent t½op values at steady-state. Yet, following single dose drug interaction or pharmacogenomic variance studies, high versus low ERH can be discerned. Comparing AUC ratios with t½term,1st dose in Table 1 shows that the t½term,1st dose ratio approximates the AUC ratio for both inhibition and induction with low ERH drugs, but not as close as the t½,op ratio (i.e., Inhibition, Low ERH: AUC ratio 2.13, t½term,1st dose ratio 1.67, t½,op ratio 1.95; Inhibition High ERH: AUC ratio 5.50, t½term,1st dose ratio 1.67, t½,op ratio 2.20; Induction, Low ERH: AUC ratio 0.44, t½term,1st dose ratio 0.71, t½,op ratio 0.53; Induction, High ERH: AUC ratio 0.44, t½term,1st dose ratio 0.82, t½,op ratio 0.80). One can readily see that high vs low ERH can be determined following the single dose studies.
Table 1B.
Less Definitive Ratios: Altered Condition/Control
| Cmax, 1st dose | t½ term,1st dose | Cmin, ss | tmax, ss | tmax,1st dose | |
|---|---|---|---|---|---|
| Low ERH | |||||
| Inhibited | 1.14 | 1.67 | 2.72 | 1.08 | 1.16 |
| Induced | 0.77 | 0.71 | 0.28 | 0.88 | 0.84 |
| High ERH | |||||
| Inhibited | 2.61 | 1.67 | 7.05 | 1.08 | 1.16 |
| Induced | 0.47 | 0.82 | 0.28 | 0.95 | 0.93 |
CYP3A Substrates Following Oral Dosing
Since CYP3A is the major cytochrome P450 enzyme in the intestine, inhibition or induction of this enzyme can have major effects on FG. This results in greater effects on AUC and Cmax ratios than for non-CYP3A substrates, but with essentially no additional effect on t½ ratios. For CYP3A inhibition studies, we expect there to be less differential between the first dose and steady-state Cmax ratios.
Inhibition, Induction and Pharmacogenomic Variance Outcomes Following IV Dosing
There are many fewer drug interaction (inhibition and induction) and PG variance (decreased and increased metabolism) data following IV dosing than for oral dosing. However, some general rules can be applied. For low ERH drugs, changes in AUC and half-life will be similar to that for oral drugs, but of course, there will be no F related issues. For high ERH drugs, AUC and half-life will change inversely with QH. Protein binding interactions will change pharmacodynamic effects. That is, if there is more free drug, a greater effect will be observed, in contrast to the lack of a pharmacodynamic effect for orally dosed drugs and low ERH IV dosed drugs [1].
Comparison of Pharmacokinetics in Disease State Patients vs Healthy Volunteers
The analysis presented here for analyzing pharmacokinetic changes in metabolic outcome due to inhibition, induction and PG variance assumes that volume of distribution remains constant, which we maintain is the condition for metabolic drug interactions and PG variance. As noted above if transporters are significantly involved the general trends discussed here may not be appropriate since transporter changes can also lead to volume of distribution changes in addition to clearance changes, both of which will affect half-lives. This may also be true for comparison of disease state versus healthy volunteer analysis, where the disease state may potentially change volume of distribution beyond simply changing the extent of protein binding. However, as seen below for propranolol, this does not appear to be a disqualifying situation.
Examples of Metabolic Drug Interactions and Pharmacogenomic Variance from the Literature
Alván et al. [7] reported the induction of alprenolol metabolism by pentobarbital treatment as depicted for one subject in Fig. 2. Subjects received oral (200 mg) and IV (5 mg) alprenolol, a high ERH drug with a plasma clearance of 75 ± 10 L/hr (blood to plasma ratio not given), before and after 10 days of nightly 100 mg oral doses of pentobarbital. As would be expected, no significant change in AUC or t½ was seen for the IV curves, since QH would not be expected to change with pentobarbital induction. However, there will be easily observable changes in AUC and Cmax,ss following oral dosing as per Eq. 4, and they are expected to change in parallel, as shown in Table 1A (High ERH , Induced). As shown in Table 1A, a decrease in t½ would also be expected, but the change would be much less than the AUC and Cmax,ss changes and not as obvious. This appears to be the case in Fig. 2.
Fig. 2.
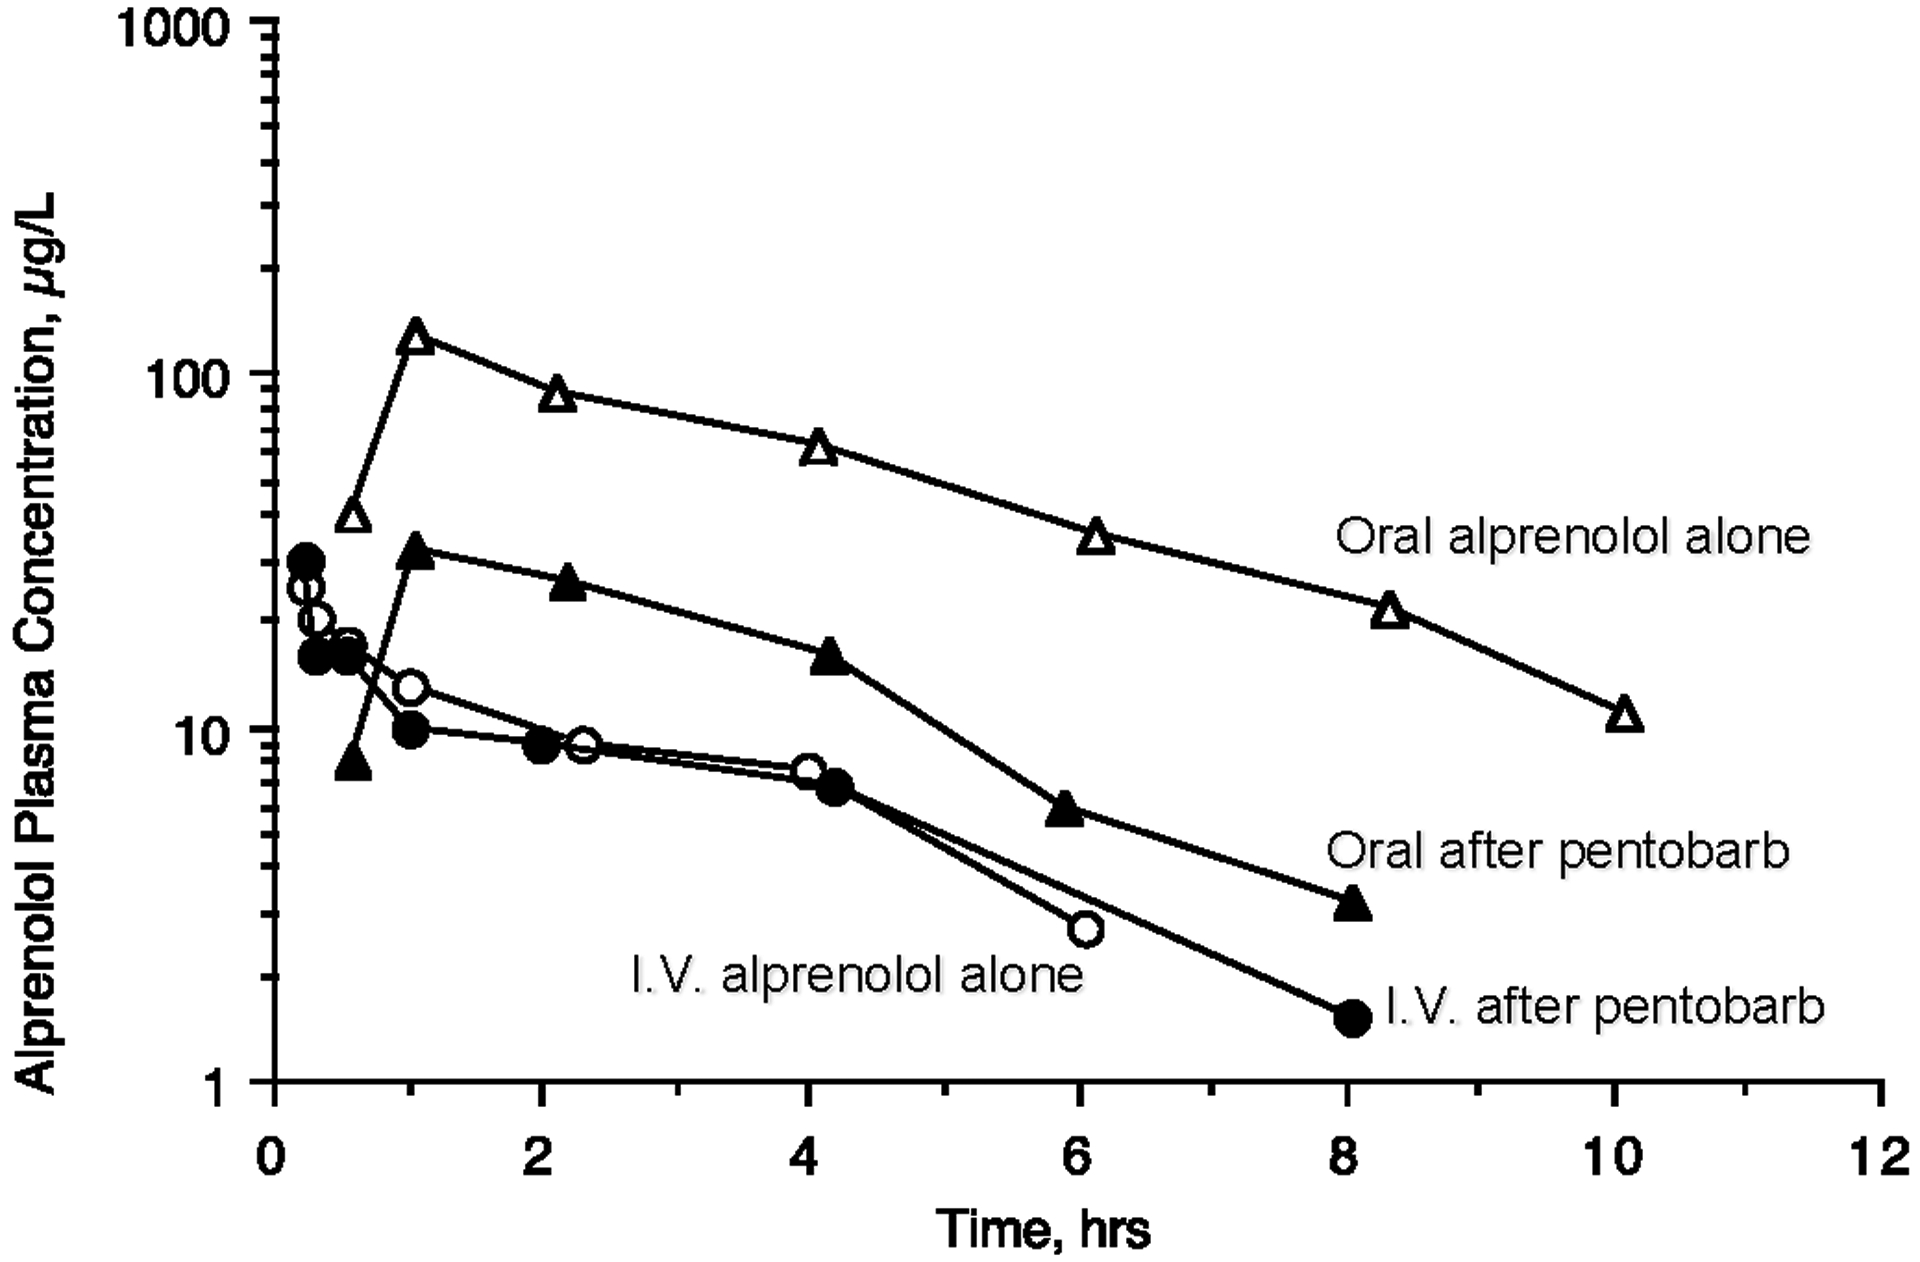
Pharmacokinetics of alprenolol a high ERH drug, before and after 10 days of nightly 100 mg oral doses of pentobarbital for 5 mg IV doses of alprenolol and 200 mg oral doses. Adapted with permission from reference [7].
Blake et al. [8] carried out a meta-analysis of single oral doses of metoprolol in extensive, poor, intermediate and ultra-rapid CYP2D6 metabolizers of this high ER drug. The comparison of the ratios of mean values for AUC, Cmax,1st dose and terminal t½1st dose are given in Table 2. As seen in comparison with Table 1 High ERH Inhibited, the AUC ratio (Poor/Extensive) in Table 2 is more than double the Cmax,1st dose ratio (4.86 vs 2.28) and the t½1st dose ratio (4.86 vs 2.28). The AUC ratio (Ultra-Rapid/Extensive) is less than the Cmax,1st dose ratio (0.37 vs 0.43) and the t½1st dose ratio (0.37 vs 0.90).These results follow the same pattern as the comparison in Table 1 for High ERH Induced. At steady state the AUC and Cmax ratios would be expected to be similar, but this is not the case following the first dose, which are often the only data available when sponsors are characterizing the relevance of potential drug-drug interactions and the importance of pharmacogenomic variance.
Table 2.
Ratios of Poor Metabolizers to Extensive Metabolizers and Ultra-Rapid Metabolizers to Extensive Metabolizers following Oral Dosing of Metoprolol, a High ERH CYP2D6 Substrate [8]
| AUC Ratio | t½,term,1st dose Ratio | Cmax,1st dose Ratio | |
|---|---|---|---|
| Poor | 4.86 | 2.32 | 2.28 |
| Extensive | |||
| Ultra-Rapid | 0.37 | 0.90 | 0.43 |
| Extensive |
Kharasch et al. [9] investigated the effects of CYP2B6 polymorphisms on the pharmacokinetics of oral and intravenous methadone, a low ERH drug. Only AUC0→∞ values were reported together with figures depicting the average plasma concentration time curves. There was sufficient separation of the S-methadone plasma concentration curves that we were able to digitalize the data resulting in the outcomes presented in Table 3A for the measurements of relevance to this analysis. As can be seen, our calculated AUC0→∞ values from the digitalized data are reasonably close to the published values, all within 7%. The ratios for the individual parameters we calculated from the digitalized data are presented in Table 3A. There are no significant differences between the normal metabolizers (CYP2B*1/*1) and the intermediate metabolizers (CYP2B*1/*6). However, poor metabolizers (CYP2B*6/*6) yield comparable ratios for AUC and t½terminal,1st dose as would be suspected for a low ERH drug following the pattern given in Table 1, with Cmax,1st dose not giving as big a change, again as reflected in Table 1 for inhibition of a low ERH drug. The intravenous plasma concentration values in Kharasch et al. [9], corrected for a blood/plasma ratio of 0.79 [10] yield a blood clearance of 17.0 L/hr for S-methadone, consistent with a low ERH drug.
Table 3.
Measured AUC and Parameters Determined from Digitalized Data for Oral Doses of S-Methadone, a Low ERH Drug, in Healthy Volunteers Exhibiting Different CYP2B6 Genotypes and the Ratios of Parameters from the Study of Kharasch et al. [9]
| A. Absolute Values | ||||||||
|---|---|---|---|---|---|---|---|---|
| Genotype | N | Phenotype | Published AUC0→∞ ng/ml/hr | AUC0→96 ng/ml/hr | AUC0→∞ ng/ml/hr | t½,term, 1st dose hr | Cmax, 1st dose ng/ml | tmax hr |
| CYP2B6*1/*1 | 21 | Normal Metabolizers | 620 | 546.6 | 612.8 | 29.3 | 13.3 | 8.0 |
| CYP2B6*1/*6 | 20 | Intermediate Metabolizers | 734 | 630.1 | 714.9 | 30.8 | 19.1 | 3.0 |
| CYP2B6*6/*6 | 17 | Poor Metabolizers | 1242 | 887.8 | 1164.7 | 45.5 | 18.7 | 3.0 |
| CYP2B6*4/X (CYP2B6*1/*4 & CYP2B6*4/*6) | 4 | Rapid Metabolizers | 155 | 152.2 | 156.5 | 17.7 | 5.7 | 6.0 |
| B. Ratios versus Normal Metabolizers | ||||||||
| Genotype | N:N | Phenotype | Published AUC0→∞ | AUC0→96 | AUC0→∞ | t½, term, 1st dose | Cmax, 1st dose | tmax |
| CYP2B6*1/*6 | 20:21 | Intermediate Metabolizers | 1.2 | 1.2 | 1.2 | 1.1 | 1.4 | 0.4 |
| CYP2B6*6/*6 | 17:21 | Poor Metabolizers | 2.0 | 1.6 | 1.9 | 1.6 | 1.4 | 0.4 |
| CYP2B6*4/X (CYP2B6*1/*4 & CYP2B6*4/*6) | 4:21 | Rapid Metabolizers | 0.3 | 0.3 | 0.3 | 0.6 | 0.4 | 0.8 |
There were only 4 rapid metabolizers in the study for two different genotypes as given in Table 3, and their average blood clearance was 27.2 L/hr, approaching a doubling. The ratios of AUC and t½terminal,1st dose are quite similar to the values in Table 1 for a two-fold induction in clearance for a low extraction ratio drug, but the Cmax,1st dose ratio is lower than expected. This could be due to the limited number of subjects investigated, but it could also reflect the increase in clearance from the low ERH range. Yet, it appears that it is probably easier to differentiate high vs low ERH drugs based on inhibition drug-drug interaction or decreased pharmacogenomic activity studies than for induction or increased pharmacogenomic activity studies.
Rogge et al. [11] reported the effect of enoxacin inhibition on the metabolism of the low ERH drug theophylline following 200 mg single oral doses. Following 9 enoxacin 25 mg doses every 12 hr, a single 200 mg oral dose of theophylline (as Theo-Dur®) was compared with a 200 mg oral dose of theophylline prior to enoxacin administration resulting in the following ratios: AUCinhibition/AUCcontrol = 1.42; t½inhibition/t½control = 1.35; Cmax,inhibition/Cmax,control = 1.30, values that are similar to one another and consistent with what would be expected for a low ERH drug.
Midazolam is a CYP3A substrate with an intermediate ERH (plasma clearance hepatic = 46 L/hr) and an FG = 0.57 [12]. Concomitant dosing of 100 mg fluconazole with single oral 3 mg doses of midazolam yielded AUCinhibition/AUCcontrol = 2.16; t½inhibition/t½control = 1.25; Cmax,inhibition/Cmax,control = 1.77 [12]. These data illustrate the point discussed above that for CYP3A substrates the effect of inhibition on FG yields single dose Cmax changes closer in magnitude to AUC changes than might be expected as given in Tables 1 and 2. Backman et al. [13] investigated the inhibition and induction of midazolam, with concomitant multiple oral doses of itraconazole and rifampin, respectively, in 9 healthy volunteers noting that plasma concentration-time curves for oral midazolam may differ by 400-fold between the two interactions, as shown in Table 4. Here again, single dose Cmax ratios for this CYP3A substrate are much closer to AUC changes, than t½ changes.
Table 4.
Ratios of Altered Condition/Control following Oral Dosing of Midazolam, an Intermediate ERH CYP3A Substrate, when Inhibited by Itraconazole and Induced by Rifampin [13].
| AUC Ratio | t½ Ratio | Cmax,1st dose Ratio | |
|---|---|---|---|
| Inhibited | 6.75 | 3.06 | 3.12 |
| Control | |||
| Induced | 0.023 | 0.372 | 0.054 |
| Control |
Finally, Fig. 3 depicts the oral and IV propranolol blood concentration-time curves in 9 normal subjects and 7 patients with cirrhosis observed during the seventh dosing interval for an oral 8 hr dosing regimen measuring unlabeled drug with a simultaneous tritiated IV dose of propranolol as reported by Wood et al. [14]. For this intermediate-high ERH drug, the change in AUC and half-life following IV dosing in the cirrhosis patients is not as great as following oral doses, since the AUCIV Eq. 8 [1] is a function of both QH and CLint, with the QH term markedly damping the effect of decreased CLint in the cirrhosis patients.
Fig. 3.
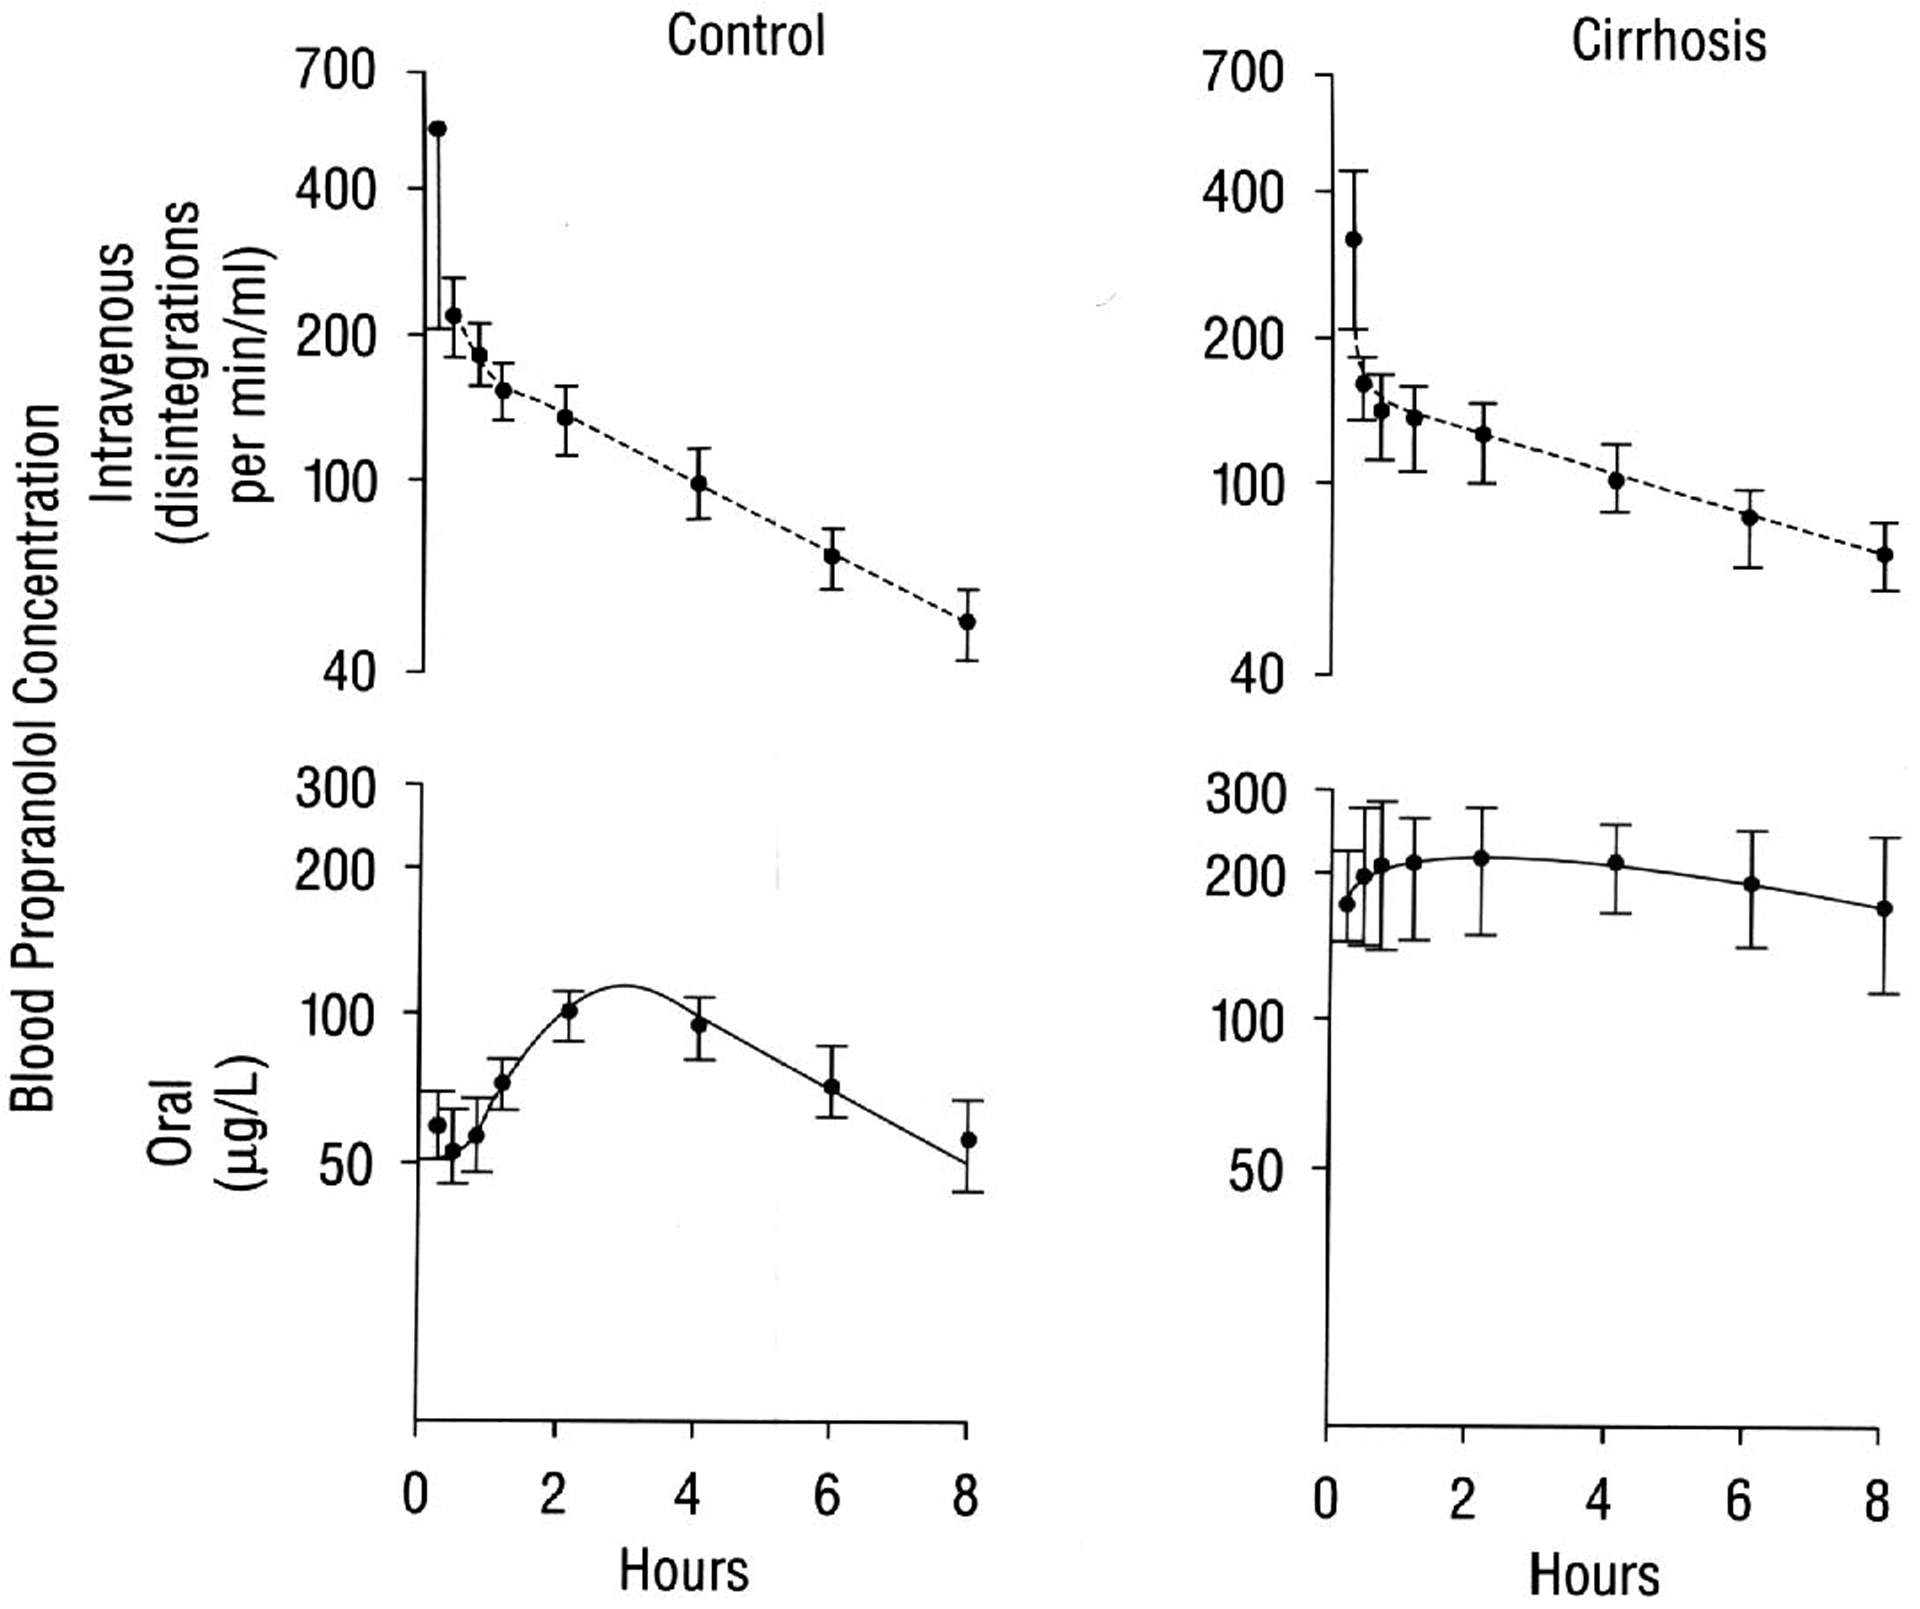
In cirrhosis, the oral bioavailability of propranolol is greatly increased, as evidenced by comparison of the blood concentrations of unlabeled drug after oral administration (bottom panel) with that of tritiated drug after IV administration (top panel), following simultaneous determination of the kinetics of propranolol during the seventh dosing interval of an oral 8 hr dosing regimen in 9 normal subjects and 7 patients with cirrhosis. Reproduced with permission from reference [13].
| (8) |
However, following oral doses, Eq. 4 is the relevant relationship and the change of CLint in the cirrhosis patients has a marked effect on AUC, Cmax and t½. As noted in Fig. 3 for the oral multiple doses, the data appear to follow a one-compartment body model with first order absorption as previously seen in the upper panels of Fig. 1.
Conclusions
Following multiple dosing to steady-state, oral systemic concentration time curves appear to follow a one-compartment body model, but with the rate limiting half-life smaller, and often significantly smaller, than the single dose terminal half-life. This simplified disposition model at steady-state, as well as after single dose studies, allows comparisons of measurable parameters, AUC, Cmax, t½ and tmax, to be utilized following drug interaction or PG variance studies to characterize whether a drug is low versus high hepatic extraction ratio, even without IV dosing. We believe that such drug interaction and pharmacogenomic variance studies are the only means to characterize the relative magnitude of the extraction ratio for a drug in humans exclusively studied following oral doses. The characteristics of drugs based on ratios of AUC, Cmax and t½ are identified with the recognition that volume of distribution is essentially unchanged for these drug interaction and PG variance studies where only metabolic outcomes are changed and transporters are not significantly involved. Comparisons of Cmax changes following single dose interaction and PG variance studies may also identify the significance of FG changes. Pharmacodynamic changes would be expected to directionally follow pharmacokinetic changes for these metabolic drug interaction and pharmacogenomic variance studies, but not necessarily to the same extent. Once the relative magnitude of ERH is determined, both drug development scientists and clinicians will recognize that for high ERH drugs changes in exposure may be significantly more than estimated based on clearance and half-life changes.
Acknowledgements
The authors thank the UCSF PharmD Class of 2021 for their understanding, questions and patience in the presentation of the material presented here. This work was supported in part by a Mary Ann Koda-Kimble Seed Award for Innovation. Dr. Benet is a member of the UCSF Liver Center supported by NIH grant P30 DK026743. Ms. Bowman was supported by the National Science Foundation Graduate Research Fellowship Program (Grant 1144247) and a Pharmaceutical Research and Manufacturers of America Foundation Pre-doctoral Fellowship in Pharmaceutics. Ms. Koleske was supported in part by NIGMS grant R25 GM56847. Ms. Rinaldi was supported by the National Science Foundation Graduate Research Fellowship Program (Grant 1650113). Ms. Sodhi was supported in part by an American Foundation for Pharmaceutical Education Predoctoral Fellowship and NIGMS grant R25 GM56847.
References
- 1.Benet LZ, Bowman CM, Liu S, Sodhi JK (2018) The extended clearance concept following oral and intravenous dosing: theory and critical analyses. Pharm Res 35:242. [DOI] [PMC free article] [PubMed] [Google Scholar]
- 2.Grover A, Benet LZ (2009) Effects of drug transporters on volume of distribution. AAPS J 11:250–261. [DOI] [PMC free article] [PubMed] [Google Scholar]
- 3.Benet LZ, Galeazzi RJ (1979) Noncompartmental determination of the steady-state volume of distribution. J Pharm Sci 68:1071–1074. [DOI] [PubMed] [Google Scholar]
- 4.Sahin S, Benet LZ (2008) The operational multiple dosing half-life: a key to defining drug accumulation in patients and to designing extended release dosage forms. Pharm Res 25:2869–2877. [DOI] [PMC free article] [PubMed] [Google Scholar]
- 5.Benet LZ, Liu S, Wolfe AR (2018) The universally unrecognized assumption in predicting drug clearance and organ extraction ratio. Clin Pharmacol Ther 103:521–525. [DOI] [PMC free article] [PubMed] [Google Scholar]
- 6.Benet LZ, Hoener B-a (2002) Changes in plasma protein binding have little clinical relevance. Clin Pharmacol Ther 71:115–121. [DOI] [PubMed] [Google Scholar]
- 7.Alván G, Piafsky K, Lind M, von Bahr C (1977) Effect of pentobarbital on the disposition of alprenolol. Clin Pharmacol Ther 22:316–321. [DOI] [PubMed] [Google Scholar]
- 8.Blake CM, Kharasch ED, Schwab M, Nagele P (2013) Meta-analysis of CYP2D6 metabolizer phenotype and metoprolol pharmacokinetics. Clin Pharmacol Ther 94:394–399. [DOI] [PMC free article] [PubMed] [Google Scholar]
- 9.Kharasch ED, Regina KJ, Blood J, Friedel C (2015) Methadone pharmacogenomics: CYP2B6 polymorphisms determine plasma concentrations, clearance and metabolism. Anesthesiology 123:1142–1153. [DOI] [PMC free article] [PubMed] [Google Scholar]
- 10.Hsu YC, Chen BG, Yang YS, Huang SP, Huang MH, Chen TJ, Liu HC, Lin DL, Jones AW (2013) Methadone concentrations in blood, plasma and oral fluid determined by isotope-dilution gas chromatography-mass spectrometry. Anal Bioanal Chem 405:3921–3928. [DOI] [PubMed] [Google Scholar]
- 11.Rogge MC, Solomon WR, Sedman AJ, Welling PG, Toothaker RD, Wagner JG (1988) The theophylline-enoxacin interaction: I. effect of enoxacin dose size on theophylline disposition. Clin Pharmacol Ther 44:579–587. [DOI] [PubMed] [Google Scholar]
- 12.Kharasch ED, Walker A, Hoffer C, Sheffels P (2005) Sensitivity of intravenous and oral alfentanil and pupillary miosis as minimally invasive and noninvasive probes for hepatic and first-pass CYP3A activity. J Clin Pharmacol 45:1187–1197. [DOI] [PubMed] [Google Scholar]
- 13.Backman JT, Kivistö KT, Olkkola KT, Neuvonen PJ (1998) The area under the plasma concentration-time curve for oral midazolam is 400-fold larger during treatment with itraconazole than with rifampin. Eur J Clin Pharmacol 54:53–58. [DOI] [PubMed] [Google Scholar]
- 14.Wood AJJ, Kornhauser DM, Wilkinson GR, Shand DG, Branch RA (1978) The influence of cirrhosis on steady-state blood concentrations of unbound propranolol after oral administration. Clin Pharmacokinet 3:478–487. [DOI] [PubMed] [Google Scholar]