

CPT: Pharmacometrics Syst. Pharmacol. (2017) 6, 430–438; https://doi.org/10.1002/psp4.12181; published online 9 June 2017.
In [1], we noticed the units for the pyrimethamine additive error in Table 2 and the right‐hand side panel (sulfadoxine) of Figure 2 were incorrect. The correct units for the pyrimethamine additive error in Table 2 is ng/mL and the correct units for the right‐hand side panel (sulfadoxine) of Figure 2 is μg/mL. The corrected table and figure are shown below.
Table 2.
Final pharmacokinetic parameter values for pyrimethamine and sulfadoxine during pregnancy and after delivery
| Parameter | Sulfadoxine | Pyrimethamine | ||
|---|---|---|---|---|
| Estimate | 95% CI a | Estimate | 95% CI a | |
| F | 1 FIXED | — | 1 FIXED | — |
| CL/F during pregnancy [L/h] b | 0.0303 | 0.0185, 0.0349 | 1.35 | 1.12, 1.38 |
| Vc/F [L] b | 14.1 | 13.2, 14.4 | 163 | 151, 166 |
| ka [/h] | 0.531 | 0.464, 0.565 | 1.31 | 1.11, 2.70 |
| Qp1/F [L/h] b | 0.0252 | 0.0136, 0.0269 | 1.45 | 0.72, 1.61 |
| Vp1/F [L] b | 179 | 82, 212 | 29.8 | 23.9, 32.1 |
| Qp2/F [L/h] b | — | — | 0.122 | 0.064, 0.166 |
| Vp2/F [L] b | — | — | 251 | 142, 317 |
| θRBC/PL [fraction of one] | 0.155 | 0.023, 0.189 | 0.324 | 0.106, 0.525 |
| Change in CL when non‐pregnant [%] | −75.7 | −88.7, −66.6 | 21.2 | 12.3, 24.9 |
| T50 [weeks] | 6.35 | 5.47, 6.75 | — | — |
| γ – shape factor | 4.90 | 2.90, 7.41 | — | — |
| Difference in clearance in Mozambique [%] | — | — | −20.2 | −28.4, −17.4 |
| Site effect (scaling on observations) in Mozambique [%] | 21.2 | 8.2, 24.6 | 57.6 | 41.5, 60.6 |
| Site effect (scaling on observations) in Sudan [%] | 15.5 | 4.8, 20.0 | 33.2 | 19.6, 35.6 |
| Site effect (scaling on observations) in Zambia [%] | −24.8 | −30.7, −22.2 | −5.40 | −12.1, −3.9 |
| Between subject variability in CL [%] c | 31.3 | 21.8, 51.2 | 12.3 | 7.1, 16.9 |
| Between occasion variability in F [%] c | 20.7 | 16.7, 22.9 | 17.6 | 12.9, 21.5 |
| Between occasion variability in CL [%] c | — | — | 16.9 | 11.8, 22.3 |
| Between occasion variability in ka [%] c | 56.4 | 42.4, 70.1 | — | — |
| Correlation in bioavailability of the two drugs [%] | 67.9 | 55.9, 71.9 | * | * |
| Additive error [ng/mL pyra – and µg/mL for sulfa] | 2.13 | 2.00, 2.21 | 2.45 | 2.01, 2.68 |
| Proportional error [%] | 17.0 | 14.8, 17.5 | 18.0 | 15.1, 18.7 |
| Correlation in random unexplained error of the two drugs [%] | 61.3 | 54.2, 63.9 | * | * |
Pharmacokinetic parameter values are expressed referring to plasma. CI, confidence interval; F, relative bioavailability; CL/F, elimination clearance; VC/F, apparent volume of distribution of central compartment; ka, first order absorption rate constant; QP1/F, flow rate to and from shallow peripheral compartment; VP1/F, apparent volume of distribution of shallow peripheral compartment; QP2/F, flow rate to and from deep peripheral compartment; VP2/F, apparent volume of distribution of deep peripheral compartment; θRBC/PL, red blood cells to plasma ratio; T50, time at which of 50% post‐delivery effect; γ, post‐delivery effect shape parameter.
95% confidence interval denoted as 2.5–97.5 percentiles of the estimates from 500 iterations of a nonparametric bootstrap.
All volumes and flow rates (clearance and flow rates to and from peripheral compartments) were allometrically scaled with total body weight centred on the median body weight (60 kg).
BSV and BOV were assumed as log‐normally distributed and are reported here as approximate CV%.
This parameter has the same value for both S and P.
Figure 2.
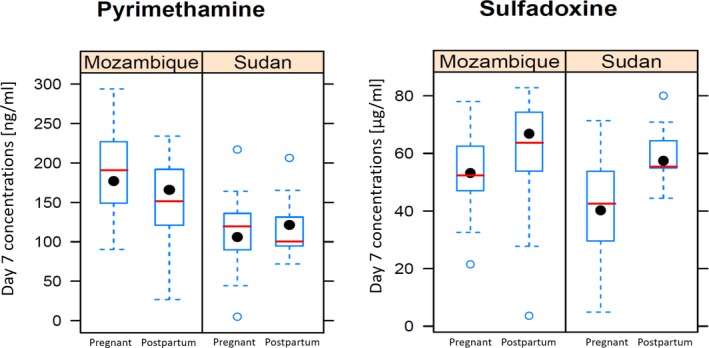
Observed day 7 concentrations in the Sudan and Mozambique sites for the pregnant and postpartum women. The boxplot summarises the observed concentrations, while the model predicted median concentrations are shown as a red line.
References
- 1. de Kock, M. et al Pharmacokinetics of sulfadoxine and pyrimethamine for intermittent preventive treatment of malaria during pregnancy and after delivery. CPT: Pharmacometrics Syst. Pharmacol. 6, 430–438 (2017). [DOI] [PMC free article] [PubMed] [Google Scholar]