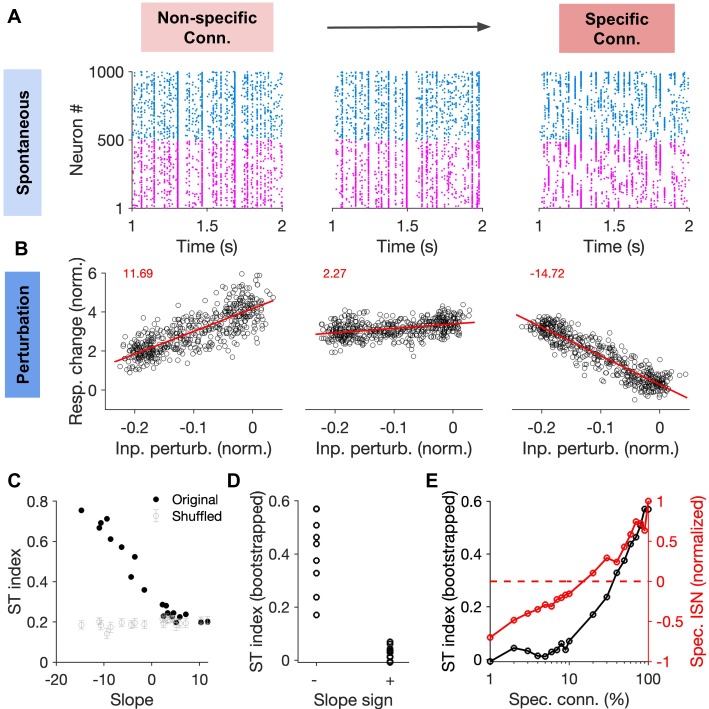
Figure 8. Correlation between specific paradoxical effects and spontaneous transitions between selective states.
(A) Sample raster plots of spiking activity from networks with different degree of specific EI connectivity (m = 0, 10, 100%, respectively). Networks and conventions are otherwise similar to Figure 6. (B) Normalized response change of inhibitory neurons as a function of the normalized change in their input due to patterned perturbations. Response changes (Resp. change) and input perturbations (Inp. perturb.) are normalized to the average firing rate and the average input in the baseline state, respectively. The network is simulated for 5s in the baseline state, and another 5s during patterned perturbation. Numbers in red denote the slope of the best fitted regression line to the data (red line). The procedure and conventions are otherwise similar to Figure 5C. (C) The ST index (as in Figure 7) as a function of the slope of perturbations for different networks (back dots). The mean and std of the ST index for shuffled activity (100 repetitions) are shown for comparison (grey). (D) The bootstrapped ST index for networks with negative (specific paradoxical effect) and positive (normal) slopes of perturbations. (E) Bootstrapped ST index and the normalized specific ISN effect (Spec. ISN) in networks as a function of feature-specific connectivity (m). Spec. ISN for each network is calculated by normalizing the slope of the perturbation by slope in the network with the maximum specific connectivity (m = 100%).

