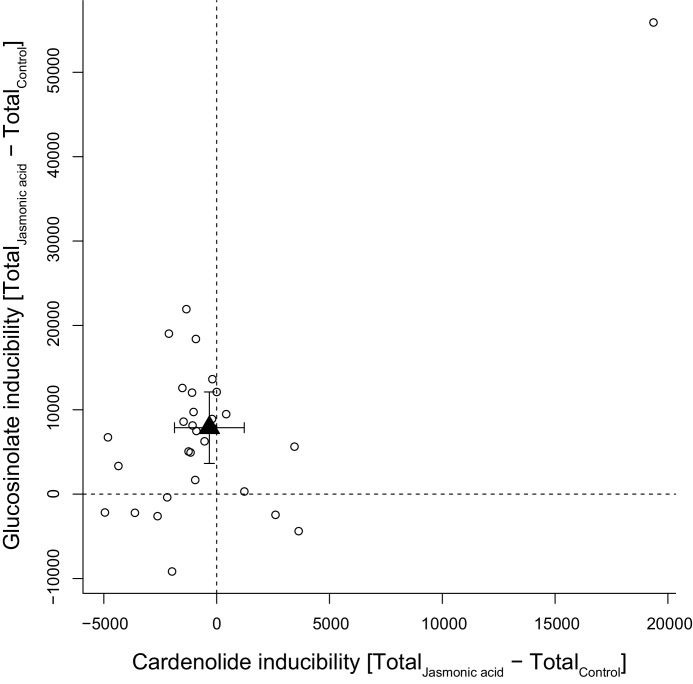
Figure 11. Inducibility of foliar glucosinolates and cardenolides in response to exogenous application of jasmonic acid (JA), expressed as absolute differences in total mass intensity between JA-treated and control plants.
Circles are species means, based on single pooled samples of multiple individual plants. The filled triangle is the average inducibility of all measured species with 95% confidence interval. Non-overlap with zero (dashed lines) corresponds to a significant effect. The species in the upper right corner is E. crepidifolium, an outlier and strong inducer of both glucosinolates and cardenolides.

