. 2020 Apr 7;9:e51712. doi: 10.7554/eLife.51712

Figure 2. Visualization of the E.cheiranthoides genome assembly.

(A) Circos plot of the E. cheiranthoides genome with gene densities (outer circle) and repeat densities (inner circle) shown as histogram tracks. Densities are calculated as percentages for 1 Mb windows. (B) Synteny plot of E. cheiranthoides and A. thaliana. Lines between chromosomes connect aligned sequences between the two genomes.

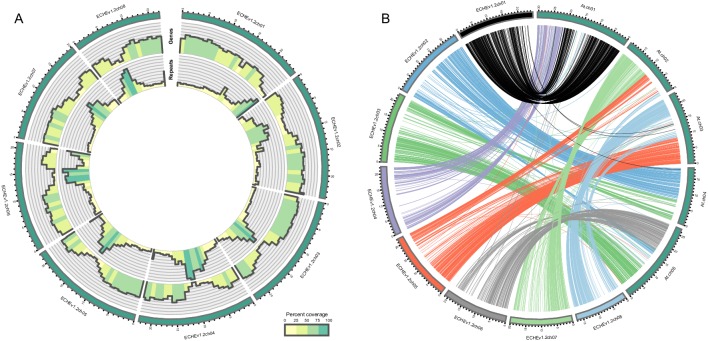
Figure 2.

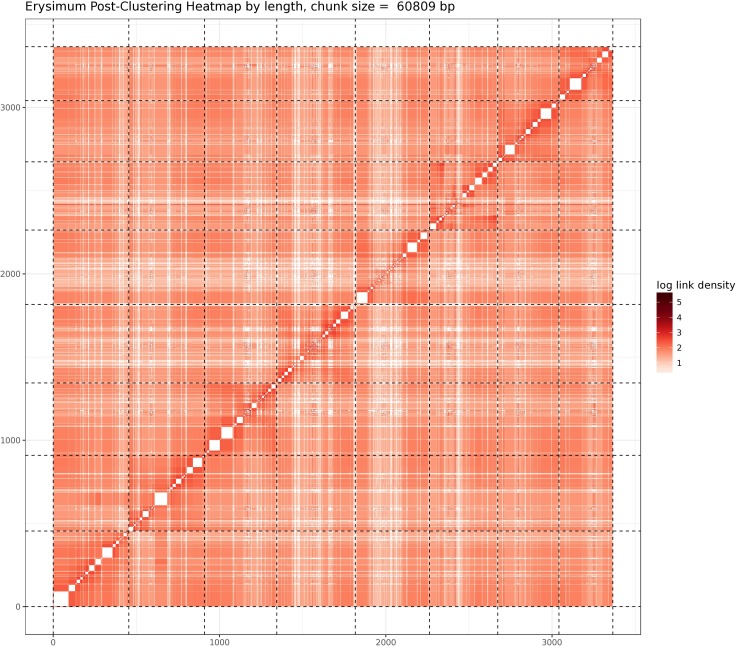
Figure 2—figure supplement 1. Post-clustering heatmap showing the density of Hi-C interactions between scaffolds used in the assembly.

Figure 2—figure supplement 1.

Intensity corresponds to the total number of reads per interaction. Dashed lines delimit the eight identified pseudomolecules.
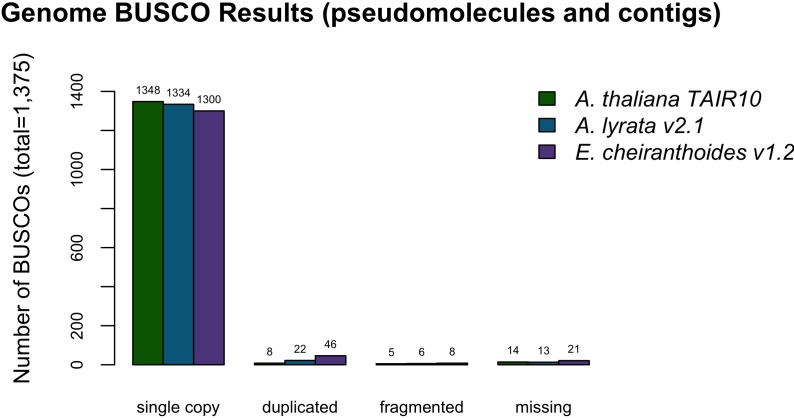
Figure 2—figure supplement 2. BUSCO completeness assessment for the EC1.2 genome assembly.

Figure 2—figure supplement 2.

A. thaliana and A. lyrata results are provided for comparison to the EC1.2 genome assembly.
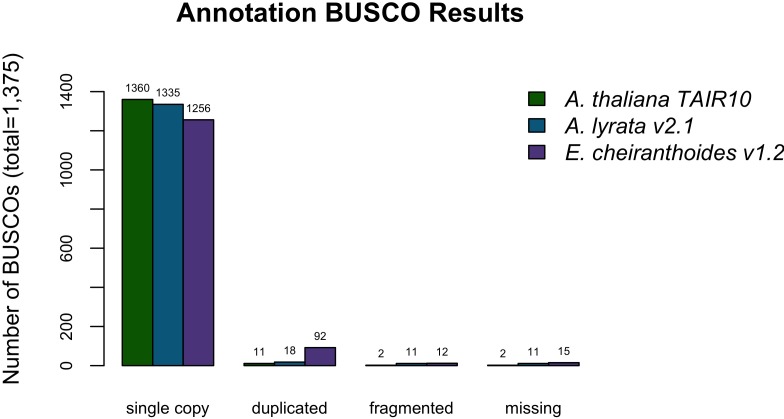
Figure 2—figure supplement 3. BUSCO completeness assessment for the EC1.2 genome annotation.

Figure 2—figure supplement 3.

A. thaliana and A. lyrata results are provided for comparison to the EC1.2 genome annotation.
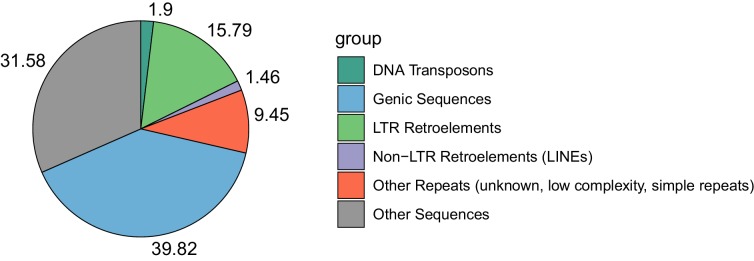
Figure 2—figure supplement 4. Proportional contributions of sequence classes to the genome sequence of E. cheiranthoides.

Figure 2—figure supplement 4.

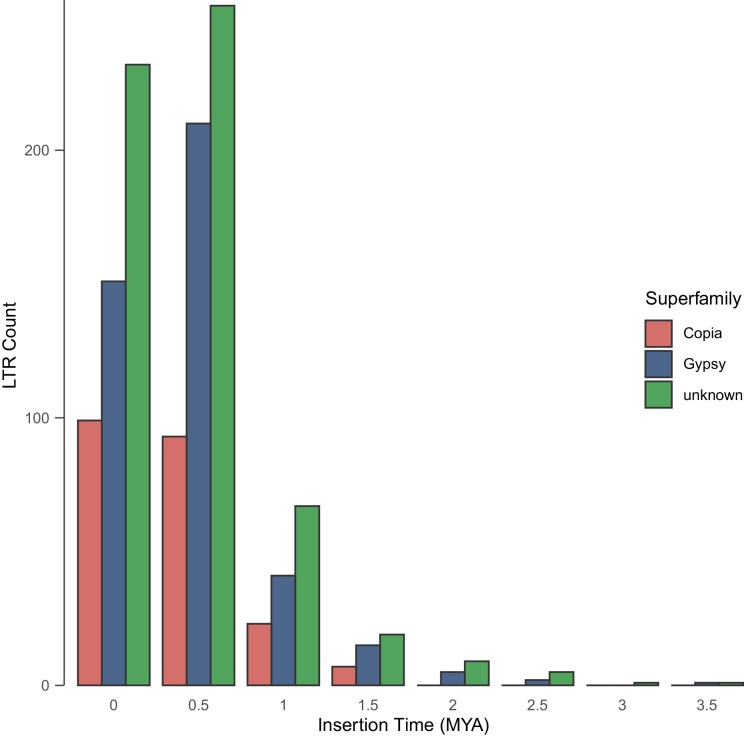
Figure 2—figure supplement 5. Age distributions of intact LTR-RTs identified by LTR_retriever in the genome of E. cheiranthoides.

Figure 2—figure supplement 5.