. 2020 Apr 7;9:e51712. doi: 10.7554/eLife.51712

Figure 3. Identification of known indole glucosinolate biosynthetic genes and glucosinolate-modifying genes from Arabidopsis in Erysimum cheiranthoides.

(A) Starting with tryptophan, indole glucosinolates are synthesized using some enzymes that also function in aliphatic glucosinolate biosynthesis (GGP1; SUR1; UGT74B1) while also using indole glucosinolate-specific enzymes. (B) Indole glucosinolates can be modified by hydroxylation and subsequent methylation. Red square brackets indicate where gene copy numbers differ between Arabidopsis and E. cheiranthoides. Glucosinolates with names highlighted in blue were identified in Erysimum cheiranthoides var. Elbtalaue. Abbreviations: cytochrome P450 monooxygenase (CYP); glutathione S-transferase F (GSTF); glutathione (GSH); γ-glutamyl peptidase 1 (GGP1); SUPERROOT 1 C-S lyase (SUR1); UDP-dependent glycosyltransferase (UGT); sulfotransferase (SOT); glucosinolate (GS); indole glucosinolate methyltransferase (IGMT).

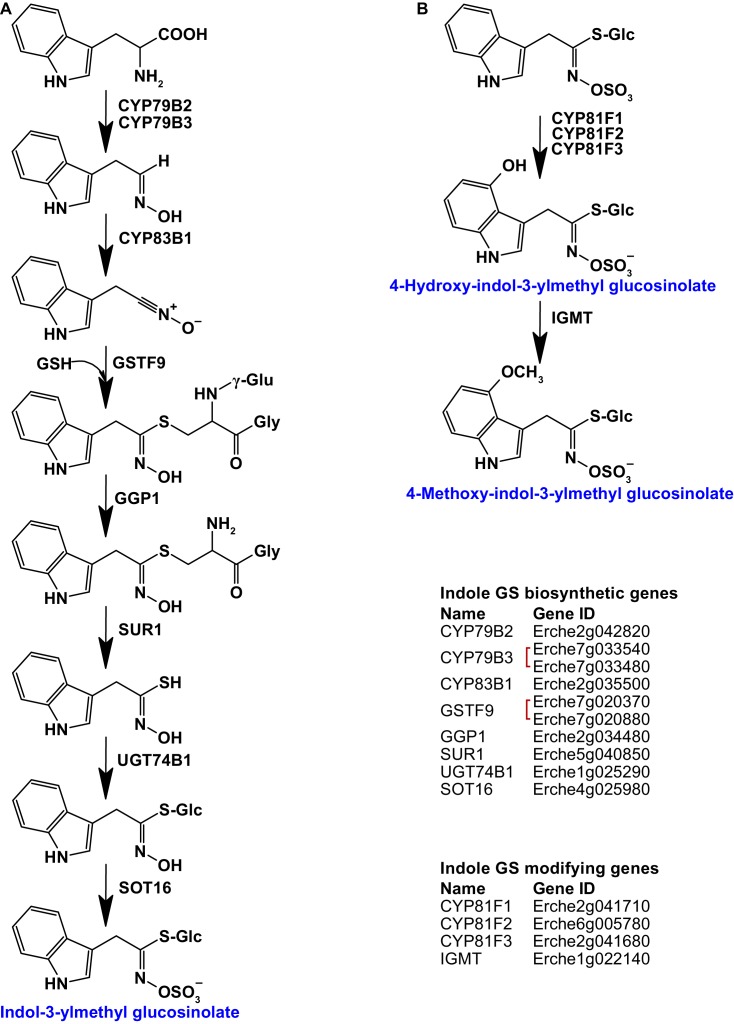
Figure 3.

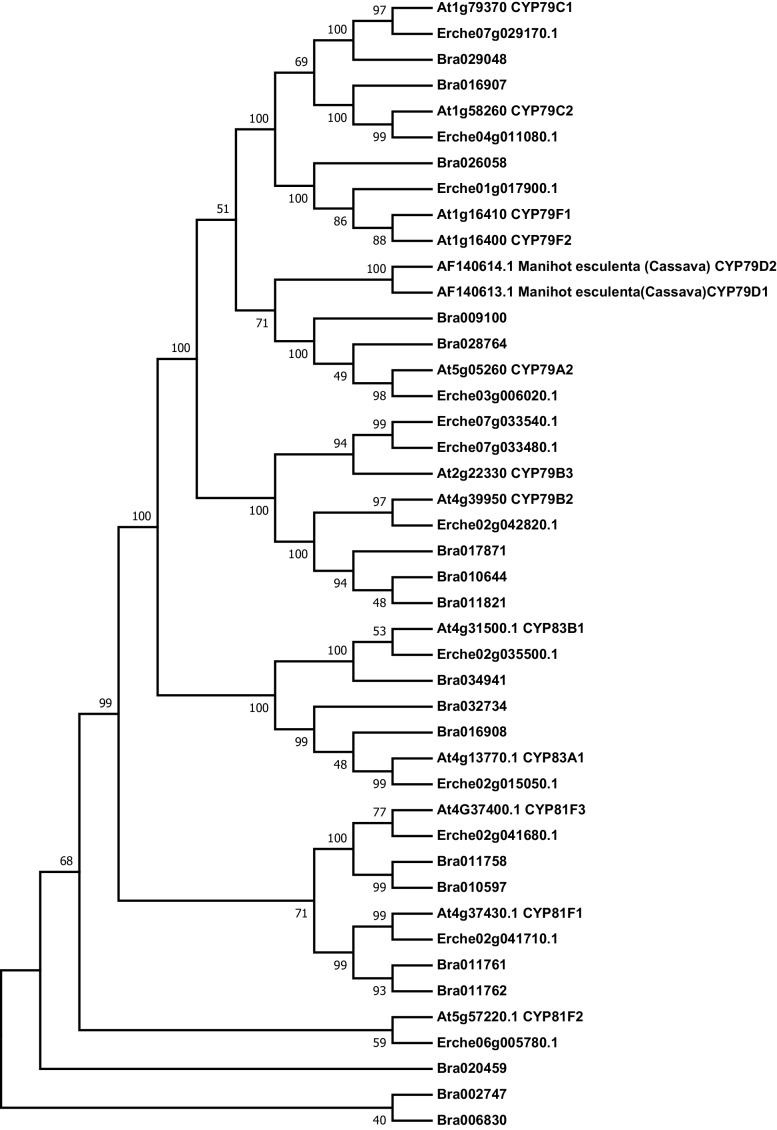
Figure 3—figure supplement 1. Phylogeny of cytochrome P450 monooxygenase (CYP) genes from E. cheiranthoides, A. thaliana, and B. oleracea.

Figure 3—figure supplement 1.

The tree was generated using the Hasegawa-Kishino-Yano model with evolutionary rates modelled by Gamma distribution with invariant sites with five rate categories.
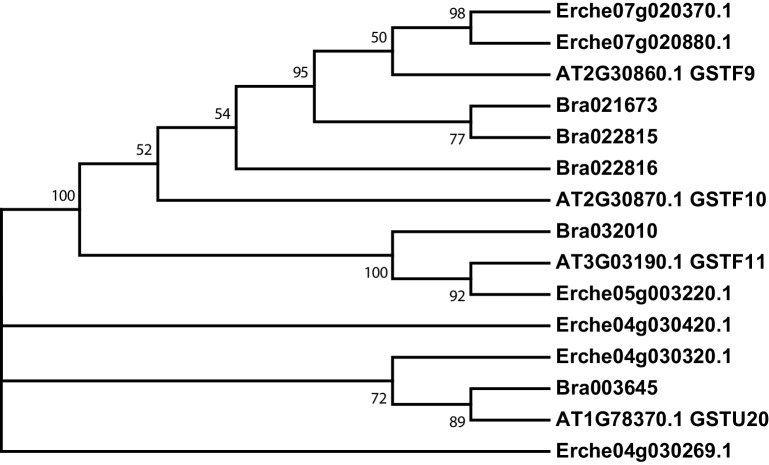
Figure 3—figure supplement 2. Phylogeny of glutathione S-transferase F (GSTF) and glutathione S-transferase Tau (GSTU) genes from E. cheiranthoides, A. thaliana, and B. oleracea.

Figure 3—figure supplement 2.

The tree was generated using the Kimura 2-parameter model with evolutionary rates modelled by Gamma distribution with five rate categories.
Figure 3—figure supplement 3. Phylogeny of γ-glutamyl peptidase 1 (GGP1) genes from E. cheiranthoides, A. thaliana, and B. oleracea.

Figure 3—figure supplement 3.

The tree was generated using the Kimura 2-parameter model with invariant sites.
Figure 3—figure supplement 4. Phylogeny of SUPERROOT 1 C-S lyase (SUR1) genes from E. cheiranthoides, A. thaliana, and B. oleracea.

Figure 3—figure supplement 4.

The tree was generated using the Kimura 2-parameter model with invariant sites.
Figure 3—figure supplement 5. Phylogeny of UDP-dependent glycosyltransferase (UGT) genes from E. cheiranthoides, A. thaliana, and B. oleracea.

Figure 3—figure supplement 5.

The tree was generated using the Tamura 3-parameter model with evolutionary rates modelled by Gamma distribution with five rate categories.
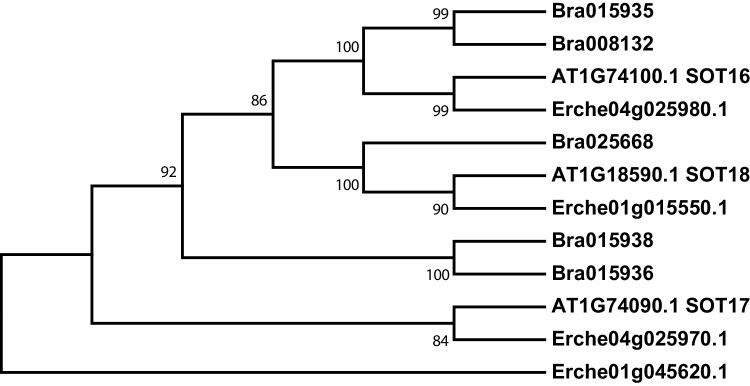
Figure 3—figure supplement 6. Phylogeny of sulfotransferase (SOT) genes from E. cheiranthoides, A. thaliana, and B. oleracea.

Figure 3—figure supplement 6.

The tree was generated using the Kimura 2-parameter model with evolutionary rates modelled by Gamma distribution with five rate categories.
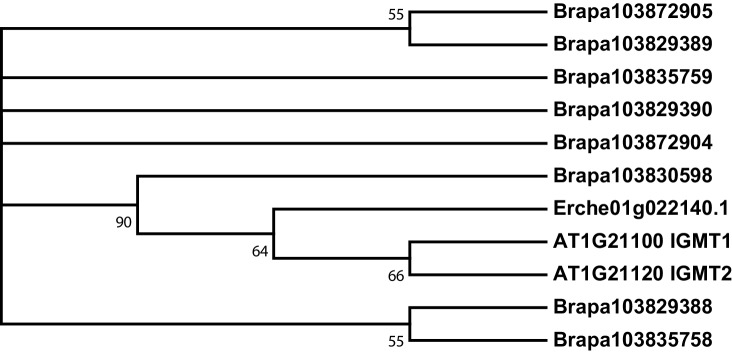
Figure 3—figure supplement 7. Phylogeny of indole glucosinolate methyltransferase (IGMT) genes from E. cheiranthoides, A. thaliana, and B. oleracea.

Figure 3—figure supplement 7.

The tree was generated using the Tamura 3-parameter model with evolutionary rates modelled by Gamma distribution with five rate categories.