Abstract
Purpose:
To evaluate the complex fiber orientations and three-dimensional collagen fiber network of knee joint connective tissues, including ligaments, muscle, articular cartilage, and meniscus using high spatial and angular resolution diffusion imaging.
Methods:
Two rat knee joints were scanned using a modified 3D diffusion-weighted spin echo pulse sequence with the isotropic spatial resolution of 45 μm at 9.4T. The b values varied from 250 to 1250 s/mm2 with 31 diffusion encoding directions for one rat knee. The b value was fixed to 1000 s/mm2 with 147 diffusion encoding directions for the second knee. Both diffusion tensor imaging (DTI) model and generalized Q-sampling imaging (GQI) method were used to investigate the fiber orientation distributions and tractography with the validation of polarized light microscopy (PLM).
Results:
In order to better resolve the crossing fibers, the b value should be great than or equal to 1000 s/mm2. The tractography results were comparable between DTI model and GQI method in ligament and muscle. However, the tractography exhibited apparent difference between DTI and GQI in connective tissues with more complex collagen fibers network, such as cartilage and meniscus. In articular cartilage, there were numerous crossing fibers found in superficial zone (SZ) and transitional zone (TZ). Tractography generated with GQI also resulted in more intact tracts in articular cartilage than DTI.
Conclusion:
High resolution diffusion imaging with GQI method can trace the complex collagen fiber orientations and architectures of the knee joint at microscopic resolution.
Keywords: DTI, cartilage, tractography, meniscus, MRI, GQI
Introduction
Magnetic resonance imaging (MRI) plays a vital role in the evaluation of traumatic and degenerative musculoskeletal lesions. It holds the potential to assess the morphological and compositional variations of early osteoarthritis (OA) (1–3). For instance, the delayed gadolinium-enhanced MRI of cartilage (dGEMRIC) method, based on T1 relaxation, has been used to quantify the negative charged glycosaminoglycan (GAG) content (4,5). T1rho relaxation is a promising technique to detect the GAG loss in early OA, because of its sensitivity to the interactions between motion-restricted water and the local macromolecular environment (6–8). The transverse relaxation time (T2) is associated to the anisotropic motion of water molecules mediated by the collagen orientation via dipolar interaction (9–11).
Although the individual relaxation time measurements exhibit the great sensitivity to either the collagen fiber orientation or the GAG content, the scalar metrics derived from diffusion tensor imaging (DTI) can be more readily to depict both the collagen architecture by fractional anisotropy (FA) and GAG concentration by mean diffusivity (MD) (12,13). In addition, diffusion based tractography has demonstrated the fiber pathways and anatomical connections in both human and animal central nervous system (CNS) (14–16). The application of DTI to musculoskeletal system has been growing recently but there are challenges for the knee joint, arising from the complex anatomy of knee joint, low FA values, and short T2/T2* values. DTI tractography has been used to detect the integrity of individual connective tissues, such as Achilles tendon, growth plate, and anterior cruciate ligament (ACL) graft in clinical scanners (17–20). Tractography of the articular cartilage in rat knee joint has also been reported with DTI at microscopic resolution (21).
A significant limitation of DTI is that it can only resolve the single fiber direction within each voxel and fails to accurately represent the complex architecture of crossing fibers (22). Both model-based and model-free methods have been developed to overcome this shortcoming, including spherical harmonic decomposition model, multiple Gaussian model, diffusion-kurtosis model, and spherical harmonic deconvolution model (23–28). Many of them are dependent on single shell or multi shell high angular resolution diffusion imaging (HARDI) acquisition protocol (29,30). The methods have been employed to estimate the fiber directions and used for tracking the individual pathway or the whole brain connectivity (27,31). Recently, the model-free generalized q-sampling imaging method (GQI) has been proposed to investigate the Fourier transform relationship between the diffusion MRI signals and the diffusion displacement of the spins (32). The spin distribution function (SDF) derived from GQI quantifies the density of diffusing water at different orientations and can be used to resolve the crossing fibers in CNS (32).
The crossing fiber problem has been extensively addressed in both human and animal CNS using diffusion MRI (dMRI), but probing the crossing fibers and tissue integrity in the complex structure of the knee has been limited. Articular cartilage is a very thin layer soft tissue and can be divided into three sub-structural zones according to the complex morphological structure and collagen fiber orientations: the superficial zone (SZ) with the collagen fibers parallel with the tissue surface, the transitional zone (TZ) with mostly random fibers, and the radial zone (RZ) with the perpendicular fibers anchored to the underlining bone (8,33). Whether dMRI can unravel the complex zonal fiber orientations and map the 3D collagen fiber network is still unknown. In this study, we investigated the fiber orientations in various soft tissues of knee, including articular cartilage, meniscus, muscle, and ligaments at both high spatial resolution (45 μm) and angular resolution (147 gradient encoding directions). The complex 3D collagen fiber networks generated by diffusion based tractography were compared using different models (GQI and DTI).
Methods
Specimen Preparation
All animal preparation protocols were approved by the local institutional animal care and use committee (IACUC). Two knee joints were harvested shortly after sacrifice from two mature, healthy rats. The specimens were stained by immersion in a PBS solution of 0.5% Prohance (Bracco Diagnostics Inc., Princeton, NJ) to shorten T1 (to about 110 ms) and reduce scan time (21).
Microscopic MRI (μMRI) Protocols
The specimens were scanned at 9.4 T Oxford 8.9-cm vertical bore magnet (Agilent VnmrJ 4.0 imaging console) with maximum gradient strength of 2000 mT/m on each axis. Each specimen was fitted in an acrylic holder and then placed in a homemade solenoid RF coil (~ 3.0 cm × 1.3 cm × 1.3 cm) for MRI scans. A modified 3D Stejskal-Tanner diffusion-weighted spin-echo pulse sequence was used with under sampling the phase dimensions by 4 times (21). The varied density k-space sampling pattern was illustrated in Supporting Information Figure S1 (34). The k-space points were fully sampled in the center of k-space (radius of about 16 pixels) and became gradually sparse with distance to the k-space center.
There were two protocols used in the current study: 1) multi-shell scan: matrix size = 400 × 256 × 256, FOV = 18 × 11.52 × 11.52 mm3, 45 μm isotropic spatial resolution, TE = 9.1 ms, TR = 100 ms, 5 b values (250, 500, 750, 1000, and 1250 s/mm2) with the same 31 diffusion gradient encoding directions and 3 non-diffusion-weighted (b0) measurements at each b value (21). The scan time was 15.4 hours for each b value. 2) Single-shell scan protocol: matrix size = 400 × 256 × 256, FOV = 18 × 11.52 × 11.52 mm3, 45 μm isotropic spatial resolution, TE = 9.1 ms, TR = 100 ms, 147 unique diffusion directions with b value of 1000 s/mm2 and 15 non-diffusion-weighted (b0) measurements. The scan time was about 73.4 hours. The diffusion gradient orientations (distributed over half sphere) were optimized to ensure the uniformity of encoding directions on the shell (Supporting Information Figure S2). The gradient separation time was 4.6 ms and the diffusion gradient duration time was 2.5 ms for all scans. The readout bandwidth was 62.5 kHz. The maximum gradient amplitude was about 1.33 T/m. Temperature was monitored throughout all the scans and the fluctuation was less than 1 °C. The maximum variation of DWIs signal (b0) is about ~ 4.0 % in muscle and cartilage during the scans without notable signal drift (Supporting Information Figure S3).
Compressed Sensing (CS) Reconstruction
Reconstruction of the under sampled k-space data by minimizing the following function (21,34):
| (1) |
where x is the image and y is its corresponding k-space, F is the FFT, Ψ is the wavelet sparse transform, λ1 and λ2 are weighting factors, and TV is the total variation. The CS reconstruction was performed slice-by-slice in two phase dimensions with 200 iterations for each slice after performing FFT in readout direction. λ1 equals 0.0012 for the sparse solution and λ2 equals 0.006 for the data consistency. The images are reconstructed independently at each b value for multi-shell scan protocol.
Data Processing for DTI and GQI
All the diffusion-weighted images (DWIs) were registered to the baseline images (b0) to correct eddy currents using linear affine registration. The DTI model was used to characterize the primary diffusion direction of the fiber in different connective tissues of knee. The scalar indices including FA, MD, axial diffusivity (AD), and radial diffusivity (RD) were also calculated. The GQI method was used to quantify the diffusing water at different orientations (32) and the scalar metrics derived from GQI included quantitative anisotropy (QA), normalized quantitative anisotropy (NQA), color-QA, and isotropic comoponent (iso) (32). The major difference was GQI can resolve the crossing fibers in each voxel, while DTI only gave the primary fiber orientation. Deterministic fiber tracking was perfomed on the selected region of interestes (ROIs) in cartilage, meniscus, muscle, and ACL. The propagation direction was calculated by applying trilinear interpolation on the fiber orientations provided from neighborhood voxels. The next point was then determined by moving in the propagation direction 0.02 mm. The propagation process was repeated until the tracking trajectory exceeded either a turning angle greater than 45°, or the anisotropy value of the current position was below a predefined threshold (FA and NQA, ranging from 0.01 – 0.1). All fiber tracking operations were performed using DSI studio toolbox (32). For the single-shell scan (Protocol 2), both DTI and GQI were used for resolving fiber orientations and tractography; for the multi-shell scan (Protocol 1), only GQI was used to map the fiber orientations in cartilage to evaluate the effect of b values.
Simulation Study
To validate the accuracy of GQI for crossing fibers in both cartilage and meniscus, a mixed Gaussian model consisting of a component of isotropic diffusion and two fiber populations are based on the following equation (25):
| (2) |
Where b vand v are the b value and the unit vector of the applied diffusion gradient, f1 and f2 are the volume fractions of the two fiber populations, and f0 is the volume fration of the isotropic diffusion. D0, D1, and D2 are the diffusion tensor matrices for these three diffusion components. The SNR values, FA values, and MD values are obtained by the ROI-based measurments. In particular, the SNR is measured using two-region approach: One is localized in the tissue region (ligament, cartilage, meniscus, or growth plate) for signal measurement and the other is localized in the object-free region for thel noise measurement. The b value (1000 s/mm2) and b vectors (147 directions) are derived from the single-shell scan (Supporting Information Figure S2). The Rician noise is added to the make the SNR values of 43.0 for cartilage and 18.0 for meniscus. The fiber orientations with much higher SNR (300) for both cartilage and meniscus are also simulated for comparison.
Polarized Light Microscopy (PLM)
After Microscopic MRI scanning, specimens were fixed in neutral buffered formalin 3 days, rinsed in phosphate buffered saline (PBS), and then decalcified in 14% ethylenediaminetetraacetic acid tetrasodium salt dihydrate (EDTA) for 14 days. Following decalcification, samples were dehydrated through a graded series of alcohols and processed for paraffin embedding and sectioning. Histological 5–8 μm thick slices were stained for Alcian blue/Picrosirius red staining using established protocols (35). Imaging of stained tissue sections was performed via polarized light microscopy (PLM) using a Leica DM 2000 microscope with polarizing filters.
Results
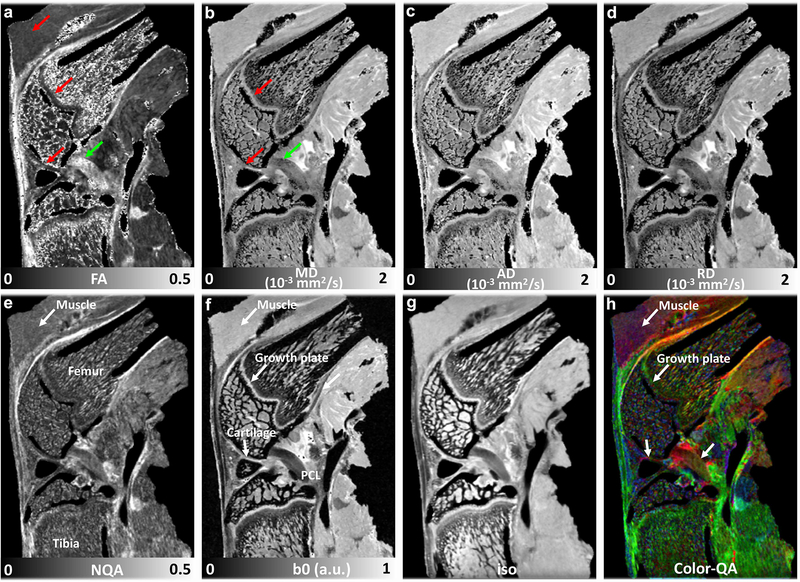
Figure 1 illustrates the representative DTI metrics (FA, MD, AD, and RD, a-d), b0 image (f), and GQI metrics (NQA, iso-component, and Color-QA, e, g, h) with the b value of 1000 s/mm2 at both high spatial resolution (45 μm isotropic) and high angular resolution (147 DWIs). The image intensity variations of different connective tissues are apparent in b0 image (f), where posterior cruciate ligament (PCL) exhibits lower signal intensity than muscle, growth plate, and cartilage (white arrows, f). Compared to PCL (green arrow, a), the FA values are lower in muscle, growth plate, and articular cartilage (red arrows, a). In contrast, the MD values are higher in muscle, growth plate, and articular cartilage (red arrows, b) than PCL (green arrow, b). Different connective tissues can also be distinguished in the Color-QA images according to the different fiber orientations (h).
Figure 1.
The representative b0 image (f), DTI metrics (FA, MD, AD, and RD, a-d) images and GQI metrics (NQA, iso, and Color-QA, e, g, h) images with the b value of 1000 s/mm2 at 45 μm isotropic resolution (protocol 2). The image intensity variations of different connective tissues are apparent in b0 images (f). Compared to PCL (green arrow, a), the FA values are lower in muscle, growth plate, and articular cartilage (red arrows, a). Compared to PCL (green arrow, b), the MD values are higher in muscle, growth plate, and articular cartilage (red arrows, b). Different connective tissues can also be distinguished in the Color-QA images due to different fiber orientations (h).
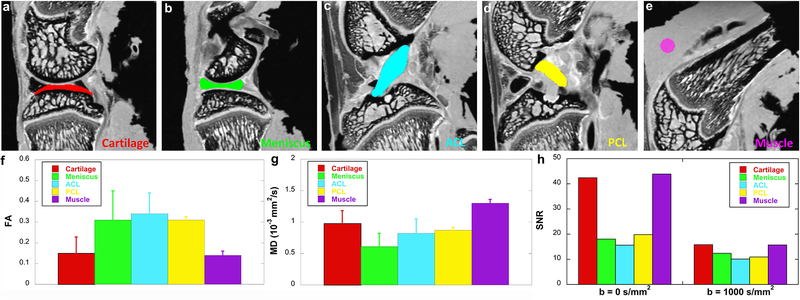
Figure 2 shows the FA, MD, and SNR values (f-h) at different connective tissues, including cartilage, meniscus, ACL, PCL, and muscle. These values are derived from the ROIs delineated in b0 images (a-e) by different colors. Meniscus and ligaments have higher FA values (~ 0.3) than muscle (~ 0.14) and cartilage (~ 0.15), while muscle (~ 1.3 x 10⁻³ mm2/s) and cartilage (~ 1.0 x 10⁻³ mm2/s) show higher MD values than meniscus and ligaments. Both cartilage and muscle exhibit higher SNR values than meniscus and ligaments at both b = 0 s/mm2 (b0) and b = 1000 s/mm2 (h). The SNR values in the superficial zone of cartilage are 51.4 at b = 0 s/mm2 and 20.0 at b = 1000 s/mm2; the SNR values in the deep zone of cartilage are 35.4 at b = 0 s/mm2 and 13.3 at b = 1000 s/mm2
Figure 2.
The FA, MD, and SNR values at different connective tissues, including cartilage, meniscus, ACL, PCL, and muscle. These values are derived from the ROIs delineated in b0 images (a-e) by different colors. Meniscus and ligaments have higher FA values (f) than muscle and cartilage, while muscle and cartilage show higher MD values than meniscus and ligaments (g). Both cartilage and muscle exhibit higher SNR values than meniscus and ligaments at both b = 0 s/mm2 (b0) and b = 1000 s/mm2 (h).
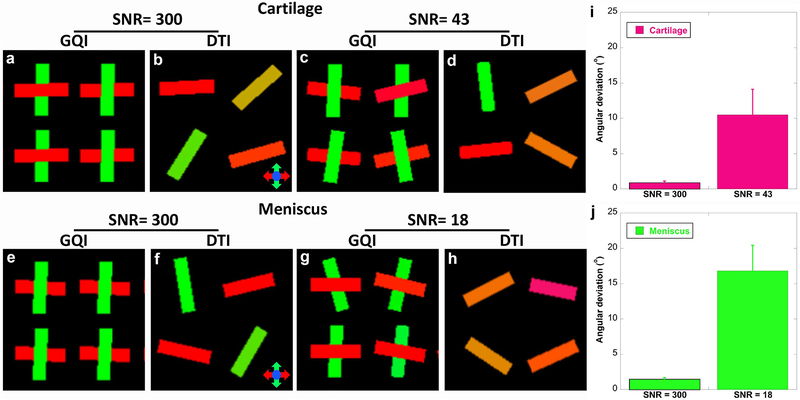
In order to assess the performance of DTI and GQI methods for detecting fiber orientations, simulation results at both low SNR (43 for cartilage and 18 for meniscus, derived from Figure 2h) and high SNR (300 for both cartilage and meniscus) are shown in Figure 3. The FA and MD values are also obtained from the ROI-based measurements in Figure 2f–2h. First, DTI only shows single fiber orientation in each voxel and the fiber orientation is randomly distributed even with SNR of 300 (b, d, f, and h). On the contrary, GQI is able to resolve the crossing fibers at both high and low SNRs (a, c, e, g). At SNR of 300, the angular deviations are less than 2° in both cartilage and meniscus. The angular deviations become to 10.5° at the SNR of 43 for cartilage (i) and 16.8° at the SNR of 18 for meniscus (j).
Figure 3.
The simulation results at both low SNR and high SNR to assess the performance of DTI and GQI methods for detecting crossing fibers. The SNR, FA and MD values are obtained from the ROI-based measurements in Figure 2f–2h. DTI only shows the primary fiber orientation in each voxel and the fiber orientation is randomly distributed (b, d, f, and h). GQI resolves the crossing fibers at both high and low SNR values (a, c, e, g). The angular deviations become higher with lower SNR (j).
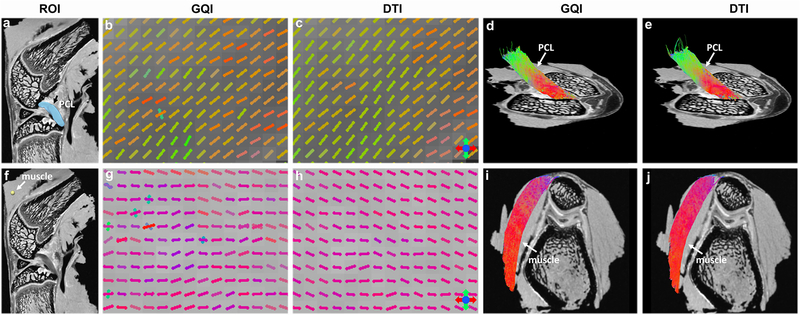
Figure 4 shows the DWI images (a, f), fiber orientation images (b-c, g-h), and the corresponding tractography results (d-e, i-j) of ACL and muscle. The ROIs of ACL (black arrow, a) and muscle (white arrow, f) in DWI images are used for tractography. The fiber orientations derived from GQI and DTI show visually consistent in both ACL and muscle, where few crossing fibers can be observed. The tractography results are also comparable between GQI and DTI in these two connective tissues.
Figure 4.
The DWI images (a, f), fiber orientation images (b-c, g-h), and the corresponding tractography results (d-e, i-j) from the single-shell acquisition (protocol 2). The ROIs for ACL and muscle tractography are shown in DWI images. Both GQI and DTI models show similar fiber orientations in each voxel, where few crossing fibers are unraveled. The tractography results are visually comparable between GQI and DTI in both muscle and ACL.
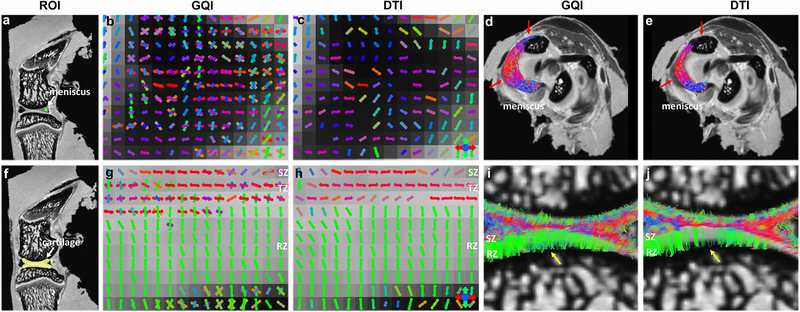
Figure 5 depicted the DWI images (a, f), fiber orientation images (b-c, g-h), and the corresponding tractography results (d-e, i-j) of meniscus and articular cartilage. The ROIs of meniscus and cartilage for tractography are shown in DWI images (a, f). Compared to DTI, there are numerous crossing fibers existing in meniscus using GQI (b). The following tractography yields more intact tracts (red arrows, d) than DTI (red arrows, e). Crossing fibers are also explicit in SZ and TZ of articular cartilage by GQI (g), but minimal in RZ. However, only the major fiber orientation can be resolved by DTI model (h). The tractography in articular cartilage by GQI also exhibits more intact tracts than DTI (yellow arrows, i-j), which is similar to the tractography results found in meniscus.
Figure 5.
The DWI images (a, f), fiber orientation images (b-c, g-h), and the corresponding tractography results (d-e, i-j) of meniscus and articular cartilage from the single-shell acquisition (protocol 2). The ROIs for muscle and ACL tractography are shown in DWI images. Compared to DTI, there are numerous crossing fibers existing in meniscus using GQI. The subsequent tractography yields more intact tracts (red arrows, d-e). Crossing fibers are shown in the SZ and TZ in cartilage by GQI, while the crossing fibers in RZ are minimal. The tractography in articular cartilage by GQI also exhibits more intact tracts than DTI, which is similar to meniscus.
Figure 6 demonstrates the tractography results at different anisotropy (NQA or FA) thresholds in articular cartilage. The cartilage region is enlarged in DWI image (a). Tractography by GQI (e-g) always shows more intact tracts than DTI (red arrows, b-d) at the same anisotropy threshold. The tracts become sparser with higher anisotropy threshold (red arrows) for both DTI and GQI. Compared to GQI tractography, more tracts from RZ are terminated in TZ (yellow arrows, d) using DTI model. The quantitative tract length (h) gradually decreases with higher anisotropy threshold for both DTI and GQI, while GQI shows higher tract length than DTI at the same anisotropy threshold.
Figure 6.
The tractography results at different anisotropy (NQA or FA) thresholds in articular cartilage from the single-shell acquisition (protocol 2). The cartilage region is enlarged in the DWI image (a). Tractography by GQI (red arrows, e-g) always shows more intact tracts than DTI (red arrows, b-d) at the same anisotropy threshold. Most tracts from RZ are terminated in TZ (yellow arrows, d and g) with higher FA using DTI. The quantitative tract length (h) gradually decreases with higher anisotropy threshold for both DTI and GQI, while GQI shows higher tract length than DTI at the same anisotropy threshold.
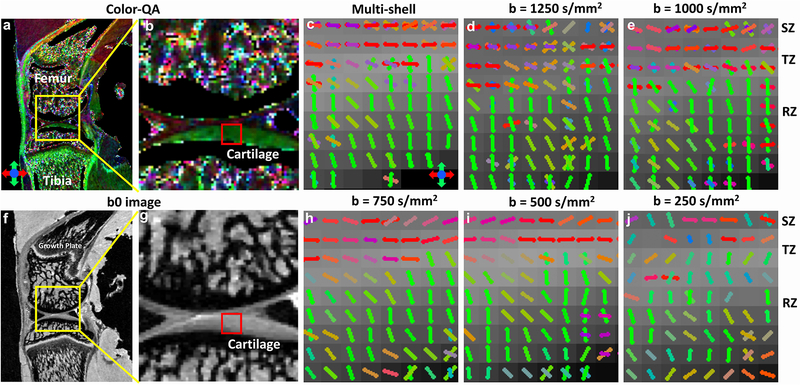
To examine the effect of b values on the resolution of crossing fibers, the Color-QA (a-b), b0 images (f-g) and the fiber orientation images (c-j) of articular cartilage at different b values (250 – 1250 s/mm2) using GQI method from the multi-shell acquisition are shown in Figure 7. The superficial zone and radial zone are well distinguished in Color-QA images by the distinct fiber orientations: parallel to the cartilage surface in SZ (red color) and perpendicular to the cartilage surface in RZ (green color). The fiber orientation images from the multi-shell data (c, GQI with all the b values) also show the similar fiber orientations in SZ and RZ. The crossing fibers are more evident in the cartilage regions with b value higher than 750 s/mm2, mainly in the SZ and TZ. When the b value is lower than 750 s/mm2, few crossing fibers can be unraveled through the whole cartilage thickness.
Figure 7.
Color-QA (a-b), b0 images (c-d) and the fiber orientation images (c-j) of articular cartilage at different b values using the multi-shell acquisition (protocol 1) The superficial zone and radial zone are well distinguished in Color-QA images by the distinct fiber orientations. Cartilage fiber orientation in the radial zone (green sticks) is perpendicular to the superficial zone (red sticks). The fiber orientations images from the multi-shell data also show the similar results. There are more crossing fibers in the cartilage regions with b value higher than 750 s/mm2. When the b value is lower than 750 s/mm2, few crossing fibers can be resolved through the whole cartilage thickness.
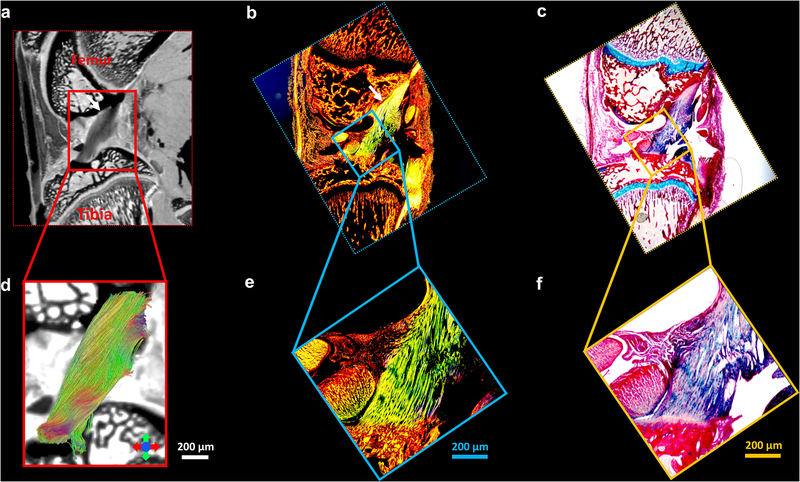
Figure 8 illustrates the Alcian blue/Picrosirius red stain (c, f) and PLM images (b, e) of ligament, the b0 image (a), and the corresponding tractography results (d). The ligaments are indicted by the white arrows (a-c) and enlarged in Figure 8d–8f. The collagen fiber orientation in ligament is relatively uniform, which is consistent with the tractography findings (d).
Figure 8.
The Alcian blue/Picrosirius red stain (c, f) and PLM images (b, e) of ligament, the b0 image (a), and the corresponding tractography results (d). The ligaments are indicted by the white arrows (a-c) and enlarged in Figure 8d-8f. The collagen fiber orientation in ligament is relatively uniform, which is consistent with tractography findings.
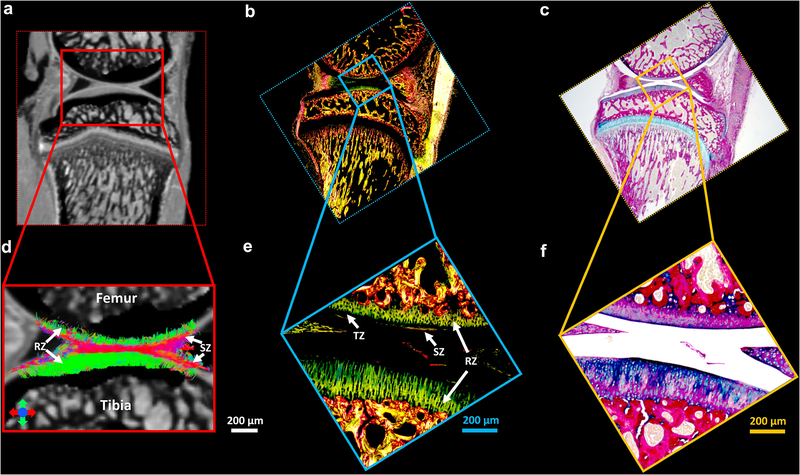
Figure 9 shows the Alcian blue/Picrosirius red stain (c, f) and PLM images (b, e) of articular cartilage, the b0 image (a), and the corresponding tractography results (d). The cartilage region is enlarged in Figure 9d–9f. The RZ of articular cartilage exhibits the highest intensity in PLM images, while TZ has the lowest intensity (e, white arrows), probably due to the relatively isotropic fiber distributions in TZ. The collagen fiber orientation in RZ from PLM is found to be perpendicular to the surface of the cartilage in both femur and tibia, which agrees with the tractography results (d, white arrows).
Figure 9.
The Alcian blue/Picrosirius red stain (c, f) and PLM images (b, e) of articular cartilage, the b0 image (a), and the corresponding tractography results (d). The cartilage region is enlarged in Figure 9d-9f. The RZ of articular cartilage exhibits the highest intensity in PLM images, while TZ has the lowest intensity (e, white arrows). The collagen fiber orientation in RZ from PLM is found to be perpendicular to the surface of the cartilage in both femur and tibia, which agrees with the tractography results (d, white arrows).
Discussion
DTI has become a powerful tool for delineating axonal tracts within the CNS by capturing the local diffusion phenomenon of water molecules (14). However, DTI fails to accurately represent the complex architecture of crossing white matter fibers. HARDI, capable of discriminating multiple fiber populations crossing within the same voxel, has been developed for fiber tracking and brain structure connectivity in both human and animal studies (23,30). The use of HARDI with high spatial resolution to probe the complex collagen fiber orientations in cartilage and meniscus is still limited. In this study, we investigated the collagen fiber orientation distributions and 3D fiber networks of the whole knee joint, including ligaments, articular cartilage, muscle, and meniscus using both the basic DTI model and a higher order GQI method.
The meniscus, a fibrocartilaginous cartilage, has a unique collagen structure orientation with three different layers (superficial, the lamellar, and deep layer) (36). Both superficial layer and lamellar layer contain randomly orientated collagen fibers, while the deep layer consists both circumferentially oriented fibers and a small amount of fibers oriented radially (36). This high-ordered structure has been well studied using scanning electron microscopy and polarized light microscopy (PLM) (36–38). Although these methods afford higher spatial resolution than MRI, they are destructive and the images are often presented in 2D instead of 3D. Alternatively, dMRI allows one to observe the tissue microstructure nondestructively leveraging the unique water molecular diffusion properties. The complex crossing fibers existing in meniscus illustrate the complex collagen fiber networks and may help to understand its intrinsic functions for shock absorption, force transmission, and stability within the knee joint (39). dMRI may help visualize complex meniscal tears that are challenging with conventional imaging, and the tractography further helps to visualize the ultrastructure and probe the integrity of the soft tissue.
Articular cartilage also has a zonal architecture determined by the alignment of its collagen fibers, which plays a critical role in the biomechanical functions and morphological properties of the tissue as a load-bearing material in joints (40–42). PLM has been used to study the alignment of collagen fibers in cartilage and remains the standard of reference (43). However, the birefringence derived from PLM can be affected by the collagen fiber orientations, thickness, and density. There is significant interest in developing non-destructive imaging techniques (such as MRI) for the observation of microstructure and molecular integrity of cartilage (21,44). Among the quantifiable parameters in MRI, the anisotropy of T2 relaxation is particularly important because of its sensitivity to the collagen fiber structure and orientation (45,46). The use of T2 to quantitatively monitor the collagen distributions in cartilage requires the rotation of the tissue block respect to the main magnetic field and the complicated modeling of the anisotropy of T2 at different orientations (45). In a recent study, Wei et al. demonstrated that susceptibility tensor imaging (STI) can characterize the orientation variation of collagen fibers in cartilage (47). However, STI also requires acquisition of phase images at different angles with respect to the main magnetic field, which may limit its clinical application, especially for high angular resolution studies.
DTI, as a non-destructive imaging modality, has been performed to investigate the collagen fiber orientation in articular cartilage (43). The first eigenvector (EV) derived from DTI model likely reflects the predominant orientation of the collagen fibers and is correlating with the orientation of polarization in PLM (48). This has also been confirmed by a recent DTI tractography study, where the collagen fibers are aligned parallel to the cartilage surface in SZ and become perpendicular to the cartilage surface in the RZ (21). Compared to DTI, the GQI results in the current study clearly show distinct crossing fibers in SZ and TZ. The tractography is also benefitted by the capability of resolving the crossing fibers, where more continuous and intact tracts from RZ to SZ are observed.
In the present dMRI scans (TE of 9.1 ms), articular cartilage shows higher signal intensity than ligaments and meniscus but has lower FA values, and thus requires higher angular resolution for delineating the fiber orientations (21). While the exhaustive dataset acquired with 147 DWIs exceeds recommendations (45 DWIs) to fully characterize the diffusion-weighted signal (49,50), it provides a foundation for exploration of the 3D pattern of water diffusion in SZ and TZ more accurately. In general, applying diffusion MRI for the knee joint is technically challenging due to the short T2 relaxation times, magic angle effect, complex anatomy, and the presence of multiple tissue types. However, the capability of revealing the complicated 3D collagen network in cartilage and meniscus suggest the importance of high spatial resolution, high angular resolution, high b value, and short TE for knee joint studies using dMRI.
It is well known that biological tissues frequently contain different water compartments (51,52). There are two components found in menisci using biexponential T2* fitting, where the T2* value of the short component is about 0.82 ms and the T2* value of the long component is about 15 ms at 3T (51). The bi-exponential short and long T2 relaxation times were 4.2 ms and 30.4 ms in skeletal muscle at 3T (53,54). The short T2* component has also been demonstrated in human cartilage using UTE bi-component analysis (55,56). TE of 9.1 ms in the current preclinical study is much shorter than traditional clinical DTI studies (18,19). However, this TE value is still too long to capture the short T2/T2* components in the connective tissues, and thus, the fiber orientations and tractography are mostly contributed from the long T2/T2* component. Combining short TE acquisition strategies to reduce the echo time may help to capture the diffusion properties from the short T2/T2* component and achieve better image quality due to the SNR increase (56). Higher SNR can also reduce the estimation errors of fiber orientations, which has been demonstrated in the simulation results.
The specimens were equilibrated in the Gd ion solution to reduce the T1 relaxation time and the total scan time, the scan time would increase dramatically without Gd administration. However, the scan time is still relatively long in order to probe the zonal architecture in articular cartilage at microscopic spatial resolution. The scan time may become even longer with higher angular resolution in order to unravel the crossing fibers more accurately. An acceleration factor of 4.0 means the acquisition time is 1/4th the scan time for a fully sampled dataset. For example, the scan time for protocol 1 (details in Microscopic MRI protocol) took 15.4 hours at each b value, the scan time for the fully sampled dataset would take 15.4 × 4 = 61.6 hours (~ 2.6 days). The scan time for protocol 2 took about 73.4 hours, the scan time for the fully sampled dataset would take 73.4 × 4 = 293.6 hours (~ 12.2 days).
There are a few limitations in our study. First, CS was only performed in k-space in this study, under sampling in q-space may further reduce the scan time. Another limitation is the long TE (9.1 ms) for the current 3D diffusion pulse sequence, which does not measure the diffusion properties of water molecules with short T2 values. To achieve both high spatial and angular resolution, the sample size is relatively small due to the extremely long scan time. In addition, only healthy rat knees were used to probe the crossing fibers in different connective tissues, detecting fiber orientation alterations in OA models are warranted in future studies.
In summary, this study demonstrated that high spatial and angular resolution diffusion imaging with GQI model can nondestructively characterize the complex collagen fiber orientations and architectures of articular cartilage and meniscus at microscopic resolution. The capability of resolving crossing fibers in different connective tissues may address critical questions about knee diseases related to the alignment of the collagen fibers. It may offer a powerful tool for tissue pathology evaluation and more effective tissue engineering approach.
Supplementary Material
Supporting Information Figure S1. The varied density k-space sampling pattern for under sampling in both phase dimensions.
Supporting Information Figure S2. The diffusion encoding directions for two MRI scan protocols: 1) 31 DWIs with varied b value from 250 s/mm2 to 1250 s/mm2; 2) 147 DWIs with b value of 1000 s/mm2.
Supporting Information Figure S3. The maximum variation of DWIs signal (b0) is about ~ 4.0 % in muscle and cartilage during the scans without notable signal drift for the 3-day dMRI acquisition.
Acknowledgments
This work was supported by the NIH/NIBIB National Biomedical Technology Resource Center P41 EB015897 (to GA Johnson), NIH 1S10OD010683-01 (to GA Johnson), NIH 1R01NS096720-01A1 (to GA Johnson), 5R01AR063071-07 (to MJ Hilton), and Charles E. Putman MD Vision Award of the Department of Radiology, Duke University School of Medicine (to Nian Wang and Charles E. Spritzer). The authors thank Tatiana Johnson for editorial comments on the manuscript. The authors thank James Cook, and Lucy Upchurch for significant technical support.
Grant Support: NIH P41 EB015897, 1S10OD010683-01, 1R01NS096720-01A1, 5R01AR063071-07
Footnotes
Supporting Information
Additional supporting information may be found online in the Supporting Information section at the end of the article.
References
- 1.Crema MD, Roemer FW, Marra MD, Burstein D, Gold GE, Eckstein F, Baum T, Mosher TJ, Carrino JA, Guermazi A. Articular cartilage in the knee: current MR imaging techniques and applications in clinical practice and research. Radiographics 2011;31(1):37–61. [DOI] [PMC free article] [PubMed] [Google Scholar]
- 2.Subhawong TK, Jacobs MA, Fayad LM. Insights into quantitative diffusion-weighted MRI for musculoskeletal tumor imaging. AJR Am J Roentgenol 2014;203(3):560–572. [DOI] [PubMed] [Google Scholar]
- 3.Mesgarzadeh M, Schneck CD, Bonakdarpour A. Magnetic resonance imaging of the knee and correlation with normal anatomy. Radiographics 1988;8(4):707–733. [DOI] [PubMed] [Google Scholar]
- 4.Burstein D, Velyvis J, Scott KT, Stock KW, Kim YJ, Jaramillo D, Boutin RD, Gray ML. Protocol issues for delayed Gd(DTPA)(2-)-enhanced MRI (dGEMRIC) for clinical evaluation of articular cartilage. Magn Reson Med 2001;45(1):36–41. [DOI] [PubMed] [Google Scholar]
- 5.Wang N, Chopin E, Xia Y. The effects of mechanical loading and gadolinium concentration on the change of T1 and quantification of glycosaminoglycans in articular cartilage by microscopic MRI. Phys Med Biol 2013;58(13):4535–4547. [DOI] [PMC free article] [PubMed] [Google Scholar]
- 6.Du J, Carl M, Diaz E, Takahashi A, Han E, Szeverenyi NM, Chung CB, Bydder GM. Ultrashort TE T1rho (UTE T1rho) imaging of the Achilles tendon and meniscus. Magn Reson Med 2010;64(3):834–842. [DOI] [PubMed] [Google Scholar]
- 7.Li X, Han ET, Ma CB, Link TM, Newitt DC, Majumdar S. In vivo 3T spiral imaging based multi-slice T(1rho) mapping of knee cartilage in osteoarthritis. Magn Reson Med 2005;54(4):929–936. [DOI] [PubMed] [Google Scholar]
- 8.Wang N, Xia Y. Depth and orientational dependencies of MRI T(2) and T(1rho) sensitivities towards trypsin degradation and Gd-DTPA(2-) presence in articular cartilage at microscopic resolution. Magn Reson Imaging 2012;30(3):361–370. [DOI] [PMC free article] [PubMed] [Google Scholar]
- 9.Wang N, Badar F, Xia Y. MRI properties of a unique hypo-intense layer in degraded articular cartilage. Phys Med Biol 2015;60(22):8709–8721. [DOI] [PMC free article] [PubMed] [Google Scholar]
- 10.Xia Y MRI of articular cartilage at microscopic resolution. Bone Joint Res 2013;2(1):9–17. [DOI] [PMC free article] [PubMed] [Google Scholar]
- 11.Xia Y, Moody JB, Alhadlaq H. Orientational dependence of T2 relaxation in articular cartilage: A microscopic MRI (microMRI) study. Magn Reson Med 2002;48(3):460–469. [DOI] [PubMed] [Google Scholar]
- 12.Raya JG, Dettmann E, Notohamiprodjo M, Krasnokutsky S, Abramson S, Glaser C. Feasibility of in vivo diffusion tensor imaging of articular cartilage with coverage of all cartilage regions. Eur Radiol 2014;24(7):1700–1706. [DOI] [PubMed] [Google Scholar]
- 13.Raya JG, Horng A, Dietrich O, Krasnokutsky S, Beltran LS, Storey P, Reiser MF, Recht MP, Sodickson DK, Glaser C. Articular cartilage: in vivo diffusion-tensor imaging. Radiology 2012;262(2):550–559. [DOI] [PubMed] [Google Scholar]
- 14.Basser PJ, Mattiello J, LeBihan D. MR diffusion tensor spectroscopy and imaging. Biophys J 1994;66(1):259–267. [DOI] [PMC free article] [PubMed] [Google Scholar]
- 15.Alexander AL, Lee JE, Lazar M, Field AS. Diffusion tensor imaging of the brain. Neurotherapeutics 2007;4(3):316–329. [DOI] [PMC free article] [PubMed] [Google Scholar]
- 16.Chung MK, Hanson JL, Adluru N, Alexander AL, Davidson RJ, Pollak SD. Integrative Structural Brain Network Analysis in Diffusion Tensor Imaging. Brain Connect 2017;7(6):331–346. [DOI] [PMC free article] [PubMed] [Google Scholar]
- 17.Bedoya MA, Delgado J, Berman JI, Chauvin NA, Zurakowski D, Ramirez-Grueso R, Ntoulia A, Jaramillo D. Diffusion-Tensor Imaging of the Physes: A Possible Biomarker for Skeletal Growth-Experience with 151 Children. Radiology 2017;284(1):210–218. [DOI] [PubMed] [Google Scholar]
- 18.Van Dyck P, Froeling M, De Smet E, Pullens P, Torfs M, Verdonk P, Sijbers J, Parizel PM, Jeurissen B. Diffusion tensor imaging of the anterior cruciate ligament graft. J Magn Reson Imaging 2017;46(5):1423–1432. [DOI] [PubMed] [Google Scholar]
- 19.Wengler K, Tank D, Fukuda T, Paci JM, Huang M, Schweitzer ME, He X. Diffusion tensor imaging of human Achilles tendon by stimulated echo readout-segmented EPI (ste-RS-EPI). Magn Reson Med 2018. [DOI] [PubMed] [Google Scholar]
- 20.Barrera CA, Bedoya MA, Delgado J, Berman JI, Chauvin NA, Edgar JC, Jaramillo D. Correlation between diffusion tensor imaging parameters of the distal femoral physis and adjacent metaphysis, and subsequent adolescent growth. Pediatric radiology 2019;49(9):1192–1200. [DOI] [PubMed] [Google Scholar]
- 21.Wang N, Mirando AJ, Cofer G, Qi Y, Hilton MJ, Johnson GA. Diffusion tractography of the rat knee at microscopic resolution. Magnetic resonance in medicine 2019;81(6):3775–3786. [DOI] [PubMed] [Google Scholar]
- 22.Berman JI, Lanza MR, Blaskey L, Edgar JC, Roberts TP. High angular resolution diffusion imaging probabilistic tractography of the auditory radiation. AJNR Am J Neuroradiol 2013;34(8):1573–1578. [DOI] [PMC free article] [PubMed] [Google Scholar]
- 23.Tuch DS, Reese TG, Wiegell MR, Makris N, Belliveau JW, Wedeen VJ. High angular resolution diffusion imaging reveals intravoxel white matter fiber heterogeneity. Magn Reson Med 2002;48(4):577–582. [DOI] [PubMed] [Google Scholar]
- 24.Tuch DS. Q-Ball imaging. Magnetic Resonance in Medicine 2004;52(6):1358–1372. [DOI] [PubMed] [Google Scholar]
- 25.Yeh FC, Wedeen VJ, Tseng WYI. Generalized q-Sampling Imaging. Ieee T Med Imaging 2010;29(9):1626–1635. [DOI] [PubMed] [Google Scholar]
- 26.Smith RE, Tournier JD, Calamante F, Connelly A. Anatomically-constrained tractography: Improved diffusion MRI streamlines tractography through effective use of anatomical information. Neuroimage 2012;62(3):1924–1938. [DOI] [PubMed] [Google Scholar]
- 27.Tournier JD, Calamante F, Connelly A. MRtrix: Diffusion tractography in crossing fiber regions. Int J Imag Syst Tech 2012;22(1):53–66. [Google Scholar]
- 28.Jensen JH, Helpern JA. MRI quantification of non-Gaussian water diffusion by kurtosis analysis. Nmr in Biomedicine 2010;23(7):698–710. [DOI] [PMC free article] [PubMed] [Google Scholar]
- 29.Anderson AW. Measurement of fiber orientation distributions using high angular resolution diffusion imaging. Magnetic Resonance in Medicine 2005;54(5):1194–1206. [DOI] [PubMed] [Google Scholar]
- 30.Frank LR. Characterization of anisotropy in high angular resolution diffusion-weighted MRI. Magnetic Resonance in Medicine 2002;47(6):1083–1099. [DOI] [PubMed] [Google Scholar]
- 31.Wang N, Anderson RJ, Badea A, Cofer G, Dibb R, Qi Y, Johnson GA. Whole mouse brain structural connectomics using magnetic resonance histology. Brain Struct Funct 2018;223(9):4323–4335. [DOI] [PMC free article] [PubMed] [Google Scholar]
- 32.Yeh FC, Verstynen TD, Wang Y, Fernandez-Miranda JC, Tseng WY. Deterministic diffusion fiber tracking improved by quantitative anisotropy. PLoS One 2013;8(11):e80713. [DOI] [PMC free article] [PubMed] [Google Scholar]
- 33.Wang N, Kahn D, Badar F, Xia Y. Molecular Origin of a Loading-Induced Black Layer in the Deep Region of Articular Cartilage at the Magic Angle. Journal of Magnetic Resonance Imaging 2015;41(5):1281–1290. [DOI] [PMC free article] [PubMed] [Google Scholar]
- 34.Wang N, Badar F, Xia Y. Compressed sensing in quantitative determination of GAG concentration in cartilage by microscopic MRI. Magn Reson Med 2018;79(6):3163–3171. [DOI] [PMC free article] [PubMed] [Google Scholar]
- 35.Mirando AJ, Liu Z, Moore T, Lang A, Kohn A, Osinski AM, O’Keefe RJ, Mooney RA, Zuscik MJ, Hilton MJ. RBP-Jkappa-dependent Notch signaling is required for murine articular cartilage and joint maintenance. Arthritis Rheum 2013;65(10):2623–2633. [DOI] [PMC free article] [PubMed] [Google Scholar]
- 36.Petersen W, Tillmann B. Collagenous fibril texture of the human knee joint menisci. Anat Embryol (Berl) 1998;197(4):317–324. [DOI] [PubMed] [Google Scholar]
- 37.Steele JAM, McCullen SD, Callanan A, Autefage H, Accardi MA, Dini D, Stevens MM. Combinatorial scaffold morphologies for zonal articular cartilage engineering. Acta Biomater 2014;10(5):2065–2075. [DOI] [PMC free article] [PubMed] [Google Scholar]
- 38.Li Q, Qu FN, Han B, Wang C, Li H, Mauck RL, Han L. Micromechanical anisotropy and heterogeneity of the meniscus extracellular matrix. Acta Biomater 2017;54:356–366. [DOI] [PMC free article] [PubMed] [Google Scholar]
- 39.Sweigart MA, Athanasiou KA. Toward tissue engineering of the knee meniscus. Tissue Eng 2001;7(2):111–129. [DOI] [PubMed] [Google Scholar]
- 40.Dargel J, Michael JWP, Feiser J, Ivo R, Koebke J. Human Knee Joint Anatomy Revisited: Morphometry in the Light of Sex-Specific Total Knee Arthroplasty. J Arthroplasty 2011;26(3):346–353. [DOI] [PubMed] [Google Scholar]
- 41.Xia Y, Moody JB, Burton-Wurster N, Lust G. Quantitative in situ correlation between microscopic MRI and polarized light microscopy studies of articular cartilage. Osteoarthritis Cartilage 2001;9(5):393–406. [DOI] [PubMed] [Google Scholar]
- 42.Xia Y, Wang N, Lee J, Badar F. Strain-dependent T1 relaxation profiles in articular cartilage by MRI at microscopic resolutions. Magn Reson Med 2011;65(6):1733–1737. [DOI] [PMC free article] [PubMed] [Google Scholar]
- 43.de Visser SK, Bowden JC, Wentrup-Byrne E, Rintoul L, Bostrom T, Pope JM, Momot KI. Anisotropy of collagen fibre alignment in bovine cartilage: comparison of polarised light microscopy and spatially resolved diffusion-tensor measurements. Osteoarthritis Cartilage 2008;16(6):689–697. [DOI] [PubMed] [Google Scholar]
- 44.Raya JG. Techniques and applications of in vivo diffusion imaging of articular cartilage. J Magn Reson Imaging 2015;41(6):1487–1504. [DOI] [PMC free article] [PubMed] [Google Scholar]
- 45.Zheng S, Xia Y, Badar F. Further studies on the anisotropic distribution of collagen in articular cartilage by muMRI. Magn Reson Med 2011;65(3):656–663. [DOI] [PMC free article] [PubMed] [Google Scholar]
- 46.Xia Y, Farquhar T, Burton-Wurster N, Lust G. Origin of cartilage laminae in MRI. J Magn Reson Imaging 1997;7(5):887–894. [DOI] [PubMed] [Google Scholar]
- 47.Wei H, Gibbs E, Zhao P, Wang N, Cofer GP, Zhang Y, Johnson GA, Liu C. Susceptibility tensor imaging and tractography of collagen fibrils in the articular cartilage. Magn Reson Med 2017;78(5):1683–1690. [DOI] [PMC free article] [PubMed] [Google Scholar]
- 48.Raya JG, Arnoldi AP, Weber DL, Filidoro L, Dietrich O, Adam-Neumair S, Mutzel E, Melkus G, Putz R, Reiser MF, Jakob PM, Glaser C. Ultra-high field diffusion tensor imaging of articular cartilage correlated with histology and scanning electron microscopy. MAGMA 2011;24(4):247–258. [DOI] [PubMed] [Google Scholar]
- 49.Dyrby TB, Baare WFC, Alexander DC, Jelsing J, Garde E, Sogaard LV. An Ex Vivo Imaging Pipeline for Producing High-Quality and High-Resolution Diffusion-Weighted Imaging Datasets. Hum Brain Mapp 2011;32(4):544–563. [DOI] [PMC free article] [PubMed] [Google Scholar]
- 50.Tournier JD, Calamante F, Connelly A. Determination of the appropriate b value and number of gradient directions for high-angular-resolution diffusion-weighted imaging. Nmr in Biomedicine 2013;26(12):1775–1786. [DOI] [PubMed] [Google Scholar]
- 51.Juras V, Apprich S, Zbyn S, Zak L, Deligianni X, Szomolanyi P, Bieri O, Trattnig S. Quantitative MRI Analysis of Menisci Using Biexponential T-2* Fitting with a Variable Echo Time Sequence. Magnetic Resonance in Medicine 2014;71(3):1015–1023. [DOI] [PMC free article] [PubMed] [Google Scholar]
- 52.Wang N, Xia Y. Experimental issues in the measurement of multi-component relaxation times in articular cartilage by microscopic MRI. J Magn Reson 2013;235:15–25. [DOI] [PMC free article] [PubMed] [Google Scholar]
- 53.Sharafi A, Chang G, Regatte RR. Bi-component T1ρ and T2 relaxation mapping of skeletal muscle in-vivo. Scientific reports 2017;7(1):14115. [DOI] [PMC free article] [PubMed] [Google Scholar]
- 54.Yuan J, Zhao F, Chan Q, Wang YX. Observation of bi-exponential T(1rho) relaxation of in-vivo rat muscles at 3T. Acta Radiol 2012;53(6):675–681. [DOI] [PubMed] [Google Scholar]
- 55.Pauli C, Bae WC, Lee M, Lotz M, Bydder GM, D’Lima DL, Chung CB, Du J. Ultrashort-echo time MR imaging of the patella with bicomponent analysis: correlation with histopathologic and polarized light microscopic findings. Radiology 2012;264(2):484–493. [DOI] [PMC free article] [PubMed] [Google Scholar]
- 56.Du J, Diaz E, Carl M, Bae W, Chung CB, Bydder GM. Ultrashort echo time imaging with bicomponent analysis. Magn Reson Med 2012;67(3):645–649. [DOI] [PubMed] [Google Scholar]
Associated Data
This section collects any data citations, data availability statements, or supplementary materials included in this article.
Supplementary Materials
Supporting Information Figure S1. The varied density k-space sampling pattern for under sampling in both phase dimensions.
Supporting Information Figure S2. The diffusion encoding directions for two MRI scan protocols: 1) 31 DWIs with varied b value from 250 s/mm2 to 1250 s/mm2; 2) 147 DWIs with b value of 1000 s/mm2.
Supporting Information Figure S3. The maximum variation of DWIs signal (b0) is about ~ 4.0 % in muscle and cartilage during the scans without notable signal drift for the 3-day dMRI acquisition.


