Abstract
Metabolomic characterization of post-mortem tissues (frontal and parietal cortices, pons, cerebellum, hippocampus, cerebral cortex, liver and kidney) derived from a 37 y.o. male patient with succinic semialdehyde dehydrogenase deficiency (SSADHD) was performed in conjunction with four parallel series of control tissues. Amino acids, acylcarnitines, guanidino- species (guanidinoacetic acid, creatine, creatinine) and GABA-related intermediates were quantified using UPLC and mass spectrometric methods that included isotopically labeled internal standards. Amino acid analyses revealed significant elevation of aspartic acid and depletion of glutamine in patient tissues. Evidence for disruption of short-chain fatty acid metabolism, manifest as altered C4OH, C5, C5:1, C5DC (dicarboxylic) and C12OH carnitines, was observed. Creatine and guanidinoacetic acids were decreased and elevated, respectively. GABA-associated metabolites (total GABA, γ-hydroxybutyric acid, succinic semialdehyde, 4-guanidinobutyrate, 4,5-dihydroxyhexanoic acid and homocarnosine) were significantly increased in patient tissues, including liver and kidney. The data support disruption of fat, creatine and amino acid metabolism as a component of the pathophysiology of SSADHD, and underscore the observation that metabolites measured in patient physiological fluids provide an unreliable reflection of brain metabolism.
Keywords: GABA, γ-Hydroxybutyric acid, Metabolomics, Amino acids, Acylcarnitines
Introduction
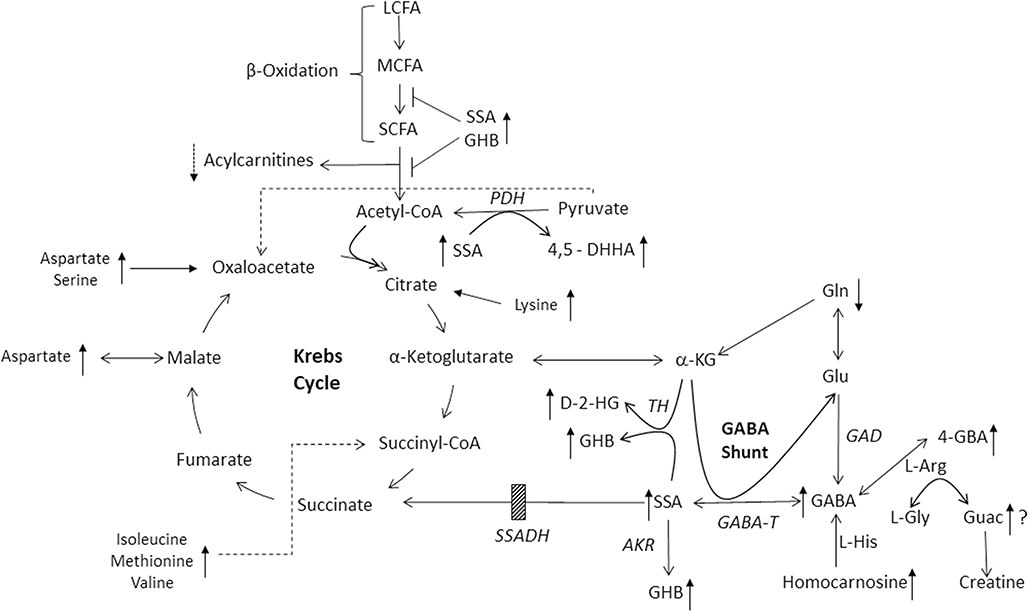
SSADHD is a rare heritable disorder of GABA metabolism (Fig. 1; Malaspina et al. 2016). The clinical phenotype is that of a nonspecific neurological disorder, featuring global developmental delays, neuropsychiatric morbidity, infrequent movement disorder and epilepsy in ~50% of patients. As such, diagnosis based upon clinical features is precluded, whereas metabolic/molecular characterization can provide the definitive diagnosis. Therapeutic options are limited and symptomatically prescribed; nonetheless, use of the antiepileptic vigabatrin (VGB), an irreversible inhibitor of GABA-T (Fig. 1), can provide metabolic improvements, yet clinical efficacy has been mixed and there is concern with the well-recognized ocular toxicity of VGB in association with prolonged use. A number of clinical trials have been undertaken (www.clinicaltrials.gov), and a recently completed, blinded trial of the GABA(B) receptor antagonist, SGS-742, is currently undergoing data analyses.
Fig. 1.
Metabolic interrelationships in SSADH Deficiency. Shown are the GABA catabolic pathway, GABA shunt, fatty acid metabolism, and the Krebs cycle. Abbreviations: 4-GBA, 4-guanidinobutyric acid; L-Arg, L-arginine; L-His, L-histidine; Gln, L-glutamine; L-Gly, L-glycine; Guac, guanidinoacetic acid; GABA, 4-aminobutyric acid; GHB, γ-hydroxybutyric acid; SSA, succinic semialdehyde; D-2-HG, D-2-hydroxyglutaric acid; α-KG, α-ketoglutaric acid (or 2-oxoglutaric acid); 4,5-DHHA, 4,5 dihydroxyhexanoic acid. Enzyme abbreviations: GAD, glutamic acid decarboxylase; GABA-T, GABA-transaminase (also aminobutyrate aminotransferase); AKR, aldo-keto reductase; SSADH, succinic semialdehyde dehydrogenase (the site of the block in patients with SSADHD, indicated by the cross-hatched box); TH, D-2-hydroxyglutarate transhydrogenase; PDH, pyruvate dehydrogenase complex; LCFA, MCFA and SCFA, representing long-chain, medium-chain and short-chain fatty acids, respectively. The reaction normally catalyzing the conversion of L-glycine and L-arginine to guanidinoacetic acid is catalyzed by arginine:glycine amidinotransferase, the first step of creatine and creatinine formation. When elevated, GABA is postulated to interfere with this reaction, replacing L-glycine with GABA to yield 4-GBA. Potential interference of β-oxidation by SSA or GHB is shown by T-bars. The site of entry of amino acids shown to be dysregulated in the current study (aspartic acid, glutamine, serine, lysine, methionine, valine, isoleucine) into the Kreb cycle is also shown, as well as their relative alterations compared to control tissues (upward arrows, elevated; downward arrows, decreased). Directional arrows (upward) also show elevations for GABA-related intermediates as well as guanidinoacetic acid. A question mark next to the latter indicates a paradoxical finding in view of the elevation of 4-GBA
The pathophysiology of SSADHD has historically been believed to be the result of elevated levels of neuromodulatory GABA and the GABA-related analogue, GHB, identified in physiological fluids of patients, as well as by non-invasive neuroimaging studies (Jansen et al. 2016; Novotny Jr et al. 2003). To further explore pathophysiology, a knockout model of the disorder was developed (Hogema et al. 2001). Electrophysiological, neurological and metabolic analyses in this animal model have revealed extensive evidence of neurotransmitter imbalances, down-regulation of GABAergic receptors, and broad metabolic dysfunction (Buzzi et al. 2006; Gupta et al. 2004; Gibson et al. 2002). Many of these abnormalities have been confirmed in physiological fluids derived from patients (Jansen et al. 2006a, 2006b, 2008; Struys et al. 2005; Kok et al. 1993). The opportunity to explore metabolic and genomic dysfunction identified in the murine model, and in patient biofluids, has not been possible in SSADHD tissues, other than genomic characterization in cultured cells (Akaboshi et al. 2003). In the current report, we examined the first metabolomic characteristics using autopsied brain, liver and kidney tissue from a patient with SSADHD who expired from SUDEP (sudden unexpected death of epilepsy) at age 37 years (Haan et al. 1985).
Materials and methods
The studies herein reported were approved by the Human Research Ethics Committee of the Royal Melbourne Hospital, Parkville, Victoria 3050, Australia, as well as the Instutional Review Board of the National Disease Research Interchange, Philadelphia, PA, USA. The family ofthe patient consented both to autopsy as well as procurement of tissues for experimental investigations, and consented to publication of the data. All authors declare that they have no conflict of interest with the study or the results presented.
The patient, first reported in 1985, presented a clinical course typical of SSADHD. He expired overnight with a post-mortem diagnosis of SUDEP. Following a period of almost 72 h (cadaver stored at 4 °C), autopsy and tissue harvest was undertaken, and included: cerebellum (Cer), frontal cortex (FrC), pons (Pon), parietal cortex (PaC), hippocampus (Hip), cerebral cortex (CeC), as well as liver (Liv) and kidney (Kid). Samples were shipped on dry ice and stored at −80 °C prior to analyses. Control specimens of identical brain regions and peripheral tissues (n = 4) were obtained from the National Disease Research Interchange (NDRI Protocol Filled (DGIK4)). Comorbidities of patient and controls, anthropometrics, as well as medications when known, are presented in Table 1.
Table 1.
Clinical Characteristics of Post-Mortem Specimens in this Study
| Specimen | Age, Ethnicity, Gender | Height, Weight | COD | Comorbidities | Medications | Tissue Harvest |
|---|---|---|---|---|---|---|
| Control | 52, C, M | 69/242 | CA | Tobacco use | Inhaler | 14.9 |
| Control | 30, C, F | 63/251 | RF | Asthma, COPD | Advair | 13.7–13.9 |
| Control | 36, C, M | 65/319 | MI | NIDDM, Asthma | – | 16.3 |
| Control | 56, C, M | −/264 | CA | COPD, Tobacco use | – | 21.9 |
| Control | 52, C, M | 72/205 | CA | NIDDM | – | 14.9–15.8 |
| Control | 47, H, F | 68/167 | RF | NIDDM, HTN, SA Tobacco use |
– | 16.8 |
| Control | 47, C, M | −/220 | CA | Hx: 5 MI, HTN, CAD GERD, 12 Catheterizations, Tobacco, Alcohol use |
Carvedilol | 13.4–13.8 |
| Control | 64, AA, M | 72/180 | CA | Alcohol, Tobacco use | Metformin | 17.3 |
| NIDDM | Glimepiride | |||||
| Patient | 37, C, M | 70/220 | SUDEP | SSADH Def. | Risperidone | ~74 |
Height, inches; weight, pounds; all control tissues, and patient, were screened for infectious disease (HIV, syphilis, hepatitis B and C), with negative results. Tissue harvest refers to hours between death and tissue procurement. Abbreviations: C, Caucasian; H, Hispanic; AA, African American; COD, cause of death; MI, myocardial infarction; SUDEP, sudden unexplained death in epilepsy; NIDDM, non-insulin dependent diabetes mellitus; COPD, chronic obstructive pulmonary disease; HTN, hypertension; SA, sleep apnea; CAD, coronary artery disease; CA, cardiac arrest; RF, respiratory failure; SSADH def., succinic semialdehyde dehydrogenase deficiency; Hx, history
Eight control autopsies (Table 1) were used in order to obtain the total of n = 4 control subjects comprising the six distinct brain regions (cerebellum, frontal and parietal cortices, pons, hippocampus, and cerebral cortex corresponding to the same regions derived from the patient (e.g., n = 24 for control, n = 6 for patient). It is not possible to make completely confident comparisons when contrasting metabolic measures in tissues that were approximately 72 h of age at harvest as compared to tissues harvested within 24 h. Chace et al. (2001) has shown that both free carnitine and acylcarnitine species can be elevated in postmortem specimens, likely the result of autolysis (cytolysis). The alterations of acylcarnitine species and free carnitine (primarily from myocytes) following loss of cell integrity can be extensive and dependent upon the degree of cell deterioration. Thus, the interpretation of postmortem acylcarnitine profiles presents limitations and must be interpreted with caution. Conversely, for metabolites closely associated with SSADH deficiency (GABA, GHB, SSA, 4,5-DHHA, etc., (Figs. 12, 13; Suppl. Figs. 22, 23) we might expect more extensive metabolite stability, but this also cannot be predicted with complete certainty.
Fig. 12.
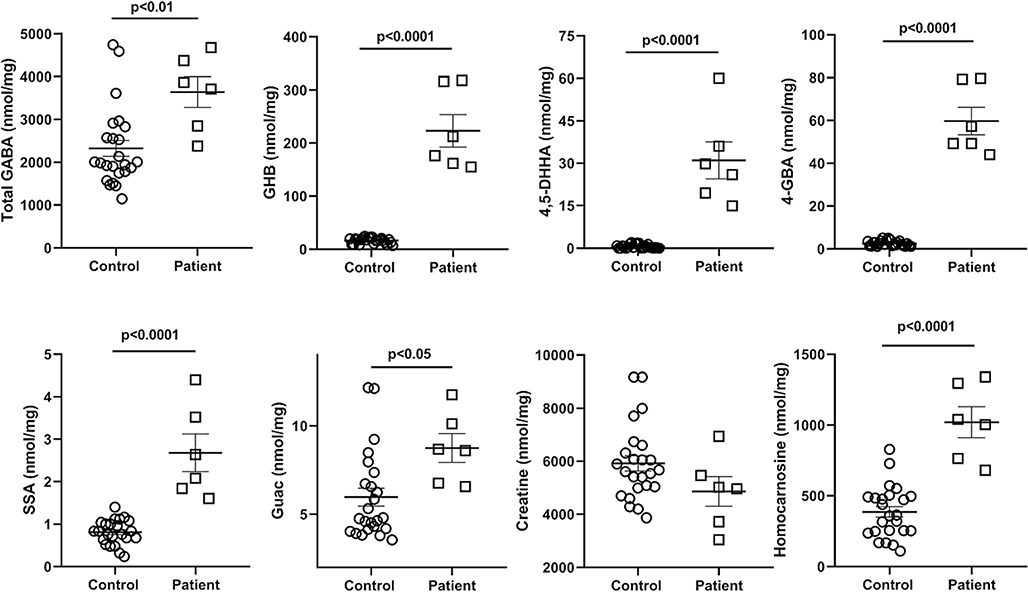
GABA-related metabolites quantified by isotope dilution mass spectrometry. The values represent the sum of all analyses across all brain regions for both n = 4 controls and the patient (regions: cerebellum, frontal and parietal cortices, pons, hippocampus, cerebral cortex, cerebellum). Statistical analyses, two-tailed t test. Data depicted as mean +/− SEM. Abbreviations: total GABA (including both free and esterified GABA), γ-aminobutyric acid; GHB, γ-hydroxybutyric acid; 4,5-DHHA, 4,5-dihydroxyhexanoic acid; 4-GBA, 4-guanidinobutyric acid; SSA, succinic semialdehyde; Guac, guanidinoacetic acid
Fig. 13.
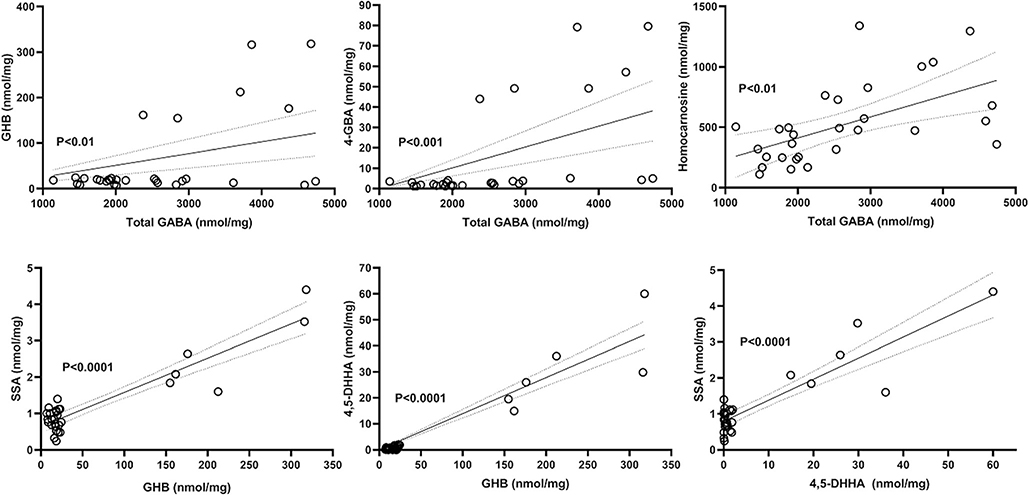
Correlations for GABA-related metabolites quantified by isotope dilution mass spectrometry. Data for both patient and controls is included. The top frame depicts the relationship of total GABAwith GHB, 4-GBA and homocarnosine, while the bottom frames the interrelationships of GHB, SSA and 4,5-DHHA. The values represent all analytical values across all brain regions for both n = 4 controls and the patient (regions: cerebellum, frontal and parietal cortices, pons, hippocampus, cerebral cortex, cerebellum). Abbreviations: total GABA (including both free and esterified GABA), γ-aminobutyric acid; GHB, γ-hydroxybutyric acid; 4,5-DHHA, 4,5-dihydroxyhexanoic acid; 4-GBA, 4-guanidinobutyric acid; SSA, succinic semialdehyde. Dashed lines indicate the 95% CI of the correlation analyses. Statistical analysis, Pearson correlation (P)
Metabolomic studies in these tissues followed three tracks. First, comprehensive amino acid analyses were performed using the MassTrak UPLC system with 6-aminoquinolyl-N-hydroxysuccinimidyl carbamate (AQC) derivatization (Walters et al. 2019). Further metabolomic evaluation utilized tissue homogenates (physiological pH) spotted onto dried filter paper, in a fashion comparable to that employed using dried filter paper bloodspots with quantitative mass spectrometry (Brown et al. 2019). For these studies, extracts were prepared (1:5 dilution) in sterile buffered phosphate saline, centrifuged, and extracts spotted onto filter papers (903TM five spot blood cards; Eastern Business Cards, Greenville, SC, USA) in order to saturate a 1.2 cm diameter spot. For analyses, two 3 mm punches were obtained, extracted with methanol, and subjected to tandem mass spectrometry (Brown et al. 2019). Metabolites evaluated included comprehensive amino acid and acylcarnitine species, in addition to guanidinoacetate (guac), creatine (cre) and creatinine (crn), with a total of 37–40 metabolic species measured. Metabolite recovery was corrected by comparison to stable-isotopically labeled internal standards, but protein content of the original extracts was not determined. Preparation of control tissues followed an identical protocol. Data was graphically reported as the range of controls with median, and the patient samples plotted as multiples of the control median (see https://clir.mayo.edu/; Clinical Laboratory Integrated Reports). Metabolite analyses using filter paper tissue extracts was considered semiquantitative. Additionally, a variety of metabolites previously identified in SSADHD, and in the murine model, were quantified using multiple mass spectrometric methodologies with appropriate isotopically-labeled internal standards. The metabolites included: total GABA (which included the presence of a hydrolysis step; Kok et al. 1993), GHB (Gibson et al. 1990b), succinic semialdehyde (SSA; Struys et al. 2005), 4,5-dihydroxyhexanoic acid (4,5-DHHA; Jansen et al. 2008), D- and L-2-hydroxyglutaric acids (D/L-2-HG; Gibson et al. 1993), 4-guanidinobutyrate (4-GBA; Jansen et al. 2006a), homocarnosine (HC; Jansen et al. 2006b), creatine (cre; Almeida et al. 2004) and guanidinoacetic acid (guac; Struys et al. 1998). These analyses were considered quantitative.
For data presentation, amino acids measured by MassTrak were reported as analytes from pooled brain regions, providing 24 unique data points for control and 6 for the patient. Since the data for MassTrak analyses, as well as that for specific measure of GABA-related metabolites, were considered quantitative, we chose to evaluate data in a pooled fashion across regions in order to afford the possibility of statistical evaluation (two-tailed t test; Figs. 2, 3 and 12, as well as Suppl. Fig. 22). Further, in the case of amino acids for which pooled analyses revealed statistically significant differences (Mass Trak amino acid analyses and GABA-related metabolite measures), we also assessed and presented the data by regions to look for trends across brain regions for the patient (Figs. 4, 5 and Suppl. Fig. 23). Since only a single measurement was afforded for the patient in each of the individual brain regions analyzed, statistical analysis could not be pursued. Statistical analysis of assays using extracts on filter papers was not pursued because this methodology was considered semiquantitative. For tissue extracts spotted onto filter paper, data was reported as described above (multiples of the control median). For GABA-related metabolites, data are presented as pooled outcomes for all metabolites as well as correlations focused on total GABA and GHB. For pooled analyses, a two-tailed t test was employed, and for correlative analyses the Pearson coefficient was used. Data was presented as mean ± SEM for all pooled analyses.
Fig. 2.
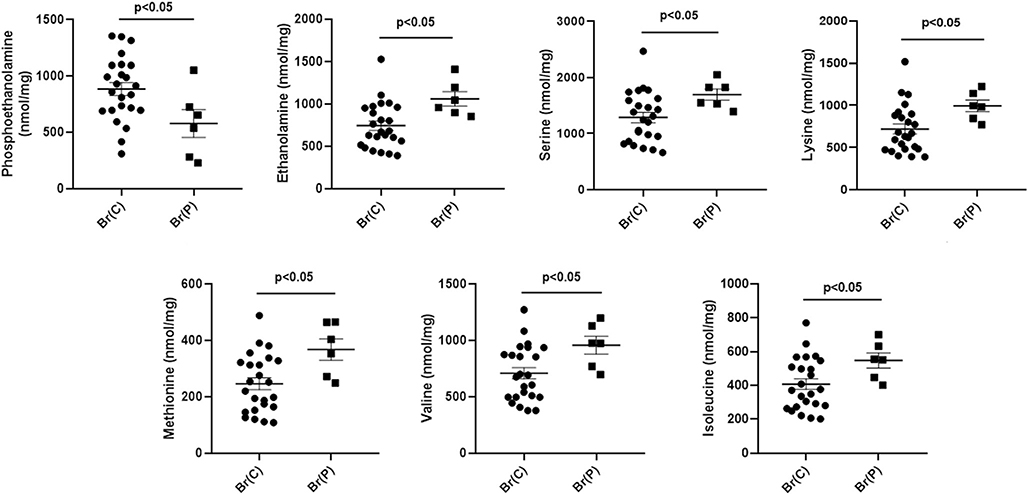
Abnormal amino acids detected in brain extracts quantified by MassTrak analyses. X-axis abbreviations include pooled measures for control brain (Br(C)) and patient brain (Br(P)). The values represent the sum of all analyses across all brain regions for controls and the patient (regions: cerebellum, frontal and parietal cortices, pons, hippocampus, cerebral cortex; n = 24 for control, n = 6 for patient). Note that eight control autopsies (Table 1) were leveraged in order to obtain the total of n = 4 total control subjects comprising the six distinct brain regions corresponding to those of the patient. Statistical analyses, two-tailed t test. Data depicted as mean ± SEM. All other amino acids were within normal limits for the patient
Fig. 3.
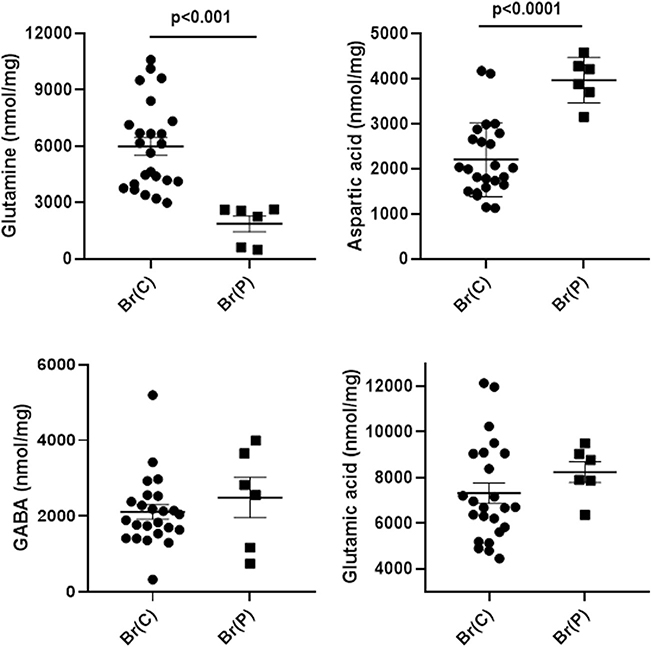
Neurotransmitter amino acids in brain extracts quantified by MassTrak analyses. X-axis abbreviations include pooled measures for control brain (Br(C)) and patient brain (Br(P)). The values represent the sum of all analyses across all brain regions for controls and the patient (regions: cerebellum, frontal and parietal cortices, pons, hippocampus, cerebral cortex, cerebellum; n = 24 for control, n = 6 for patient). Note that eight control autopsies (Table 1) were leveraged in order to obtain the total of n = 4 total control subjects comprising the six distinct brain regions corresponding to those of the patient. Statistical analyses, two-tailed t test. Data depicted as mean ± SEM. Glutamine serves primarily as a “shuttle” for both glutamic acid and GABA. In the absence of a hydrolysis step, GABA likely represents “free” GABA
Fig. 4.
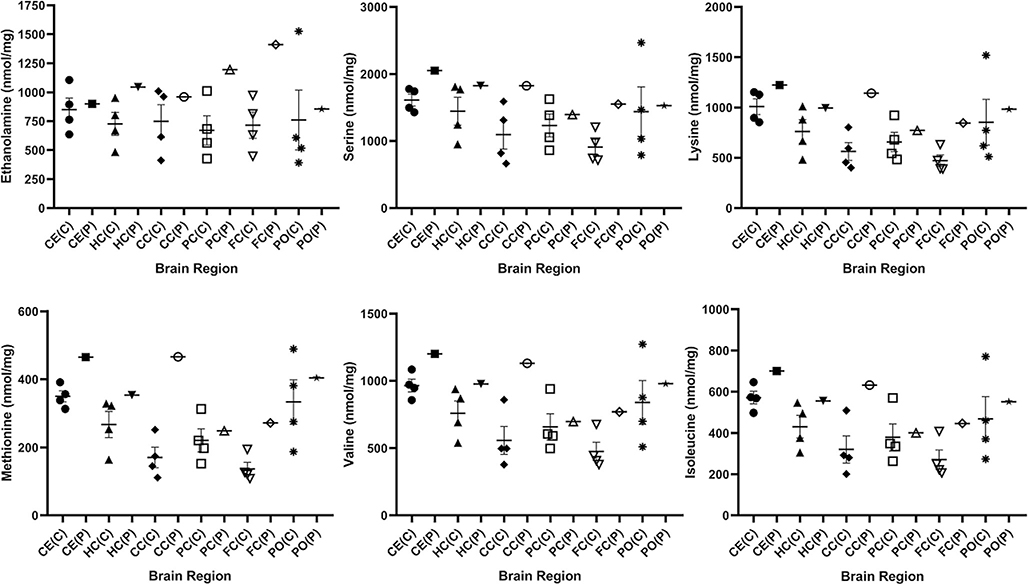
Amino acids derived from controls and patient stratified by brain region. The figure shows ethanolamine, serine, lysine, methionine, valine and isoleucine, which were shown by pooled analyses (Fig. 2) to be significantly different from control (two-tailed t test). Data for the control set (n = 4) is shown as mean +/− SEM. Abbreviations employed: CE, cerebellum; HC, hippocampus; CC, cerebral cortex; PC, parietal cortex; FC, frontal cortex; PO, pons; C, control; P, patient. Since only a single measure in each section was available from the patient, statistical analyses were not undertaken
Fig. 5.
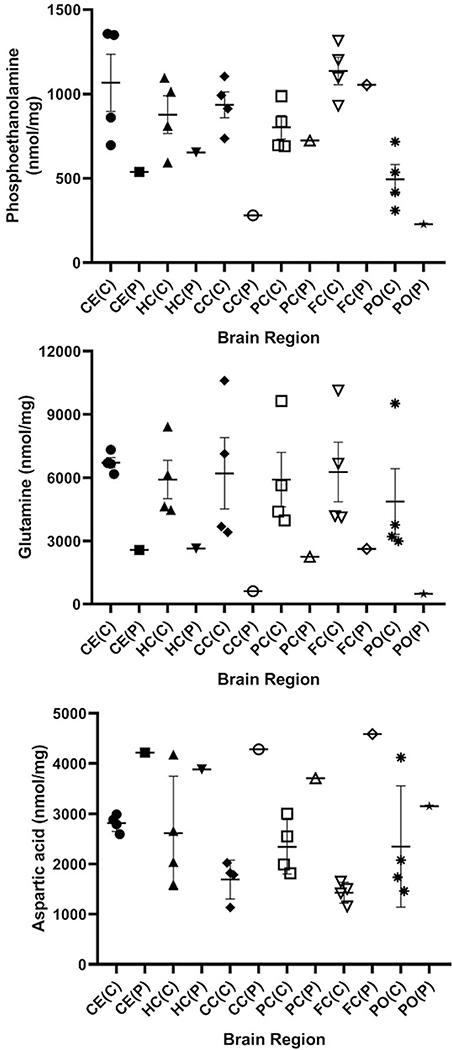
Amino acids derived from controls and patient stratified by brain region. The figure shows phosphoethanolamine, glutamine and aspartic acid, which were shown by pooled analyses (Figs. 2, 3) to be signifcantly different from control (two-tailed t test). Data for the control set (n = 4) is shown as mean +/− SEM. Abbreviations employed: CE, cerebellum; HC, hippocampus; CC, cerebral cortex; PC, parietal cortex; FC, frontal cortex; PO, pons; C, control; P, patient. Since only a single measure in each section was available from the patient, statistical analyses were not undertaken
Results
Amino acid analyses using the MassTrak system
Six amino acids (ethanolamine, serine, lysine, methionine, valine and isoleucine) were significantly elevated, while phosphoethanolamine was significantly decreased (Fig. 2). Glutamine was significantly decreased whereas aspartic acid was significantly elevated; GABA and glutamic acid were within the range of control values (Fig. 3). MassTrak analysis did not include a hydrolysis step, suggesting that the GABA quantified represented free GABA. All other amino acids for the patient were not significantly different from control.
For those amino acids depicted in Figs. 2 and 3 which differed significantly by genotype, individual values were plotted with regard to brain region to assess potential trends. Parietal cortex of the patient revealed the lowest content for serine, lysine, methionine, valine and isoleucine; conversely, ethanolamine was lowest in the pons (Fig. 4). For the same amino acids in the patient, the highest content for all was in cerebellum and cerebral cortex, while ethanolamine was highest in frontal cortex (Fig. 4). Overall, the content of glutamine and aspartic acids were relatively constant across the patient’s brain regions, although pons revealed the lowest level for both (Fig. 5). For phosphoethanolamine, lowest content for the patient was seen in cerebral cortex and pons, while the highest level was in frontal cortex (Fig. 5).
Overall, when assessing amino acid changes for the patient across regions (Figs. 4, 5), we found the most consistent alterations in cortical sections (frontal, parietal and cerebral cortex), as well as pons. These regions control a variety of neurological processes, but major roles include regulation of behavior, movement and language, as well as sensory signalling, all parameters which are altered to varying degrees in the neurological sequelae of SSADHD.
Amino acid analyses of filter paper tissue extracts using tandem mass spectrometry
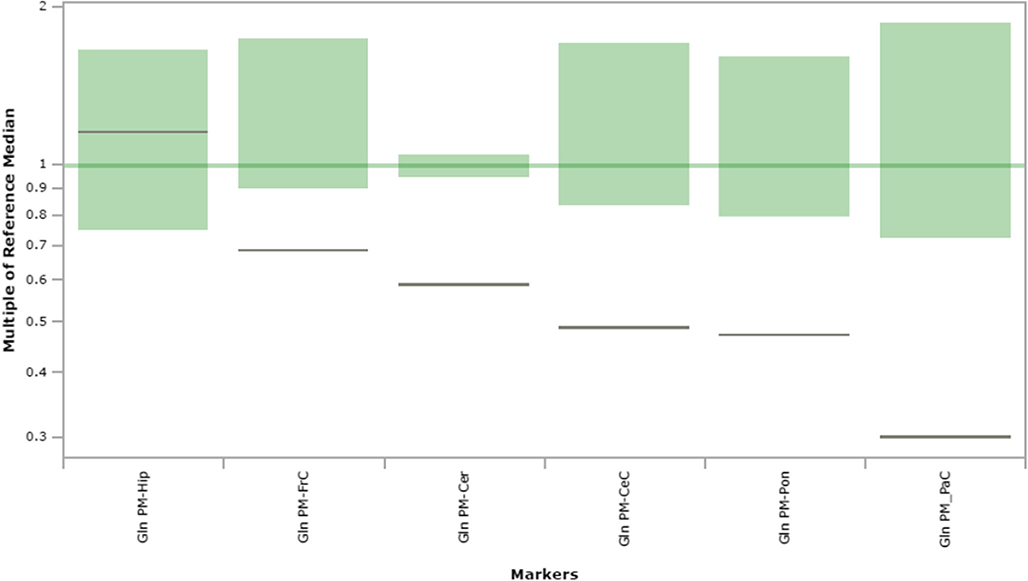
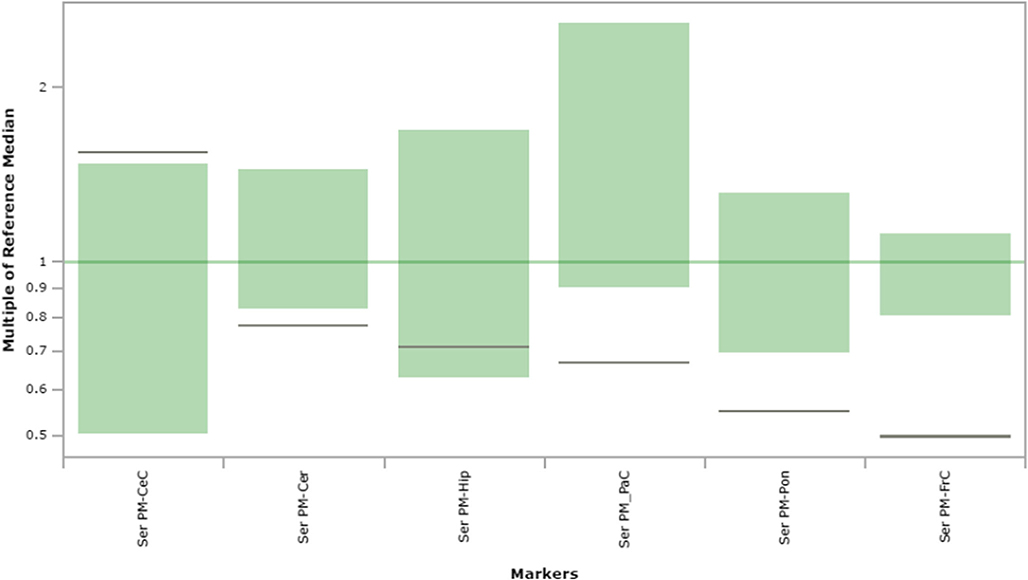
Comprehensive amino acid profiles for all brain regions are displayed in Suppl. Figs. 1–6. Visual inspection of these profiles revealed consistent abnormalities for glutamine and serine. For the patient, glutamine was below the control range in all regions except hippocampus (Fig. 6). Similarly, serine was below the control range in the patient in cerebellum, parietal and frontal cortices, and pons, whereas it was within the control range for the patient in hippocampus and slightly above the control range in cerebral cortex (Fig. 7). Since this methodology was considered semiquantitative, we did not consider looking for trends of metabolite anomalies in the patient across brain regions.
Fig. 6.
Glutamine content in extracts of brain regions spotted onto filter paper and quantified by tandem mass spectrometry. The figure depicts the range of control values (n = 4; green), with the control median set to 1.0 (dark green horizontal line). Patient values are depicted as a horizontal black line. The y-axis depicts “multiples of the reference (control) median”. Abbreviations: PM, post-mortem; FrC, frontal cortex; PaC, parietal cortex; Cer, cerebellum; Pon, pons; Hip, hippocampus; CeC, cerebral cortex; Gln, glutamine
Fig. 7.
Serine content in extracts of brain regions spotted onto filter paper and quantified by tandem mass spectrometry. The figure depicts the range of control values (n = 4; green), with the control median set to 1.0 (dark green horizontal line). Patient values are depicted as a horizontal black line. The y-axis depicts “multiples of the reference (control) median”. Abbreviations: PM, post-mortem; FrC, frontal cortex; PaC, parietal cortex; Cer, cerebellum; Pon, pons; Hip, hippocampus; CeC, cerebral cortex; Ser, serine
Acylcarnitine analyses of filter paper tissue extracts using tandem mass spectrometry
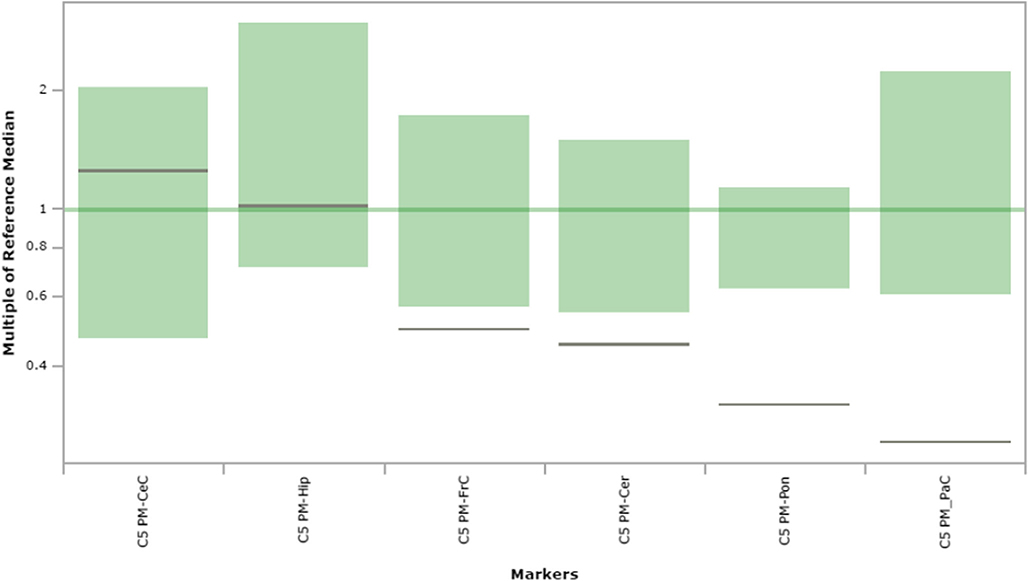
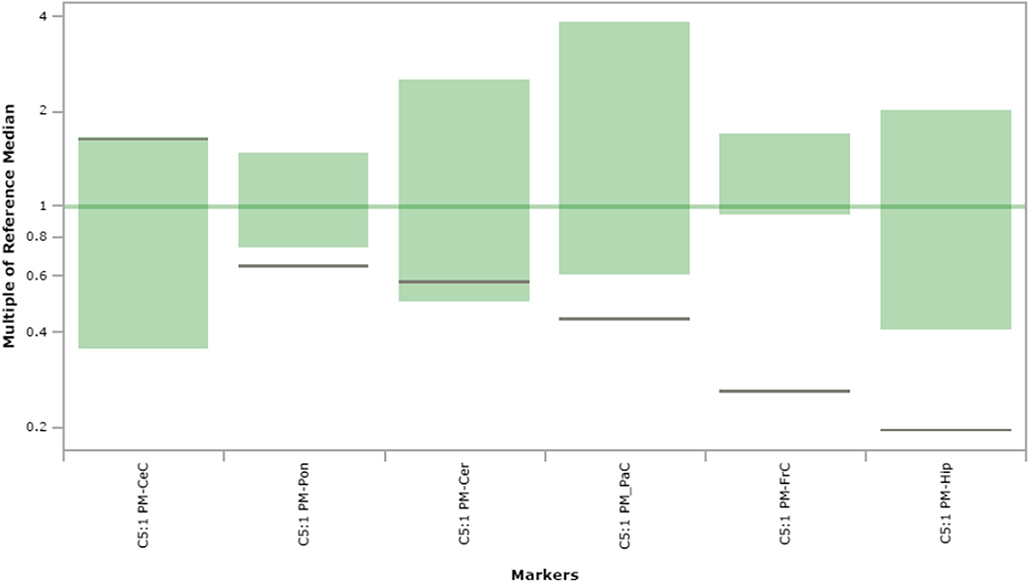
Comprehensive acylcarnitine profiles for all brain regions are displayed in Suppl. Figs. 9–14. Visual inspection of these profiles was undertaken to look for the possibility of trends across brain regions in either decrease or elevation of acylcarnitine species. The most consistent trends in patient brain sections appeared to reside predominantly in short-chain acylcarnitine species. For example, C4-OH carnitine was decreased for the patient in frontal and parietal cortices and pons, yet elevated in cerebellum (Suppl. Fig. 17). Similarly, C5 carnitine was decreased in frontal and parietal cortices, pons and cerebellum (Fig. 8). C5:1 carnitine (Fig. 9) was decreased in pons, frontal and parietal cortices and hippocampus derived from the patient. Conversely, C5DC carnitine (glutarylcarnitine; Suppl. Fig. 18) was notably increased in cerebral cortex and pons derived from the patient (6-fold above the control median in cerebral cortex and ~2.5-fold in pons). Beyond the short-chain acylcarnitine species, C12-OH carnitine also showed regional values for the patient that were decreased in cerebellum as well as frontal and parietal cortices (Suppl. Fig. 19). Overall, the patient revealed consistently decreased levels of short- and medium chain acylcarnitines primarily in the cortices and pons.
Fig. 8.
C5 carnitine content in extracts of brain regions spotted onto filter paper and quantified by tandem mass spectrometry. The figure depicts the range of control values (n = 4; green), with the control median set to 1.0 (dark green horizontal line). Patient values are depicted as a horizontal black line. The y-axis depicts “multiples of the reference (control) median”. Abbreviations: PM, post-mortem; FrC, frontal cortex; PaC, parietal cortex; Cer, cerebellum; Pon, pons; Hip, hippocampus; CeC, cerebral cortex; C5, C5 carnitine
Fig. 9.
C5:1 carnitine content in extracts of brain regions spotted onto filter paper and quantified by tandem mass spectrometry. The figure depicts the range of control values (n = 4; green), with the control median set to 1.0 (dark green horizontal line). Patient values are depicted as a horizontal black line. The y-axis depicts “multiples of the reference (control) median”. Abbreviations: PM, post-mortem; FrC, frontal cortex; PaC, parietal cortex; Cer, cerebellum; Pon, pons; Hip, hippocampus; CeC, cerebral cortex; C5:1, C5:1 carnitine
Analysis of guanidino- species in filter paper tissue extracts using tandem mass spectrometry
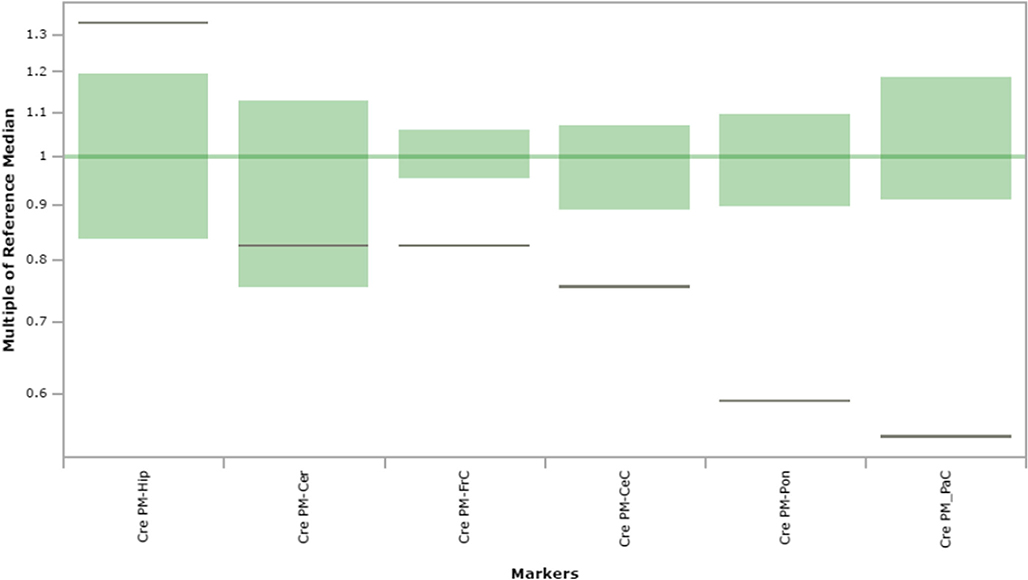
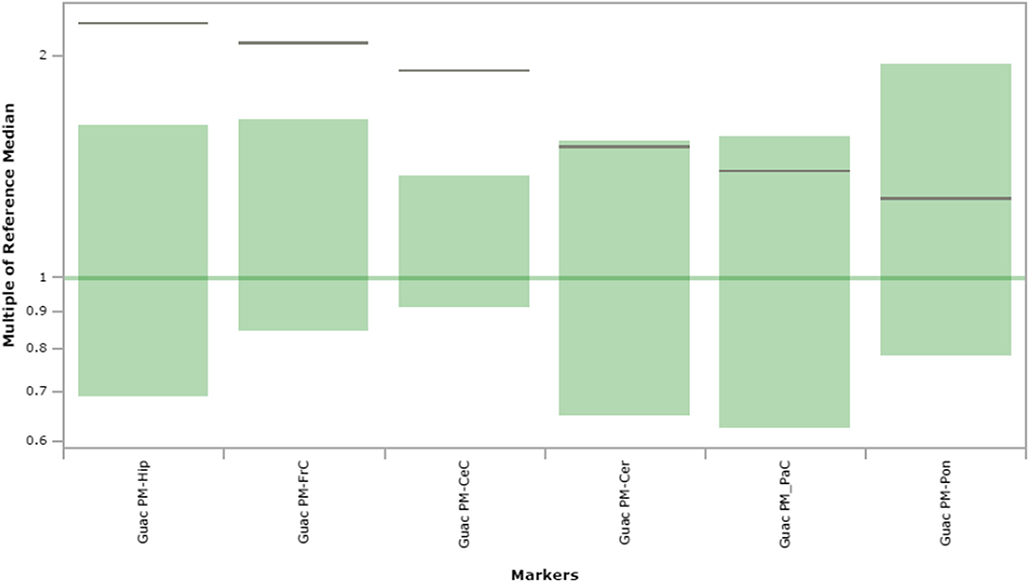
These studies included measurement of creatinine (crn), creatine (cre) and guanidinoacetic acid (guac). Of these, cre (Fig. 10) showed a consistent trend toward decreased values across all tissues, whereas guac (Fig. 11) revealed a consistent trend toward increased levels. These trends were confirmed in liver (Suppl. Fig. 20) and kidney (Suppl. Fig. 21) although cre in liver was within the range of control. Crn did not reveal a consistent trend toward increased or decreased levels across biopsied regions of brain derived from the patient.
Fig. 10.
Creatine content in extracts of brain regions spotted onto filter paper and quantified by tandem mass spectrometry. The figure depicts the range of control values (n = 4; green), with the control median set to 1.0 (dark green horizontal line). Patient values are depicted as a horizontal black line. The y-axis depicts “multiples of the reference (control) median”. Abbreviations: PM, post-mortem; FrC, frontal cortex; PaC, parietal cortex; Cer, cerebellum; Pon, pons; Hip, hippocampus; CeC, cerebral cortex; Cre, creatine
Fig. 11.
Guanidinoacetic acid content in extracts of brain regions spotted onto filter paper and quantified by tandem mass spectrometry. The figure depicts the range of control values (n = 4; green), with the control median set to 1.0 (dark green horizontal line). Patient values are depicted as a horizontal black line. The y-axis depicts “multiples of the reference (control) median”. Abbreviations: PM, post-mortem; FrC, frontal cortex; PaC, parietal cortex; Cer, cerebellum; Pon, pons; Hip, hippocampus; CeC, cerebral cortex; Guac, guanidinoacetic acid
Quantitation of GABA-related analogues in brain using isotope-dilution mass spectrometry
Pooled findings for eight intermediates are displayed in Fig. 12, including total GABA, GHB, 4,5-dihydroxyhexanoic acid (4,5-DHHA), 4-guanidinobutyrate (4-GBA), succinic semialdehyde (SSA), guac, cre and homocarnosine. Correlative analyses for total GABA and GHB, 4-GBA and homocarnosine, GHB and SSA, GHB and 4,5-DHHA, as well as SSA and 4,5-DHHA are depicted in Fig. 13. The graphs depict the linear regression analyses (Pearson) of all data obtained, including both control and patient values. Strong correlations (P < 0.0001) were revealed for the triad of GHB, SSA and 4,5-DHHA, although other correlations were also significant for other metabolites. Neither D- nor L-2-hydroxyglutaric acids (D-2-HG, L-2-HG) were elevated in regional extracts of biopsied brain, although D-2-HG was increased in liver extracts (Suppl. Fig. 22). Measurement of GABA-related intermediates in liver and kidney is shown in Suppl. Fig. 23.
Discussion
The use of two distinct approaches toward amino acid determination (MassTrak analysis, tandem mass spectrometric analyses of tissue extracts spotted onto filter paper) yielded interesting, yet sometimes contradictory, outcomes. Low glutamine was a consistent finding in both approaches, in line with earlier studies in SSADHD physiological fluids and tissues derived from the mouse model (Gibson et al. 2002; Gupta et al. 2004; Gibson et al. 2003). MassTrak analysis revealed significantly increased asp, yet there was no evidence for this with the filter paper assay. Using quantitative metabolic studies with administration of 13C-acetate and 13C-glucose in the murine model, Chowdhury et al. (2007) identified elevated asp in knockout mouse brain that tracked with elevated GABA, GHB and low glutamine. This would be consistent with increased aspartic acid in the patient in the current study (Fig. 2).
Serine was elevated using MassTrak analyses, while the filter paper data revealed a trend for low ser. The remaining amino acids seen as elevated in the patient using pooled analyses (lysine, methionine, valine and isoleucine) did not reveal consistent differences when measured using the filter paper assay (Fig. 2; note that ethanolamine and phosphoethanolamine were not quantified in the filter paper assay). It is of interest that four amino acids revealed as elevated by MassTrak analyses (lys, met, val, ile) are large neutral amino acids, as is glutamine (Figs. 2, 3). This may point to dysfunction in the large neutral amino acid transporters (LAT1, LAT2) resident at the blood brain barrier (Vogel et al. 2013). Nonetheless, glutamine has many other transporters that carry it into brain, and the discrepancy between elevated large neutral amino acids (methionine, lysine, isoleucine, valine), yet low glutamine, is inconsistent with a hypothesis involving alterations of LAT-1 or LAT-2, but is potentially explained by overconsumption of glutamine in the brain in SSADHD (Chowdhury et al. 2007).
An explanation for the discrepancies noted above may reside in either tissue preparation or platform methodology. Methodology for amino acid, acylcarnitine and guanidino- species analyses using tissue extracts were not optimized with respect to matrix, yet corresponding studies using dried blood spots have been optimized (Turgeon et al. 2008). Accordingly, to most closely mimic the blood spot methodology which has been extensively used, we prepared tissue extracts in sterile buffered phosphate, pH 7.4, with centrifugation but without deproteinization. Tissue extracts for filter paper analyses, however, were kept on ice prior to spotting onto filter paper to specifically reduce the risk of metabolite consumption. As well, our cumulative experience has been that metabolic markers are relatively stable in filter paper, presumably due to immobilization restricting solution based chemistry. With respect to platform, the UPLC MassTrak system will provide better analytical specificity than the filter paper assay, since the latter represents a flow injection analysis screening assay that lacks chromatographic separation. Thus, it may be reasonable to assume that at least some of the differences seen (asp, ser) could be due to the inherent differences in platform specificity, which would be predicted to be superior with the MassTrak system.
Neither glutamic nor aspartic acid have been shown to be elevated in plasma of patients with SSADHD, although levels of both are dysregulated in brain of mice with SSADHD (Gupta et al. 2004). The structural similarities of both GHB and SSA (in addition to other GHB analogues shown to accumulate in patient urine; Brown et al. 2019) to the aspartate transamination product, oxaloacetic acid (OAA), raises the potential for inhibition of citrate synthase in neural tissue, which would lead to aspartic acid accumulation. Arguing against this hypothesis, however, were enzymatic studies of multiple Krebs cycle enzymes, including citrate synthase, in the presence of up to 1 mM GHB, SSA and 4,5-DHHA (Fig. 1), none of which induced substantial inhibition of any enzyme activity (Sauer et al. 2007). Nonetheless, our finding of elevated aspartic acid, itself an excitatory neurotransmitter, warrants further characterization as a potential pathomechanism in SSADHD.
Recent studies using newborn and post-newborn dried bloodspots from SSADHD patients revealed consistently lowered short-chain acylcarnitines (C2, C3, C4, C4-OH; Table 2; Brown et al. in press-a). Short chain acylcarnitines, including C4OH, C5 and C5:1 species, showed a consistent downward trend in the current study. It is tempting to speculate that a metabolite of GHB (e.g., 4-hydroxycrotonic acid) interferes with the metabolism of either leucine or isoleucine at the level of 3-methylcrotonly-CoA or tiglyl-CoA (Gibson et al. 1993; Gibson et al. 2000). This would be supported by elevated isoleucine seen in the current report, although leucine was not elevated. Interference by a putative GHB metabolite would also be consistent with the accumulation of several tetronic acid derivatives of GHB identified in patient urine (Brown et al. 2019), and could conceivably explain the low C4OH carnitine seen in our studies, since the leucine catabolic enzyme 3-hydroxy-3-methylglutaryl-CoA lyase generates ketone bodies (Gibson et al. 1990b). As well, the finding of elevated C5DC (glutarylcarnitine) in brain regions shown in our studies is consistent with the dicarboxylic aciduria often identified in SSADHD urine (Brown et al. 2019).
Table 2.
Comparison of Metabolite Levels in Different Matrices as a Function of Age
| Specimen | Total GABA | GHB | Metabolite |
||
|---|---|---|---|---|---|
| Acylcarnitines | Amino Acid | Guanidino- Species | |||
| DBS (newborn)1,2 | – | ↑ | ↓C2, C3, C4, C4OH | ↓Ornithine | ↓Creatine |
| DBS1,2 (post-newborn) | – | ↑(nl ~10 yrs) | ↓C2, C4OH | ↓Ornithine, Histidine | ↓Creatine |
| Plasma3 | ↑(nl ~30–40 yrs) | ↑(nl ~10 yrs) | – | – | – |
| PM Tissue4 | ↑(age 37 yrs) | ↑(age 37 yrs) | ↓C4OH, C5, C5:1 | ↓Serine, Glutamine | ↓Creatine |
| ↑C5DC, C12OH | ↑Aspartic acid | ↑Guac | |||
Abbreviations: GABA, γ-aminobutyric acid; GHB, γ-hydroxybutyric acid; nl, normalized (within range of controls); Guac, guanidinoacetic acid; DBS, dried bloodspots; PM, post-mortem. For description of acylcarnitine species, see text. Upward pointing arrows indicate elevations, while downward pointing arrows indicate decreased levels
References-
Current report
The current report strongly supports an impact of SSADHD on creatine metabolism. Analytical methodologies, including tandem mass spectrometric analyses of filter paper extracts as well as targeted isotope dilution assay, revealed decreased creatine accompanied by elevated guadinoacetetic acid, as previously observed (Jansen et al. 2006a) using both patient physiological fluids and knockout mouse tissue extracts. Further, these findings were consistent with studies of newborn and post-newborn DBS from SSADHD, which consistently revealed low creatine (Brown et al. in press-a; Table 2). It is at the level of arginine:glycine amidinotransferase, the first committed step of creatine formation, that elevated GABA is believed to interfere and produce 4-GBA (Fig. 1), yet it remains paradoxical as to why guanidinoacetate is elevated as it would be predicted to be decreased with inhibition of this reaction. The data suggest some degree of dysfunction of the guanidinoacetate methyltransferase reaction in brain, which has hitherto not been reported in SSADHD and will require further investigation.
For the first time, the current report identified significantly elevated total GABA, GHB, 4,5-DHHA, 4-GBA, SSA and homocarnosine in sectioned tissues of an adult patient with SSADHD, although MRS has previously identified elevated GABA in SSADHD brain (Novotny Jr et al. 2003). Significant elevations of GHB, 4-GBA, SSA, guanidinoacetic acid, creatine and homocarnosine were also detected in the liver and kidney of the patient. These findings are at variance with previous findings from our laboratory, which revealed that GHB attained concentrations within the control range in both plasma and post-newborn DBS by ~10–12 years of age, while total GABA reached control plasma levels by approximately the 3rd-4th decade of life (Table 2). Nonetheless, total GABA was significantly elevated in brain of our patient, who expired in the 4th decade. Moreover, the strong correlation between GHB, SSA and 4,5-DHHA shown here provides further support for the original hypothesis of Brown et al. (1987), who first suggested that 4,5-DHHA derived from SSA (Fig. 1).
Perhaps the most pivotal finding in the current study was the significant elevation of aspartic acid seen in all brain regions of the patient. The transfer of NADH from cytoplasm to mitochondria is primarily achieved via the malate-aspartate shuttle, a shuttle for which glutamate and aspartate are substrates. Importantly, glutamate and aspartate are also substrates for aspartate aminotransferase, a pivotal enzyme of the shuttle. Whether reciprocal changes seen in aspartic acid (decreased) and glutamine/GABA (elevated) in patient cortical sections is a reflection of irregularities of transamination, or dysfunction of other shuttle-associated enzymes or transporters, requires further study. Nonetheless, our data provides strong support for the concept that the metabolismi of fat, creatine and amino acids form a component of the metabolic dysfunction of SSADHD. Furthermore, it is clear that metabolite measurement in peripheral physiological fluids in SSADHD provides an unreliable reflection of brain metabolismi, presumably a common feature in numerous inborn errors of metabolism (Berendse et al. 2016).
Supplementary Material
Acknowledgements
We gratefully acknowledge the family of the patient for agreeing to submission of autopsied tissues. We thank Dr. Timothy Fazio and Ms. Christine Fischer, Metabolic Disease Unit, Royal Melbourne Hospital, Victoria, Australia, for procurement, coordination, and shipment of tissues. This study was generously supported by the SSADH Association (www.ssadh.net) and HD 91142 from the National Institute of Child Health, National Institutes of Health (KMG).
Abbreviations
General abbreviations and amino acids
- SSADH
Succinic semialdehyde dehydrogenase
- SSADHD
Succinic semialdehydedehydrogenase deficiency
- PM
Post-mortem
- Cer
Cerebellum
- FrC
Frontal cortex
- Pon
Pons
- PaC
Parietal cortex
- Hip
Hippocampus
- CeC
Cerebral cortex
- Crn
Creatinine
- Cre
Creatine
- Suac
Succinylacetone
- AABA
Alpha-aminobutyric acid
- ASA
Argininosuccinic acid
- Xle
the sum of isoleucine and leucine (isobaric). Standard 3-letter amino acid abbreviations are employed throughout (e.g., glutamine, gln; serine, ser; etc)
GABA-related metabolites
- GABA
4-aminobutyric acid
- GHB
4-hydroxybutyric acid
- SSA
Succinic semialdehyde
- 4,5-DHHA
4,5-dihydroxyhexanoic acid
- Guac
Guanidinoacetic acid
- 4-GBA
4-guanidinobutyric acid
- HC
Homocarnosine (dipeptide of GABA:L-histidine)
Acylcarnitine metabolites: Acylcarnitine species are depicted throughout by chain length, e.g., C2, C3, C4 representing 2,3 and 4 carbon length carnitine analogues. Additional abbreviations include (example provided)
- C3DC
Dicarboxylic acid of 3 carbon chain length (e.g., malonylcarnitine)
- C16-OH
16 carbon length species with one hydroxyl- moiety
- C10:2
10 carbon chain length with 2 unsaturations (di-alkene)
- C18:2-OH
18 carbon length species with 2 unsaturations (di-alkene) and a single hydroxyl- moiety
- PheAc
Phenylacetyl carnitine
- Benz
Benzoyl carnitine
- C0
L-carnitine
- FIGLU
Formiminoglutamic acid
- C5DC(C10OH)
e.g., the acylcarnitine peak is a mixture of identical molecular weight fragments, including C5 dicarboxylic acid and C10 monohydroxyl-carnitine (the first shown species predominates in concentration)
Footnotes
Publisher’s note Springer Nature remains neutral with regard to jurisdictional claims in published maps and institutional affiliations.
Electronic supplementary material The online version of this article (https://doi.org/10.1007/s11011-020-00550-1) contains supplementary material, which is available to authorized users.
References
- Akaboshi S, Hogema BM, Novelletto A, Malaspina P, Salomons GS, Maropoulos GD, Jakobs C, Grompe M, Gibson KM (2003) Mutational spectrum of the succinate semialdehyde dehydrogenase (ALDH5A1) gene and functional analysis of 27 novel disease-causing mutations in patients with SSADH deficiency. Hum Mutat 22:442–450 [DOI] [PubMed] [Google Scholar]
- Almeida LS, Verhoeven NM, Roos B, Valongo C, Cardoso ML, Vilarinho L, Salomons GS, Jakobs C (2004) Creatine and guanidinoacetate: diagnostic markers for inborn errors in creatine biosynthesis and transport. Mol Genet Metab 82:214–219 [DOI] [PubMed] [Google Scholar]
- Berendse K, Engelen M, Ferdinandusse S, Majoie CB, Waterham HR, Vaz FM, Koelman JH, Barth PG, Wanders RJ, Poll-The BT (2016) Zellweger spectrum disorders: clinical manifestations in patients surviving into adulthood. J Inherit Metab Dis 39:93–106 [DOI] [PMC free article] [PubMed] [Google Scholar]
- Brown GK, Cromby CH, Manning NJ, Pollitt RJ (1987) Urinary organic acids in succinic semialdehyde dehydrogenase deficiency: evidence of alpha-oxidation of 4-hydroxybutyric acid, interaction of succinic semialdehyde with pyruvate dehydrogenase and possible secondary inhibition of mitochondrial beta-oxidation. J Inherit Metab Dis 10:367–375 [DOI] [PubMed] [Google Scholar]
- Brown M, Ashcraft P, Arning E, Bottiglieri T, Roullet JB, Gibson KM (2019) Gamma-Hydroxybutyrate content in dried bloodspots facilitates newborn detection of succinic semialdehyde dehydrogenase deficiency Mol Genet Metab 128:109–112 [DOI] [PMC free article] [PubMed] [Google Scholar]
- Brown MN, Turgeon C, Rinaldo P, Pop A, Salomons G, Roullet J-B, Gibson KM (in press-aa) Longitudinal metabolomics in dried bloodspots yields profiles informing newborn screening for succinic semialdehyde dehydrogenase deficiency (SSADHD). J Inherit Metab Dis Rep [DOI] [PMC free article] [PubMed] [Google Scholar]
- Brown M, Turgeon C, Rinaldo P, Roullet JB, Gibson KM (2019) Temporal metabolomics in dried bloodspots suggests multipathway disruptions in aldh5a1−/− mice, a model of succinic semialdehyde dehydrogenase deficiency Mol Genet Metab 128:397–408 [DOI] [PubMed] [Google Scholar]
- Buzzi A, Wu Y, Frantseva MV, Perez Velazquez JL, Cortez MA, Liu CC, Shen LQ, Gibson KM, Snead OC 3rd (2006) Succinic semialdehyde dehydrogenase deficiency: GABAB receptor-mediated function. Brain Res 1090:15–22 [DOI] [PubMed] [Google Scholar]
- Chace DH, DiPerna JC, Mitchell BL, Sgroi B, Hofman LF, Naylor EW (2001) Electrospray tandem mass spectrometry for analysis of acylcarnitines in dried postmortem blood specimens collected at autopsy from infants with unexplained cause of death. Clin Chem 47:1166–1182 [PubMed] [Google Scholar]
- Chowdhury GM, Gupta M, Gibson KM, Patel AB, Behar KL (2007) Altered cerebral glucose and acetate metabolism in succinic semialdehyde dehydrogenase-deficient mice: evidence for glial dysfunction and reduced glutamate/glutamine cycling. J Neurochem 103:2077–2091 [DOI] [PubMed] [Google Scholar]
- Gibson KM, Lee CF, Kamali V, Johnston K, Beaudet AL, Craigen WJ, Powell BR, Schwartz R, Tsai MY, Tuchman M (1990a) 3-Hydroxy-3-methylglutaryl-CoA lyase deficiency as detected by radiochemical assay in cell extracts by thin-layer chromatography, and identification of three new cases. Clin Chem 36:297–303 [PubMed] [Google Scholar]
- Gibson KM, Aramaki S, Sweetman L, Nyhan WL, DeVivo DC, Hodson AK, Jakobs C (1990b) Stable isotope dilution analysis of 4-hydroxybutyric acid: an accurate method for quantification in physiological fluids and the prenatal diagnosis of 4-hydroxybutyric aciduria. Biomed Environ Mass Spectrom 19:89–93 [DOI] [PubMed] [Google Scholar]
- Gibson KM, ten Brink HJ, Schor DS, Kok RM, Bootsma AH, Hoffmann GF, Jakobs C (1993) Stable-isotope dilution analysis of D- and L-2-hydroxyglutaric acid: application to the detection and prenatal diagnosis of D- and L-2-hydroxyglutaric acidemias. Pediatr Res 34:277–280 [DOI] [PubMed] [Google Scholar]
- Gibson KM, Burlingame TG, Hogema B, Jakobs C, Schutgens RB, Millington D, Roe CR, Roe DS, Sweetman L, Steiner RD, Linck L, Pohowalla P, Sacks M, Kiss D, Rinaldo P, Vockley J (2000) 2-Methylbutyryl-coenzyme a dehydrogenase deficiency: a new inborn error of L-isoleucine metabolism. Pediatr Res 47:830–833 [DOI] [PubMed] [Google Scholar]
- Gibson KM, Schor DS, Gupta M, Guerand WS, Senephansiri H, Burlingame TG, Bartels H, Hogema BM, Bottiglieri T, Froestl W, Snead OC, Grompe M, Jakobs C (2002) Focal neurometabolic alterations in mice deficient for succinate semialdehyde dehydrogenase. JNeurochem 81:71–9 [DOI] [PubMed] [Google Scholar]
- Gibson KM, Gupta M, Pearl PL, Tuchman M, Vezina LG, Snead OC 3rd, Smit LM, Jakobs C (2003) Significant behavioral disturbances in succinic semialdehyde dehydrogenase (SSADH) deficiency (gamma-hydroxybutyric aciduria). Biol Psychiatry 54:763–768 [DOI] [PubMed] [Google Scholar]
- Gupta M, Polinsky M, Senephansiri H, Snead OC, Jansen EE, Jakobs C, Gibson KM (2004) Seizure evolution and amino acid imbalances in murine succinate semialdehyde dehydrogenase (SSADH) deficiency. Neurobiol Dis 16:556–562 [DOI] [PubMed] [Google Scholar]
- Haan EA, Brown GK, Mitchell D, Danks DM (1985) Succinic semialdehyde dehydrogenase deficiency–a further case. J Inherit Metab Dis 8:99. [DOI] [PubMed] [Google Scholar]
- Hogema BM, Gupta M, Senephansiri H, Burlingame TG, Taylor M, Jakobs C, Schutgens RB, Froestl W, Snead OC, Diaz-Arrastia R, Bottiglieri T, Grompe M, Gibson KM (2001) Pharmacologic rescue of lethal seizures in mice deficient in succinate semialdehyde dehydrogenase. Nat Genet 29:212–216 [DOI] [PubMed] [Google Scholar]
- Jansen EE, Verhoeven NM, Jakobs C, Schulze A, Senephansiri H, Gupta M, Snead OC, Gibson KM (2006a) Increased guanidino species in murine and human succinate semialdehyde dehydrogenase (SSADH) deficiency Biochim Biophys Acta 1762:494–498 [DOI] [PubMed] [Google Scholar]
- Jansen EE, Gibson KM, Shigematsu Y, Jakobs C, Verhoeven NM (2006b) A novel, quantitative assay for homocarnosine in cerebrospinal fluid using stable-isotope dilution liquid chromatography-tandem mass spectrometry. J Chromatogr B Analyt Technol Biomed Life Sci 830:196–200 [DOI] [PubMed] [Google Scholar]
- Jansen EE, Struys E, Jakobs C, Hager E, Snead OC, Gibson KM (2008) Neurotransmitter alterations in embryonic succinate semialdehyde dehydrogenase (SSADH) deficiency suggest a heightened excitatory state during development. BMC Dev Biol 8:112. [DOI] [PMC free article] [PubMed] [Google Scholar]
- Jansen EE, Vogel KR, Salomons GS, Pearl PL, Roullet JB, Gibson KM (2016) Correlation of blood biomarkers with age informs pathomechanisms in succinic semialdehyde dehydrogenase deficiency (SSADHD), a disorder of GABA metabolism. J Inherit Metab Dis 39:795–800 [DOI] [PMC free article] [PubMed] [Google Scholar]
- Kok RM, Howells DW, van den Heuvel CC, Guérand WS, Thompson GN, Jakobs C (1993) Stable isotope dilution analysis of GABA in CSF using simple solvent extraction and electron-capture negativeion mass fragmentography J Inherit Metab Dis 16:508–512 [DOI] [PubMed] [Google Scholar]
- Malaspina P, Roullet JB, Pearl PL, Ainslie GR, Vogel KR, Gibson KM (2016) Succinic semialdehyde dehydrogenase deficiency (SSADHD): pathophysiological complexity and multifactorial trait associations in a rare monogenic disorder of GABA metabolism. Neurochem Int 99:72–84 [DOI] [PMC free article] [PubMed] [Google Scholar]
- Novotny EJ Jr, Fulbright RK, Pearl PL, Gibson KM, Rothman DL (2003) Magnetic resonance spectroscopy of neurotransmitters in human brain. Ann Neurol 54(Suppl 6):S25–S31 [DOI] [PubMed] [Google Scholar]
- Sauer SW, Kölker S, Hoffmann GF, Ten Brink HJ, Jakobs C, Gibson KM, Okun JG (2007) Enzymatic and metabolic evidence for a region specific mitochondrial dysfunction in brains of murine succinic semialdehyde dehydrogenase deficiency (Aldh5a1−/− mice). Neurochem Int 50:653–659 [DOI] [PubMed] [Google Scholar]
- Struys EA, Jansen EE, ten Brink HJ, Verhoeven NM, van der Knaap MS, Jakobs C (1998) An accurate stable isotope dilution gas chromatographic-mass spectrometric approach to the diagnosis of guanidinoacetate methyltransferase deficiency. J Pharm Biomed Anal 18:659–665 [DOI] [PubMed] [Google Scholar]
- Struys EA, Jansen EE, Gibson KM, Jakobs C (2005) Determination of the GABA analogue succinic semialdehyde in urine and cerebrospinal fluid by dinitrophenylhydrazine derivatization and liquid chromatography-tandem mass spectrometry: application to SSADH deficiency. J Inherit Metab Dis 28:913–920 [DOI] [PubMed] [Google Scholar]
- Turgeon C, Magera C, Allard P, Tortorelli S, Gavrilov D, Oglesbee D, Raymond K, Rinaldo P, Matern D (2008) Combined newborn screening for succinylacetone, amino acids, and acylcarnitines in dried blood spots. Clin Chem 54:657–664 [DOI] [PubMed] [Google Scholar]
- Vogel KR, Arning E, Wasek BL, Bottiglieri T, Gibson KM (2013) Characterization of 2-(methylamino)alkanoic acid capacity to restrict blood-brain phenylalanine transport in Pah enu2 mice: preliminary findings. Mol Genet Metab 110(Suppl):S71–S78 [DOI] [PMC free article] [PubMed] [Google Scholar]
- Walters DC, Jansen EEW, Ainslie GR, Salomons GS, Brown MN, Schmidt MA, Roullet JB, Gibson KM (2019) Preclinical tissue distribution and metabolic correlations of vigabatrin, an antiepileptic drug associated with potential use-limiting visual field defects. Pharmacol Res Perspect 7:e00456. [DOI] [PMC free article] [PubMed] [Google Scholar]
Associated Data
This section collects any data citations, data availability statements, or supplementary materials included in this article.


