Figure 1.
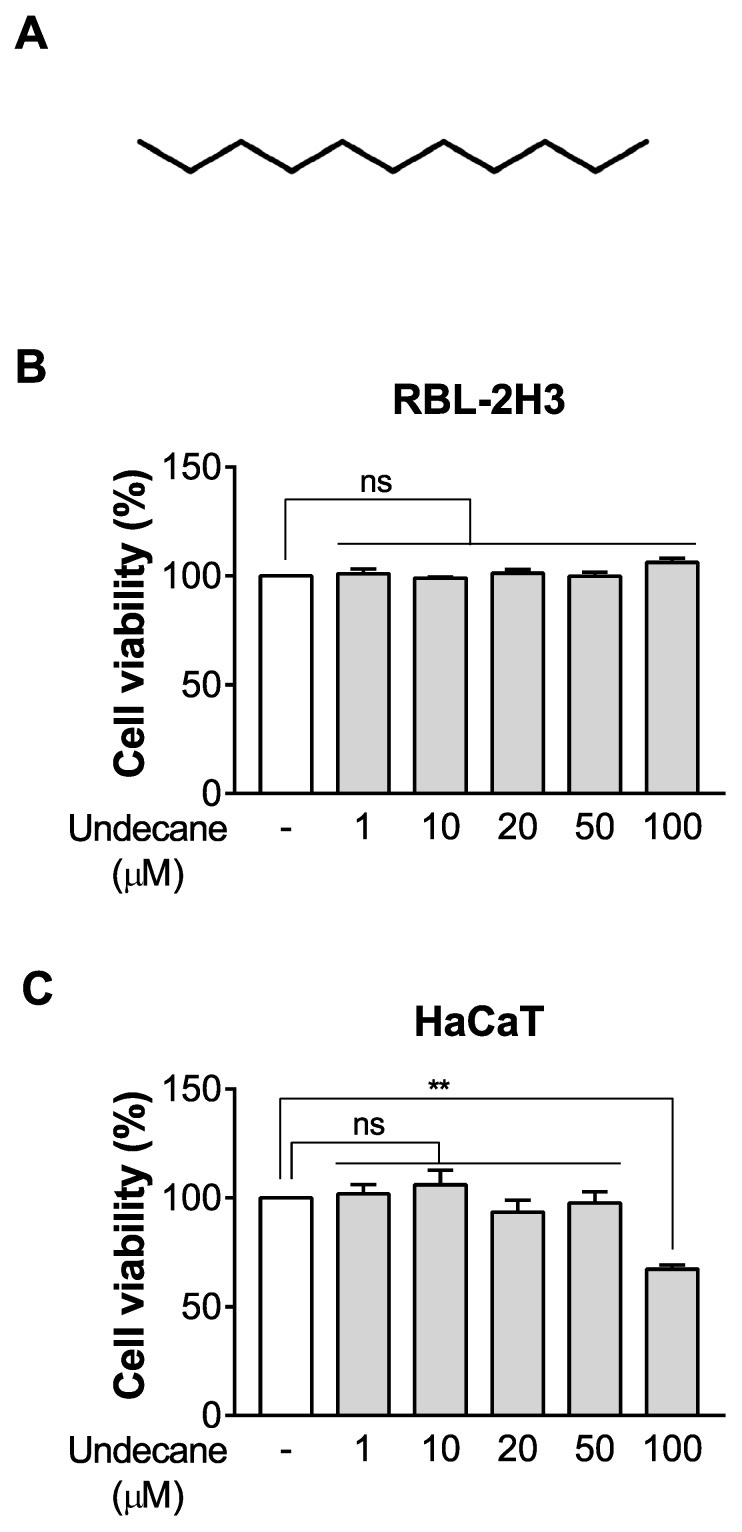
Effect of undecane on cell viability in RBL-2H3 cells and HaCaT cells. (A) The structure of undecane. (B) Cell viability was determined after incubation with vehicle (DMSO) or various concentrations of undecane (1, 10, 20, 50 and 100 μM) in RBL-2H3 cells and (C) HaCaT cells for 24 h. The data were expressed as the mean ± SEM (n = 3). Significant differences between groups are indicated by asterisks; ns, not significant (p > 0.05); ** p < 0.01.

