

Abstract
Purpose
Outcome misclassification in retrospective epidemiologic analyses has been well-studied, but little is known about such misclassification with respect to sequential statistical analysis during surveillance of medical product-associated risks, a planned capability of the US Food and Drug Administration’s Sentinel System.
Methods
Using a vaccine example, we model and simulate sequential database surveillance in an observational data network using a variety of outcome detection algorithms. We consider how these algorithms, as characterized by sensitivity and positive predictive value, impact the length of surveillance and timeliness of safety signal detection. We show investigators/users of these networks how they can perform preparatory study design calculations that consider outcome misclassification in sequential database surveillance.
Results
Non-differential outcome misclassification generates longer surveillance times and less timely safety signal detection as compared with the case of no misclassification. Inclusive algorithms characterized by high sensitivity but low positive predictive value outperform more narrow algorithms when detecting rare outcomes. This decision calculus may change considerably if medical chart validation procedures were required.
Conclusions
These findings raise important questions regarding the design of observational data networks used for pharmacovigilance. Specifically, there are tradeoffs involved when choosing to populate such networks with component databases that are large as compared with smaller integrated delivery system databases that can more easily access laboratory or clinical data and perform medical chart validation. Copyright © 2014 John Wiley & Sons, Ltd.
Keywords: adverse drug event, bias (epidemiology), outcome measurement error, pharmacovigilance, postmarketing product surveillance, pharmacoepidemiology
INTRODUCTION
Outcome misclassification is a concern when using observational data to evaluate medical product-associated safety risks.1–4 Non-differential outcome misclassification has been well-studied in non-sequential epidemiologic analyses and generally is expected to bias treatment effect estimates toward the null hypothesis when independent of other errors.5–15
We extend this area of research to sequential analyses. Modern sequential statistical analysis was developed primarily in clinical trial settings where non-differential outcome misclassification is not a key concern.16,17 Although simulation studies of non-sequential analyses in the postmarket have incorporated outcome misclassification,18 simulation studies of sequential analyses have not.19–21 Thus, we are the first to explore outcome misclassification in sequential database surveillance, a planned capability of the US Food and Drug Administration’s Sentinel System.22,23
Sequential database surveillance is a “near real-time” sequential statistical approach to evaluate pre-specified exposure-outcome pairs using data that are frequently updated, often monthly. A statistical “signal” is detected when the data suggest an excess risk that is statistically significant, adjusting for the multiple testing inherent in the frequent looks at the data. Although both non-sequential and sequential studies are concerned with obtaining adequate statistical power, the distinguishing feature of sequential analyses in the postmarket surveillance setting is the additional desire to minimize the time required to detect a signal.
Outcome misclassification depends on the algorithm used to detect the outcome of interest. An inclusive algorithm generates more false positive cases and fewer missed cases; that is, positive predictive value (PPV) is low, and sensitivity is high.24 Conversely, a narrow electronic algorithm misses more cases but more frequently correctly identifies the cases it finds.
We analyze non-differential outcome misclassification in sequential surveillance of medical product-associated risks. Using a simple vaccine example, we demonstrate how non-differential outcome misclassification affects the length of surveillance and the timeliness of signal detection. Although we consider two epidemiologic designs frequently employed for vaccine safety surveillance, our goal was not to encourage investigators to compare these two designs on the basis of length of surveillance but to compare how different outcome detection algorithms are utilized in observational database networks such as the Sentinel System. The key contribution is a procedure for determining the optimal detection algorithm by considering its impact on statistical power and timeliness.
METHODS
Vaccine example: surveillance-specific model parameters
We begin by simulating sequential database surveillance intended to mimic previous near real-time vaccine safety surveillance studies.25–33 We perform surveillance on a single-dose, newly available live attenuated childhood vaccine being evaluated for an elevated risk of idiopathic thrombocytopenic purpura (ITP). ITP is a bleeding disorder known to occur following certain childhood vaccinations as well as some infections caused by vaccine-preventable diseases.34–36 Vaccine examples are instructive because exposure is discrete, the risk window is finite, and the adoption pattern is simple, that is, children receive routine vaccinations during well visits. We assume that ITP in infants is expected to occur at a rate of two outcomes per 100 000 person-years in a clinically relevant comparison group, that is, the background rate.37
Table 1 lists relevant user-specified surveillance parameters and database-specific parameters for sequential database surveillance. We plan for two concurrently performed epidemiologic designs and accompanying analyses, which has been a common practice.25–33,38 The first design is a cohort design with a (unmatched) historical comparison cohort of infants exposed to other vaccines. Because the treatment and comparison populations are not matched, this design is analyzed using the Poisson maximized sequential probability ratio test (MaxSPRT).39 The second design is a self-controlled risk interval design where each vaccinated infant serves as its own match.32,40 This second design is analyzed using the binomial MaxSPRT as this distribution is most appropriate for matched data.
Table 1.
User-specified parameters in the simulated vaccine example
| Surveillance parameters | ||
|---|---|---|
| Cohort design with historical control | Self-controlled risk interval design | |
| Effect size of interest | Eight excess outcomes/100 000 person-years | |
| Comparison population outcome rate (ρ) | Two outcomes/100 000 person-years | |
| Risk window | 1–42 days post-vaccination | |
| Comparison window | NA | 43–126 days post-vaccination |
| Statistical model | Poisson MaxSPRT with minimum of 4 outcomes | Binomial MaxSPRT |
| Desired type I error | 0.05 | |
| Desired type II error | 0.10 | |
| Number of simulations | 10 000 | |
| Database parameters | ||
| Subpopulation size | 564 000 0–1 year olds | |
| Probability of adoption | 0.95 | |
| Database processing delay | 2 months | |
| Refresh frequency | 1 month | |
MaxSPRT, maximized sequential probability ratio test; NA, not applicable.
We assume that it is only biologically plausible that ITP could be vaccine-associated if it occurs between 1 and 42 days post-vaccination, which is the risk window. The self-controlled risk interval design requires specification of a comparison window, which we define as 43–126 days post-vaccination. Each dose of vaccination contributes 42 exposed person-days to the analysis, resulting in a background rate of ~1 case of ITP for every 434 821 doses.
We require a minimum of four outcomes to signal using the Poisson MaxSPRT. We use a Wald sequential stopping boundary,41 which is flat with respect to the likelihood function and conventional for the MaxSPRT analyses.
Vaccine example: database-specific model parameters
We begin by modeling the aggregate Mini-Sentinel System Distributed Database, which uses a network infrastructure to access standardized data across 18 database partner sites.42 The cohort size—564 000 0–1 year olds—is based on 2008–2009 mean enrollment data; this represents ~14% of the US population of this age group.43
We model the adoption function linearly. That is, adoption is coincident with well visits, and children are assumed to be equally likely to be born on any day of the year. We assume a 5% probability of non-adoption, that is, vaccine refusers. We assume the receipt of new data monthly, and that new data are not fully processed until 2 months after the clinical experiences have occurred, that is, a 2-month processing delay.44 That is, a clinical experience that occurs on April 1 would not be considered “processed” in the originating database until 1 June and would not be available until the next data refresh was complete, which could range from 1 June until 1 July. Data considered “processed” for the purposes of surveillance may still be subject to further claims adjustments.
Modeling non-differential outcome misclassification
For each database partner site that contributes to surveillance, we assign a PPV in the comparison group (PPV0) and a sensitivity (П) when identifying the outcome of interest. We choose to focus on PPV as opposed to specificity because this value is the main output of ongoing validation studies2–4 and no information is available on true negative cases in the sequential database surveillance setting. We derive PPV in the treatment population (PPV1) on the basis of PPV0 and previously published algebraic formulas.13
Given a true incidence rate in the comparison population (ρ), the database-specific sensitivity (П), the PPV0 and the true effect size, we simulate exposures and outcomes of interest in both the treatment and comparison populations as shown in Table 2. Each rate is an input to a stochastic Poisson process. We assume that all vaccine exposures are correctly classified.
Table 2.
Rates of occurrence of outcomes of interest when modeling misclassification
| Exposed | Coded with outcome | Had outcome | Case type | Modeled rate of occurrence |
|---|---|---|---|---|
| Treatment population | ||||
| Yes | No | No | True negative | NA |
| Yes | No | Yes | False negative | IRR × ρ × (1− ∏) |
| Yes | Yes | No | False positive | IRR × ρ × ∏ × [(1/PPV1)−1)] |
| Yes | Yes | Yes | True positive | IRR × ρ × ∏ |
| Comparison population | ||||
| No | No | No | True negative | NA |
| No | No | Yes | False negative | ρ × (1− ∏) |
| No | Yes | No | False positive | ρ × ∏ × [(1/PPV0)−1)] |
| No | Yes | Yes | True positive | ρ × ∏ |
ρ, incidence rate in the comparison population; IRR, incidence rate ratio; NA, not applicable; PPV1, positive predictive value in the treatment population; PPV0, positive predictive value in the comparison population; ∏, sensitivity.
Modeling approach
First, we perform sequential database surveillance on simulated data for the reference case of no misclassification, that is, sensitivity and PPV0 are 1.0. We set a fivefold incidence rate ratio as the true effect size, and, using Markov models as described by Kulldorff et al.39, we solve for a signaling threshold designed to limit type I error as near as possible to 0.05 and type II error as near as possible to 0.10, that is, statistical power is 0.90, when detecting this effect size. The sequential stopping boundary is designated by two quantities, the upper limit and the critical value. Both these quantities are a function of sample size defined in terms of statistical information (i.e., events) as opposed to calendar time. The upper limit describes the number of events required to reach the end of surveillance while failing to reject the null. The critical value is a log likelihood ratio specifying the threshold for rejecting the null hypothesis of no excess risk.
Using these statistical information-based thresholds, we perform 10 000 simulations as described previously.20 We solve for the length of surveillance on the basis of the observational database network characteristics. The outputs of our simulations are the mean, median, and maximum length of surveillance. Both the mean and median lengths of surveillance represent instances when the null hypothesis has been rejected and a signal has been detected. The maximum length of surveillance represents instances when one has reached the end of surveillance while failing to reject the null.
Next, to illustrate the effects of non-differential outcome misclassification, we reperform the sequential database surveillance described in the reference case but vary sensitivity and PPV0 from 0 to 1.0; all other parameters remain unchanged. To allow for direct comparisons of the length of surveillance, we hold statistical power constant in the presence of misclassification. To do this, we calculate the “observed” effect size11,13 and use the same signaling threshold with the “observed” effect size as opposed to the true effect size. That is, we recalculate the upper limit and critical value to account for the bias of misclassification.
Examining tradeoffs in detection algorithm choices
Finally, continuing with the vaccine example, we evaluate three particular outcome detection algorithms for ITP on the basis of previous validation studies and examine the tradeoffs between PPV0 and sensitivity. The first algorithm (hereafter Algorithm 1) detects the occurrence of ICD-9 diagnosis code 287.3 and is based on a validation study that reported a PPV0 of 0.54 for a definitive diagnosis of ITP in children.37 There were no data reported on sensitivity, but an older validation study calculated a sensitivity of 1.0 in the inpatient setting and 0.84 in the outpatient setting.45 We will assume a sensitivity of 0.84 for this algorithm.
The second algorithm (hereafter Algorithm 2) requires the occurrence of any of the following ICD-9 codes (287, 287.0, 287.1, 287.2, 287.3, 287.31, 287.39, 287.4, 287.5, 287.8, and 287.9) plus a laboratory value of <50 000 platelets. This study used data from five integrated delivery systems with access to laboratory data that now participating in the Mini-Sentinel System.34 We use the published results from the years 2005–2008. The PPV0 for this algorithm is 0.53, and the sensitivity for this algorithm is 0.99. (Note: sensitivity is not reported in the original paper. We describe our method to estimate sensitivity in the online Supporting Information.) The third algorithm (hereafter Algorithm 3) comes from the same study and requires the occurrence of ICD-9 code 287.31 plus a laboratory value of <50 000 platelets. As expected, this narrower algorithm has a higher PPV0 (0.79) and lower sensitivity (0.59) when compared with the broader Algorithm 2.
Note that Algorithm 1 requires only claims data, whereas Algorithms 2 and 3 require both claims and laboratory data. Why is this important? Only a subset of the Mini-Sentinel System Distributed Database contains laboratory data that would allow execution of Algorithms 2 or 3. In this example, that subset comprises 40% of the larger Mini-Sentinel System dataset.
We compare the length of surveillance for these three algorithms and the reference case. Aside from misclassification, all parameters remain unchanged from Table 1. As before, we maintain constant statistical power. Additionally, we evaluate a range of true effect sizes to illustrate instances when the surveillance configuration is underpowered, that is, incidence rate ratios <5, as well as overpowered, that is, incidence rate ratios >5.
RESULTS
Reference case of no misclassification
In the reference case with no misclassification, the cohort design has a mean length of surveillance of 10.9 months, a median of 10 months, and a maximum of 17 months; and the self-controlled risk interval design has a mean length of surveillance of 20.3 months, a median of 18 months, and a maximum of 74 months. The self-controlled risk interval design takes longer to reach a result because (i) individuals who do not experience the event in either the risk window or the comparison window do not contribute information that is material to the test statistic and 2) data on the comparison cohort must be collected in real time along with the exposure information. By contrast, in the cohort design, individuals contribute information unconditionally, and historical data are available for the comparison group. These differences are more pronounced when the outcome of interest is rare, as it is in this example.
Cohort design with historical controls and non-differential outcome misclassification
Figure 1 presents the mean, median, and maximum length of surveillance for the cohort design analyzed with the Poisson MaxSPRT model with a minimum of four outcomes required to signal. The top panel shows the statistical information associated with the surveillance configuration.39 Note that the statistical power in the reference case is slightly above 0.90 because we have required four outcomes to signal.
Figure 1.

Mean, median, and maximum length of surveillance in months for various levels of misclassification using the cohort design. All parameters, with the exception of misclassification values, are as stated in Table 1. The actual type I error and statistical power achieved for the simulations are shown in the upper panel. The upper limit describes the number of events required to reach the end of surveillance while failing to reject the null. The critical value is a log likelihood ratio specifying the threshold for rejecting the null hypothesis of no excess risk. Ten thousand simulations per scenario. Abbreviations: PPV0, positive predictive value in the comparison population; MaxSPRT, maximized sequential probability ratio test
In the lower set of three panels, the boxed upper right-hand cell reflects the reference case. The three panels, respectively, show the changes in mean, median, and maximum length of surveillance that occur as a result of non-differential outcome misclassification. As misclassification increases, the length of surveillance needed to detect the true effect size increases, consistent with what we expect for non-differential outcome misclassification in a non-sequential analysis.5–7,11–14
Reductions in PPV0 and sensitivity both increase the length of surveillance, but for different reasons. As PPV0 declines, false positive cases begin to dilute the true signal, and there is less ability to distinguish differences between the treatment and comparison populations. Therefore, more statistical information is required to achieve the desired statistical power whenever PPV0 is less than 1.0. By contrast, when sensitivity is less than 1.0, the amount of statistical information required is the same as in the reference case. Losses in sensitivity do not bias the true effect size. Rather, declines in sensitivity increase the length of surveillance because missed cases prolong the time required to reach a stopping point. However, the key result is not just that the length of surveillance increases, but how fast it increases with changes in PPV0 or sensitivity. For example, note that a relatively low PPV0 (e.g., 0.5) may produce timely signal detection as long as the investigator properly anticipates and adjusts for this misclassification and the algorithm is also sufficiently sensitive.
Self-controlled risk interval design
We produce equivalent results for the self-controlled risk interval design analyzed with the binomial MaxSPRT model in Figure 2. The patterns are similar to the cohort design, but the discrete-time stochastic process used in the self-controlled risk interval design generates instances when no combination of the upper limit and critical value produces the exact desired type I error and type II error. Thus, the self-controlled risk interval design has less “smooth” patterns, particularly when calculating the maximum length of surveillance.
Figure 2.
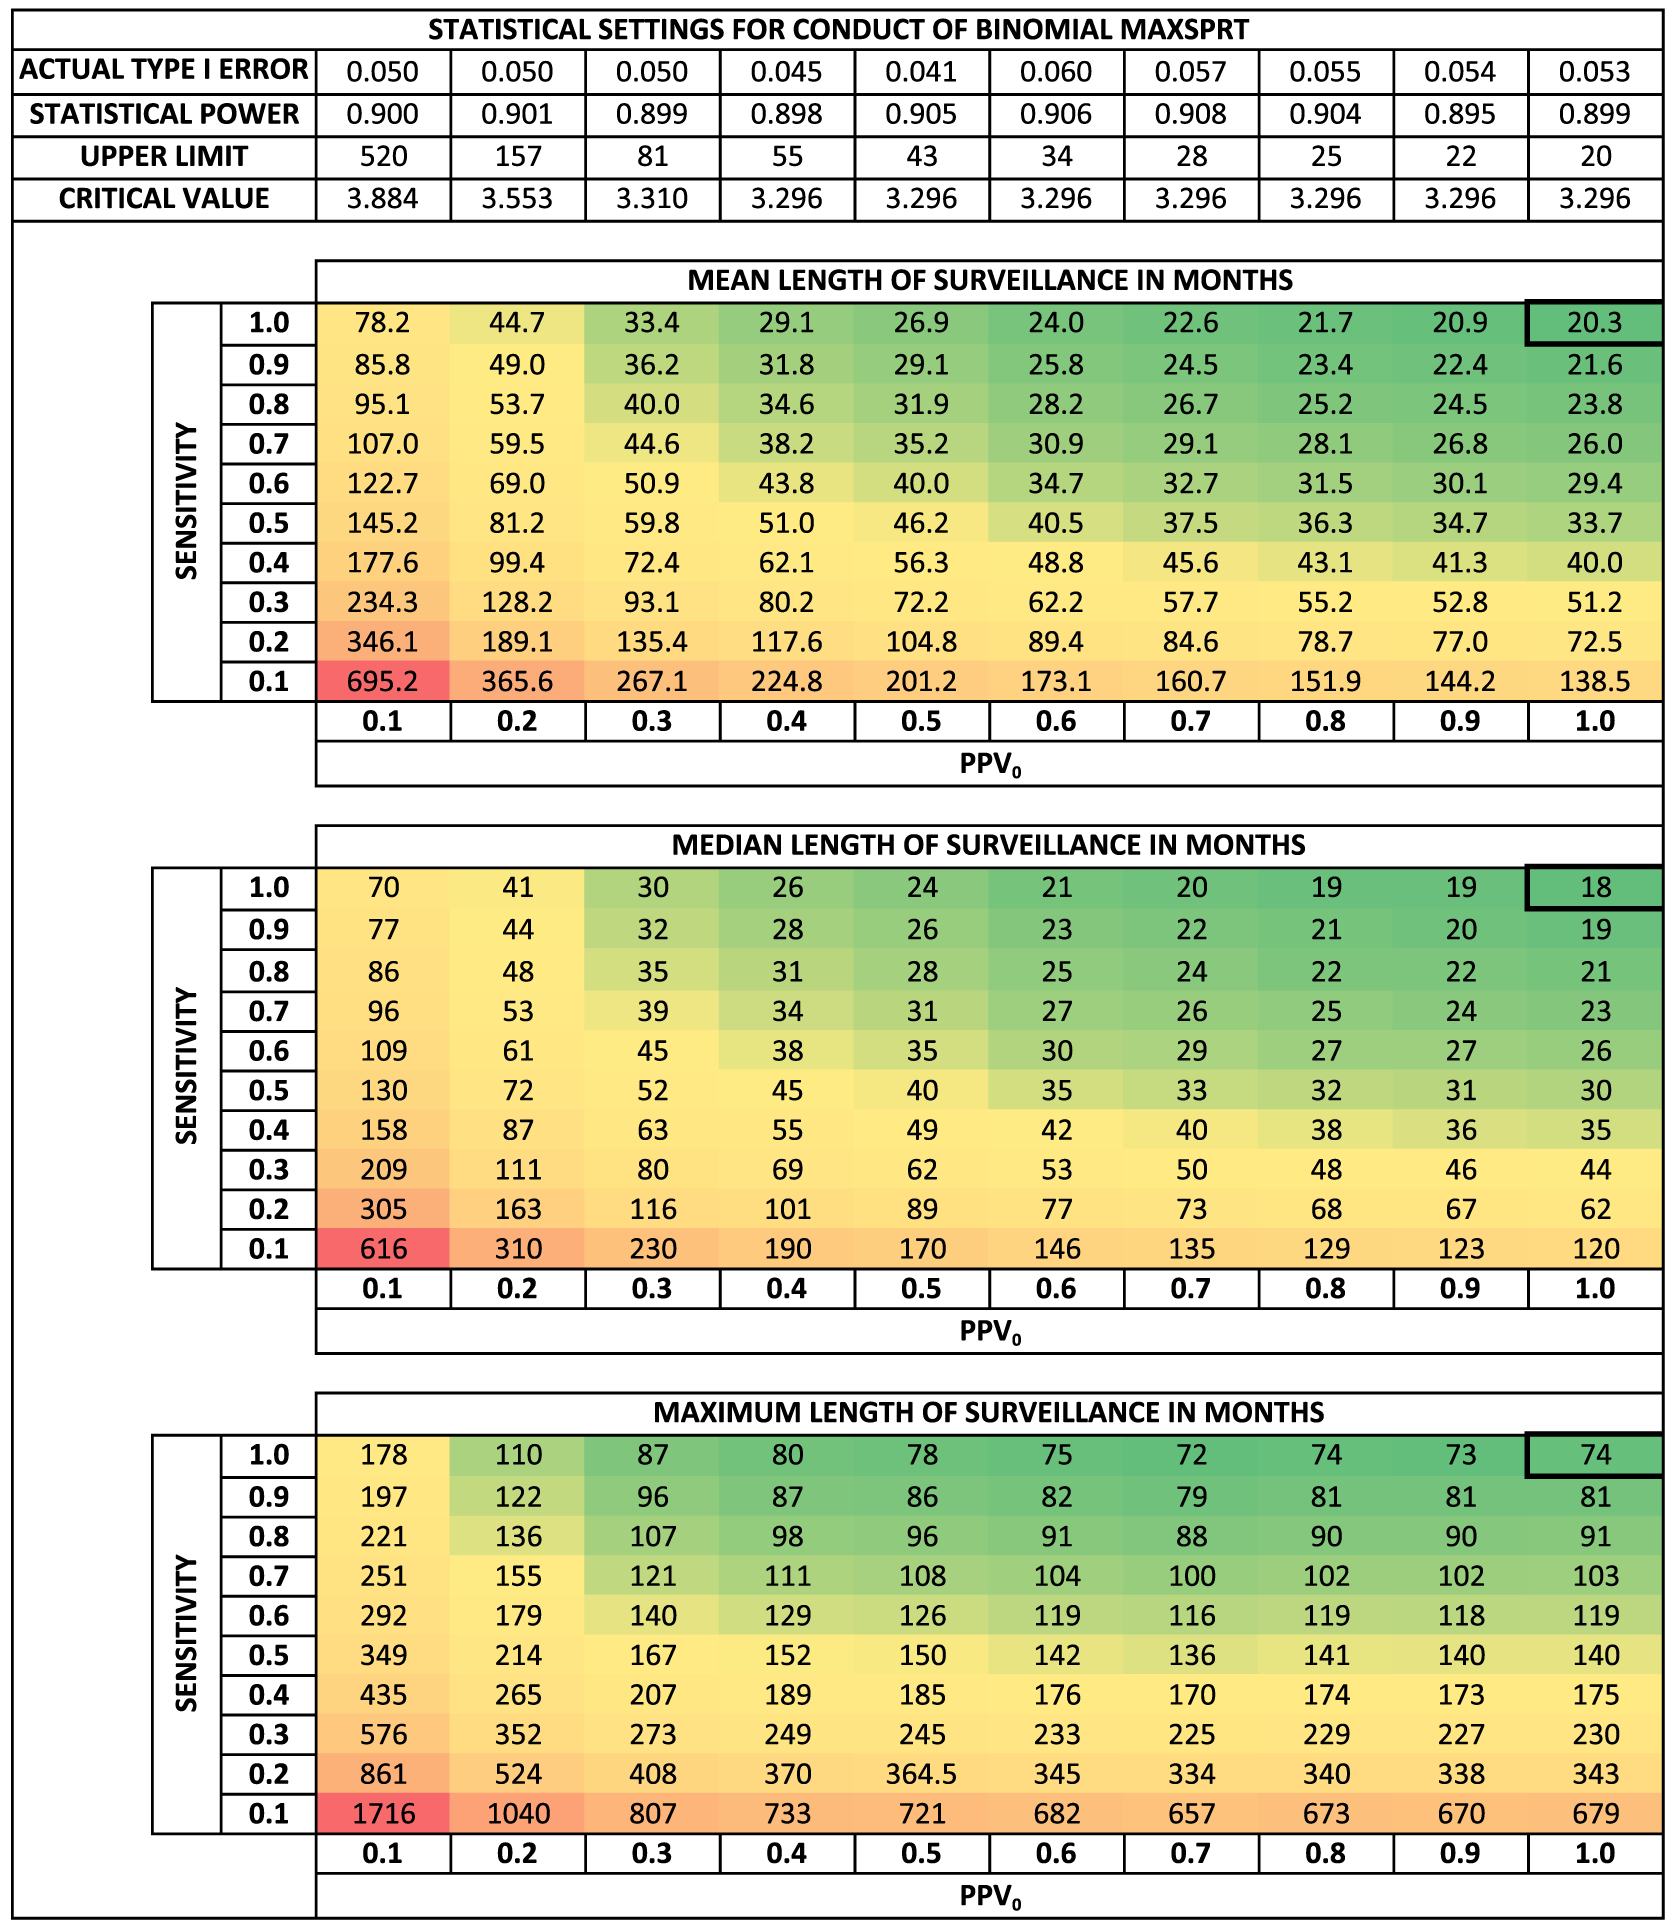
Mean, median, and maximum length of surveillance in months for various levels of misclassification using the self-controlled risk interval design. All parameters, with the exception of misclassification values, are as stated in Table 1. The actual type I error and statistical power achieved for the simulations are shown in the upper panel. The upper limit describes the number of events required to reach the end of surveillance while failing to reject the null. The critical value is a log likelihood ratio specifying the threshold for rejecting the null hypothesis of no excess risk. Ten thousand simulations per scenario. Abbreviations: PPV0, positive predictive value in the comparison population; MaxSPRT, maximized sequential probability ratio test
Comparing specific algorithms
First, we use Figures 1 and 2 to compare the reference case and three algorithms to obtain a general idea of the length of surveillance. The mean lengths of surveillance for the reference case and Algorithms 1–3 are 10.9, ~14.5, ~13.3, and ~16.4 months, respectively, when using the cohort design. The mean lengths of surveillance for the reference case and Algorithms 1–3 are 20.3, ~29.2, ~26.9, and ~31.5 months, respectively, when using the self-controlled risk interval design. Note that the most sensitive algorithm, that is, Algorithm 2, is the timeliest. However, recall that Algorithms 2 and 3 can only be executed on the subset of the data network with access to laboratory data. Is the increased sensitivity enough to overcome the reduced database size?
Table 3 contains a more fine-tuned comparison and accounts for the differences in the size of the dataset. We compare summary statistics in the distribution of the length of surveillance over a range of true effect sizes. For each case, the thickly boxed row represents the circumstances when the investigator has powered the surveillance to detect a fivefold incidence rate ratio with 90% power and the true effect size is a fivefold increased risk.
Table 3.
Descriptive statistics of the length of surveillance in months for two study designs over a range of true risks with misclassification
| True risks | Signala (%) | Mean (months) | Median (months) | 80th (months) | 95th (months) | ||||||
|---|---|---|---|---|---|---|---|---|---|---|---|
| IRDb | IRR | Poi | Bin | Poi | Bin | Poi | Bin | Poi | Bin | Poi | Bin |
| Reference casec: sensitivity = 1.0; PPV0 = 1.0; database size, 564 000 persons | |||||||||||
| 0 | 1.0 | 5.0 | 5.3 | 16.8 | 73.3 | 17 | 74 | 17 | 87 | 17 | 102 |
| 1 | 1.5 | 15.2 | 15.8 | 16.4 | 60.8 | 17 | 63 | 17 | 75 | 17 | 88 |
| 2 | 2.0 | 29.3 | 31.0 | 15.8 | 50.1 | 17 | 53 | 17 | 65 | 17 | 76 |
| 4 | 3.0 | 58.6 | 60.9 | 14.0 | 34.6 | 15 | 36 | 17 | 49 | 17 | 59 |
| 8 | 5.0 | 90.9 | 89.9 | 10.9 | 20.3 | 10 | 18 | 14 | 29 | 17 | 39 |
| 18 | 10.0 | 99.9 | 99.5 | 7.2 | 11.8 | 7 | 11 | 9 | 15 | 11 | 19 |
| Algorithm 1d: sensitivity = 0.84; PPV0 = 0.54; database size, 564 000 persons | |||||||||||
| 0 | 1.0 | 5.0 | 4.0 | 28.3 | 89.1 | 29 | 90 | 29 | 102 | 29 | 114 |
| 1 | 1.5 | 12.3 | 11.4 | 27.4 | 79.8 | 29 | 82 | 29 | 94 | 29 | 105 |
| 2 | 2.0 | 23.4 | 23.9 | 26.0 | 69.9 | 29 | 74 | 29 | 86 | 29 | 96 |
| 4 | 3.0 | 51.5 | 54.9 | 22.0 | 52.2 | 28 | 57 | 29 | 71 | 29 | 82 |
| 8 | 5.0 | 90.0 | 91.0 | 14.7 | 29.6 | 12 | 26 | 23 | 44 | 29 | 58 |
| 18 | 10.0 | >99.9 | 99.9 | 7.8 | 14.8 | 7 | 14 | 9 | 19 | 14 | 25 |
| Algorithm 2e: sensitivity = 0.99; PPV0 = 0.53; database size, 0.40 × 564 000 persons | |||||||||||
| 0 | 1.0 | 5.0 | 4.0 | 57.4 | 178.8 | 59 | 180 | 59 | 205 | 59 | 231 |
| 1 | 1.5 | 12.2 | 11.2 | 55.3 | 158.7 | 59 | 164 | 59 | 188 | 59 | 211 |
| 2 | 2.0 | 23.3 | 23.4 | 52.1 | 138.2 | 59 | 148 | 59 | 171 | 59 | 193 |
| 4 | 3.0 | 51.3 | 53.8 | 43.7 | 101.1 | 58 | 112 | 59 | 142 | 59 | 165 |
| 8 | 5.0 | 90.0 | 90.4 | 27.6 | 54.6 | 22 | 47 | 44 | 85 | 59 | 114 |
| 18 | 10.0 | >99.9 | 99.9 | 13.1 | 23.5 | 12 | 21 | 16 | 31 | 26 | 46 |
| Algorithm 3f: sensitivity = 0.59; PPV0 = 0.79; database size, 0.40 × 564 000 persons | |||||||||||
| 0 | 1.0 | 5.0 | 5.5 | 70.5 | 280.5 | 72 | 285 | 72 | 337 | 72 | 388 |
| 1 | 1.5 | 13.8 | 14.7 | 67.9 | 237.6 | 72 | 248 | 72 | 296 | 72 | 343 |
| 2 | 2.0 | 26.4 | 28.5 | 64.1 | 195.0 | 72 | 211 | 72 | 258 | 72 | 302 |
| 4 | 3.0 | 55.0 | 58.4 | 53.9 | 133.3 | 60 | 144 | 72 | 199 | 72 | 240 |
| 8 | 5.0 | 90.0 | 90.1 | 36.6 | 68.6 | 32 | 59 | 54 | 110 | 72 | 155 |
| 18 | 10.0 | >99.9 | 99.7 | 19.7 | 28.5 | 18 | 24 | 26 | 41 | 35 | 62 |
Bin, Binomial MaxSPRT Model; IRD, incidence rate difference; IRR, incidence rate ratio; Poi, Poisson MaxSPRT Model; PPV0, positive predictive value in the comparison population.
Signal (%) is the percent of time the null hypothesis is rejected.
Incidence rate difference is given in events per 100 000 person-years.
Poisson MaxSPRT upper limit = 1.371, Poisson MaxSPRT critical value = 1.663; binomial MaxSPRT upper limit = 20, binomial MaxSPRT critical value = 3.296.
Poisson MaxSPRT upper limit = 4.106, Poisson MaxSPRT critical value = 2.507; binomial MaxSPRT upper limit = 39, binomial MaxSPRT critical value = 3.296.
Poisson MaxSPRT upper limit = 4.226, Poisson MaxSPRT critical value = 2.522; binomial MaxSPRT upper limit = 39, binomial MaxSPRT critical value = 3.296.
Poisson MaxSPRT upper limit = 2.076, Poisson MaxSPRT critical value = 2.032; binomial MaxSPRT upper limit = 25, binomial MaxSPRT critical value = 3.296.
First, the database size advantage of Algorithm 1 over Algorithms 2 and 3 trumps Algorithm 2’s high sensitivity. That is, when database size is equal, Algorithm 2, that is, the most sensitive and inclusive algorithm, is preferred. However, given the large differences in database sizes, Algorithm 1 is timelier by a considerable margin. The length of surveillance would converge, and timeliness would be equivalent if Algorithm 2 could be executed on 85% of the data network.
DISCUSSION
We demonstrate that non-differential outcome misclassification has similar effects in sequential and non-sequential analysis. Specifically, we show longer surveillance times as a consequence of misclassification. Our intent with this illustrative example is not to focus on these specific results but rather to show a surveillance planning process for any exposure-outcome pair of interest.
The Mini-Sentinel System Distributed Database is consist of heterogeneous component databases, which provides opportunities to tailor surveillance. These component databases fall into two general categories: (i) health insurer claims databases and (ii) integrated delivery system databases. Health insurer claims databases account for the bulk of data, but the integrated delivery system databases have access to richer clinical data (e.g., laboratory data) and have timelier medical chart validation procedures.
Although the straightforward strategy is to use inclusive algorithms (i.e., high sensitivity with moderate PPV) that can be executed unconditionally across the data network, this decision may change considerably if medical chart validation was a requirement. Substantial additional time would be added to the length of surveillance if medical chart validation was required to confirm an electronic case before allowing it to contribute to a “chart-confirmed” signal. The total additional time delay would depend on the frequency of the outcome of interest and the sampling strategy for medical chart validation. Consequently, our finding that the inclusive algorithm outperforms the narrower algorithm (i.e., lower sensitivity with higher PPV) is not general, but depends on the circumstances of the safety problem and the data network used to evaluate it. However, our proposed procedure for assessing these algorithms is general enough to apply to other investigators involved in planning sequential surveillance.
In non-vaccine contexts, assuming misclassification is non-differential in nature may be an assumption that is difficult to justify. Therapeutics are administered to people with active disease processes, and additional medical visits and/or diagnostics tests are likely to follow from exposure to new therapeutics as part of the normal course of care. These follow-up visits and tests create differential opportunities to detect adverse events among the exposed, thereby creating differential misclassification between exposed and unexposed cohorts. Comparison populations composed of users of active comparators as opposed to non-users may mitigate this possibility, especially to the extent that the exposures have a similar expected effect on routine medical utilization.
We performed our simulations assuming a rare outcome of interest. We expect the same relative patterns to hold for more frequent outcomes because the amount of information required to signal is indifferent to the event rate. That is, we expect non-differential outcome misclassification to similarly increase the length of surveillance with decreased sensitivity or PPV relative to the reference case of no misclassification. However, the absolute length of surveillance will be quite different with more frequent outcome rates.
Our findings also raise an important design question for future observational data networks. Specifically, how to best balance the inclusion of smaller integrated delivery systems that can more easily access clinical data (e.g., medical charts) as compared with large insurers without such access but with substantially larger cohorts. We leave a discussion of that question for another day.
CONCLUSION
We show, via a vaccine example, how non-differential outcome misclassification affects the timeliness of sequential database surveillance in observational data networks. Other investigators/users of these types of networks can replicate these study design calculations for their settings.
Supplementary Material
KEY POINTS.
Outcome misclassification is a concern when using observational data to evaluate medical product-associated safety risks.
Investigators may use a surveillance planning process to better understand how outcome detection algorithms affect the timeliness of signal detection and the length of surveillance.
Inclusive outcome detection algorithms (high sensitivity, moderate positive predictive value) are timelier than narrow algorithms (moderate sensitivity, high positive predictive value), but requirements for medical chart validation substantially affect this result.
ACKNOWLEDGEMENTS
We thank Ivair Silva for his help troubleshooting coding errors during this project.
JCM was supported in part by an appointment to the Research Participation Program at the Center for Drug Evaluation and Research administered by the Oak Ridge Institute for Science and Education through an interagency agreement between the US Department of Energy and the US Food and Drug Administration.
JSB and MK are supported in part by the Mini-Sentinel Contract, which is funded by the USFDA through the Department of Health and Human Services contract number HHSF223200910006I.
The findings and conclusions in this paper are those of the authors and do not necessarily represent the views of the US Food and Drug Administration.
Footnotes
CONFLICT OF INTEREST
The authors declare no conflict of interest.
ETHICS STATEMENT
The Health and Human Services Office of Human Research Protections determined that the Common Rule does not apply to activities included in the FDA’s Sentinel Initiative. This assessment also applies to Mini-Sentinel activities such as the work detailed in this paper, as Mini-Sentinel is part of the Sentinel Initiative. Because Mini-Sentinel activities are public health activities in support of FDA’s public health mission, they are not under the purview of institutional review boards or privacy boards.
SUPPORTING INFORMATION
Additional supporting information may be found in the online version of this article at the publisher’s web site.
REFERENCES
- 1.Carnahan RM. Mini-Sentinel’s systematic reviews of validated methods for identifying health outcomes using administrative data: summary of findings and suggestions for future research. Pharmacoepidemiol Drug Saf 2012; 21(Suppl 1): 90–99. doi: 10.1002/pds.2318. [DOI] [PubMed] [Google Scholar]
- 2.Cutrona SL, Toh S, Iyer A, et al. Validation of acute myocardial infarction in the Food and Drug Administration’s Mini-Sentinel program. Pharmacoepidemiol Drug Saf 2013; 22: 40–54. doi: 10.1002/pds.3310. [DOI] [PMC free article] [PubMed] [Google Scholar]
- 3.Walsh KE, Cutrona SL, Foy S, et al. Validation of anaphylaxis in the Food and Drug Administration’s Mini-Sentinel. Pharmacoepidemiol Drug Saf 2013. doi: 10.1002/pds.3505. [DOI] [PMC free article] [PubMed] [Google Scholar]
- 4.Lo Re V 3rd, Haynes K, Goldberg D, et al. Validity of diagnostic codes to identify cases of severe acute liver injury in the US Food and Drug Administration’s Mini-Sentinel Distributed Database. Pharmacoepidemiol Drug Saf 2013; 22: 861–872. doi: 10.1002/pds.3470. [DOI] [PMC free article] [PubMed] [Google Scholar]
- 5.Jurek AM, Greenland S, Maldonado G. How far from non-differential does exposure or disease misclassification have to be to bias measures of association away from the null? Int J Epidemiol 2008; 37: 382–385. doi: 10.1093/ije/dym291. [DOI] [PubMed] [Google Scholar]
- 6.Greenland S, Gustafson P. Accounting for independent nondifferential misclassification does not increase certainty that an observed association is in the correct direction. Am J Epidemiol 2006; 164: 63–68. doi: 10.1093/aje/kwj155. [DOI] [PubMed] [Google Scholar]
- 7.Jurek AM, Greenland S, Maldonado G, Church TR. Proper interpretation of non-differential misclassification effects: expectations vs observations. Int J Epidemiol 2005; 34: 680–687. doi: 10.1093/ije/dyi060. [DOI] [PubMed] [Google Scholar]
- 8.Fox MP, Lash TL, Greenland S. A method to automate probabilistic sensitivity analyses of misclassified binary variables. Int J Epidemiol 2005; 34: 1370–1376. doi: 10.1093/ije/dyi184. [DOI] [PubMed] [Google Scholar]
- 9.Greenland S. Basic methods for sensitivity analysis of biases. Int J Epidemiol 1996; 25: 1107–1116. [PubMed] [Google Scholar]
- 10.Mullooly JP. Misclassification model for person-time analysis of automated medical care databases. Am J Epidemiol 1996; 144: 782–792. [DOI] [PubMed] [Google Scholar]
- 11.Brenner H, Gefeller O. Use of the positive predictive value to correct for disease misclassification in epidemiologic studies. Am J Epidemiol 1993; 138: 1007–1015. [DOI] [PubMed] [Google Scholar]
- 12.Poole C. Exception to the rule about nondifferential misclassification. (Abstract). Am J Epidemiol 1985; 122: 508. [Google Scholar]
- 13.Green MS. Use of predictive value to adjust relative risk estimates biased by misclassification of outcome status. Am J Epidemiol 1983; 117: 98–105. [DOI] [PubMed] [Google Scholar]
- 14.Copeland KT, Checkoway H, McMichael AJ, Holbrook RH. Bias due to misclassification in the estimation of relative risk. Am J Epidemiol 1977; 105: 488–495. [DOI] [PubMed] [Google Scholar]
- 15.Greenland S. Multiple-bias modelling for analysis of observational data. J R Stat Soc A Stat Soc 2005; 168: 267–306. doi: 10.1111/j.1467-985X.2004.00349.x. [DOI] [Google Scholar]
- 16.Jennison C, Turnbull BW. Group Sequential Methods With Applications to Clinical Trials. Boca Raton: Chapman & Hall/CRC, 2000. [Google Scholar]
- 17.Whitehead J The Design and Analysis of Sequential Clinical Trials. Chichester, UK: Wiley, 1997. [Google Scholar]
- 18.Xu S, Newcomer S, Nelson J, et al. Signal detection of adverse events with imperfect confirmation rates in vaccine safety studies using self-controlled case series design. Biom J 2014: n/a–n/a. doi: 10.1002/bimj.201300012 [DOI] [PubMed] [Google Scholar]
- 19.McClure DL, Glanz JM, Xu S, Hambidge SJ, Mullooly JP, Baggs J. Comparison of epidemiologic methods for active surveillance of vaccine safety. Vaccine 2008; 26: 3341–3345. doi: 10.1016/j.vaccine.2008.03.074. [DOI] [PubMed] [Google Scholar]
- 20.Maro JC, Brown JS, Kulldorff M. Medical product safety surveillance: how many databases to use? Epidemiology 2013; 24: 692–699. doi: 10.1097/EDE.0b013e31829dde59. [DOI] [PubMed] [Google Scholar]
- 21.Maro JC, Brown JS. Impact of exposure accrual on sequential postmarket evaluations: a simulation study. Pharmacoepidemiol Drug Saf 2011; 20: 1184–1191. doi: 10.1002/pds.2223. [DOI] [PubMed] [Google Scholar]
- 22.Platt R, Carnahan RM, Brown JS, et al. The U.S. Food and Drug Administration’s Mini-Sentinel program: status and direction. Pharmacoepidemiol Drug Saf 2012; 21(Suppl 1): 1–8. doi: 10.1002/pds.2343. [DOI] [PubMed] [Google Scholar]
- 23.Nelson JC, Cook AJ, Yu O, et al. Challenges in the design and analysis of sequentially monitored postmarket safety surveillance evaluations using electronic observational health care data. Pharmacoepidemiol Drug Saf 2012; 21(Suppl 1): 62–71. doi: 10.1002/pds.2324. [DOI] [PubMed] [Google Scholar]
- 24.Chubak J, Pocobelli G, Weiss NS. Tradeoffs between accuracy measures for electronic health care data algorithms. J Clin Epidemiol 2012; 65: 343–349.e2. doi: 10.1016/j.jclinepi.2011.09.002 [DOI] [PMC free article] [PubMed] [Google Scholar]
- 25.Yih WK, Lee GM, Lieu TA, et al. Surveillance for adverse events following receipt of pandemic 2009 H1N1 vaccine in the Post-Licensure Rapid Immunization Safety Monitoring (PRISM) System, 2009–2010. Am J Epidemiol 2012; 175: 1120–1128. doi: 10.1093/aje/kws197. [DOI] [PubMed] [Google Scholar]
- 26.Tse A, Tseng HF, Greene SK, Vellozzi C, Lee GM. Signal identification and evaluation for risk of febrile seizures in children following trivalent inactivated influenza vaccine in the Vaccine Safety Datalink Project, 2010–2011. Vaccine 2012; 30: 2024–2031. doi: 10.1016/j.vaccine.2012.01.027. [DOI] [PubMed] [Google Scholar]
- 27.Greene SK, Kulldorff M, Yin R, et al. Near real-time vaccine safety surveillance with partially accrued data. Pharmacoepidemiol Drug Saf 2011; 20: 583–590. doi: 10.1002/pds.2133. [DOI] [PubMed] [Google Scholar]
- 28.Gee J, Naleway A, Shui I, et al. Monitoring the safety of quadrivalent human papillomavirus vaccine: findings from the Vaccine Safety Datalink. Vaccine 2011; 29: 8279–8284. doi: 10.1016/j.vaccine.2011.08.106. [DOI] [PubMed] [Google Scholar]
- 29.Lee GM, Greene SK, Weintraub ES, et al. H1N1 and seasonal influenza vaccine safety in the Vaccine Safety Datalink Project. Am J Prev Med 2011; 41: 121–128. doi: 10.1016/j.amepre.2011.04.004. [DOI] [PubMed] [Google Scholar]
- 30.Klein NP, Fireman B, Yih WK, et al. Measles-mumps-rubella-varicella combination vaccine and the risk of febrile seizures. Pediatrics 2010; 126: e1–8. doi: 10.1542/peds.2010-0665. [DOI] [PubMed] [Google Scholar]
- 31.Belongia EA, Irving SA, Shui IM, et al. Real-time surveillance to assess risk of intussusception and other adverse events after pentavalent, bovine-derived rotavirus vaccine. Pediatr Infect Dis J 2010; 29: 1–5. doi: 10.1097/INF.0b013e3181af8605. [DOI] [PubMed] [Google Scholar]
- 32.Greene SK, Kulldorff M, Lewis EM, et al. Near real-time surveillance for influenza vaccine safety: proof-of-concept in the Vaccine Safety Datalink Project. Am J Epidemiol 2010; 171: 177–188. doi: 10.1093/aje/kwp345. [DOI] [PMC free article] [PubMed] [Google Scholar]
- 33.Lieu TA, Kulldorff M, Davis RL, et al. Real-time vaccine safety surveillance for the early detection of adverse events. Med Care 2007; 45: S89–95. doi: 10.1097/MLR.0b013e3180616c0a. [DOI] [PubMed] [Google Scholar]
- 34.O’Leary ST, Glanz JM, McClure DL, et al. The risk of immune thrombocytopenic purpura after vaccination in children and adolescents. Pediatrics 2012; 129: 248–255. doi: 10.1542/peds.2011-1111. [DOI] [PubMed] [Google Scholar]
- 35.France EK, Glanz J, Xu S, et al. Risk of immune thrombocytopenic purpura after measles-mumps-rubella immunization in children. Pediatrics 2008; 121: e687–692. doi: 10.1542/peds.2007-1578. [DOI] [PubMed] [Google Scholar]
- 36.Glanz J, France E, Xu S, Hayes T, Hambidge S. A population-based, multisite cohort study of the predictors of chronic idiopathic thrombocytopenic purpura in children. Pediatrics 2008; 121: e506–512. doi: 10.1542/peds.2007-1129. [DOI] [PubMed] [Google Scholar]
- 37.Terrell DR, Beebe LA, Vesely SK, Neas BR, Segal JB, George JN. Determining a definite diagnosis of primary immune thrombocytopenia by medical record review. Am J Hematol 2012; 87: 843–847. doi: 10.1002/ajh.23226. [DOI] [PMC free article] [PubMed] [Google Scholar]
- 38.Yih WK, Kulldorff M, Fireman BH, et al. Active surveillance for adverse events: the experience of the Vaccine Safety Datalink project. Pediatrics 2011; 127(Suppl 1): S54–64. doi: 10.1542/peds.2010-1722I. [DOI] [PubMed] [Google Scholar]
- 39.Kulldorff M, Davis RL, Kolczak M, Lewis E, Lieu TA, Platt R. A maximized sequential probability ratio test for drug and vaccine safety surveillance. Seq Anal 2011; 30: 58–78. doi: 10.1080/07474946.2011.539924. [DOI] [Google Scholar]
- 40.Greene SK, Rett M, Weintraub ES, et al. Risk of confirmed Guillain-Barre syndrome following receipt of monovalent inactivated influenza a (H1N1) and seasonal influenza vaccines in the Vaccine Safety Datalink Project, 2009–2010. Am J Epidemiol 2012; 175: 1100–1109. doi: 10.1093/aje/kws195. [DOI] [PMC free article] [PubMed] [Google Scholar]
- 41.Wald A. Sequential tests of statistical hypotheses. Ann Math Stat 1945; 16: 117–186. [Google Scholar]
- 42.Curtis LH, Weiner MG, Boudreau DM, et al. Design considerations, architecture, and use of the Mini-Sentinel Distributed Data System. Pharmacoepidemiol Drug Saf 2012; 21(Suppl 1): 23–31. doi: 10.1002/pds.2336. [DOI] [PubMed] [Google Scholar]
- 43.Centers for Disease Control and Prevention. National Vital Statistics System. Available at: http://www.cdc.gov/nchs/nvss.htm. Accessed [October 11, 2012].
- 44.Avery TR, Kulldorff M, Vilk Y, et al. Near real-time adverse drug reaction surveillance within population-based health networks: methodology considerations for data accrual. Pharmacoepidemiol Drug Saf 2013; 22: 488–495. doi: 10.1002/pds.3412. [DOI] [PMC free article] [PubMed] [Google Scholar]
- 45.Segal JB, Powe NR. Accuracy of identification of patients with immune thrombocytopenic purpura through administrative records: a data validation study. Am J Hematol 2004; 75: 12–17. doi: 10.1002/ajh.10445. [DOI] [PubMed] [Google Scholar]
Associated Data
This section collects any data citations, data availability statements, or supplementary materials included in this article.