

Summary
Herein, we utilized spontaneous models of pancreatic and lung cancer to examine how neoantigenicity shapes tumor immunity and progression. As expected, neoantigen expression during lung adenocarcinoma development leads to T cell-mediated immunity and disease restraint. By contrast, neoantigen expression in pancreatic adenocarcinoma (PDAC) results in exacerbation of a fibro-inflammatory microenvironment that drives disease progression and metastasis. Pathogenic TH17 responses are responsible for this neoantigen-induced tumor progression in PDAC. Underlying these divergent T cell responses in pancreas and lung cancer are differences in infiltrating conventional dendritic cells (cDCs). Overcoming cDC deficiency in early-stage PDAC leads to disease restraint, while restoration of cDC function in advanced PDAC restores tumor-restraining immunity and enhances responsiveness to radiation therapy.
Keywords: Dendritic cell, pancreatic cancer, neoantigen, immune surveillance, vaccination, fibrosis, CD40, Flt3L, immunotherapy, radiation therapy
Graphical Abstract

In Brief
Hegde et al. identify divergent T cell responses in lung cancer and pancreatic adenocarcinoma (PDAC) caused by differences in conventional dendritic cell (cDC) infiltration. Mobilization of cDCs in PDAC models enhances CD8+ T cell and TH1 activity to reduce tumor growth and increase response to therapy.
Introduction
Pancreatic ductal adenocarcinoma (PDAC) is notoriously resistant to immunotherapy, including cytokine therapy, adoptive T cell therapy and checkpoint blockade strategies (Brahmer et al., 2012; Kunk et al., 2016; Royal et al., 2010). Failure of these therapies has been attributed to CD8+ T cell scarcity and profound immunosuppression in the PDAC microenvironment (Beatty et al., 2015; Stromnes et al., 2014; Zhang et al., 2016). However, recent studies have challenged this ‘homogenous’ paradigm and revealed that many PDAC patients indeed harbor intratumoral T cells and potentially actionable neoantigens that can elicit T cell responses (Bailey et al., 2016a; Bailey et al., 2016b; Balachandran et al., 2017; Cristescu et al., 2018; Poschke et al., 2016). In order to develop therapies to revive T cell responses to neoantigens in PDAC, it is critical to understand how this endogenous T cell response becomes ineffectual.
The magnitude and persistence of a T cell response against a tumor is dependent on initial priming by antigen-presenting cells. Conventional DCs (cDCs) have been recognized as critical mediators of antigen-priming and T cell activity, with Batf3/Irf8-dependent CD103+ CD24+ cDC1s being responsible for CD8+ cytotoxic T lymphocyte (CTL) cross-priming and Irf4-dependent CD11b+ CD172a+ cDC2s being implicated in helper CD4+ T cell (TH) priming (Gardner and Ruffell, 2016). In addition to initial T cell priming, cDCs have been implicated in T cell-dependent tumor killing and response to immunotherapies (Binnewies et al., 2019; de Mingo Pulido et al., 2018; Roberts et al., 2016; Salmon et al., 2016; Spranger et al., 2017). Studies on antigen-presenting cells (APCs) in PDAC models have focused on tolerogenic subsets (Barilla et al., 2019; Bellone et al., 2014; Jang et al., 2017; Ochi et al., 2012). Presently, more granular studies of DC subsets in the PDAC context are needed to distinguish the differential impact of cDCs from monocytic and other inflammatory APC subsets.
Studies in cancers of different etiologies have shown that neoantigen-directed immunity can be subverted by diverse mechanisms (DuPage et al., 2011; DuPage et al., 2012; Gubin et al., 2014; Schietinger et al., 2016); mechanisms of immune evasion in PDAC are thus worth elucidating. However, existing genetic models for PDAC have not been amenable to study the heterogeneous interactions between developing tumors and the host adaptive immunity due to a dearth of tumor-specific neoepitopes (Evans et al., 2016). Transplanted PDAC models are constrained by their lack of stroma and a very distinct inflammatory/immunized milieu upon tumor grafting, which can mask de novo immune responses (Spear et al., 2019). In this study, we sought to determine how antigen-specific anti-tumor immunity becomes dysregulated during progression of autochthonous PDAC.
Results
Neoantigen expression during pancreas cancer development elicits antigen-specific responses
The “KPC” genetic mouse model of pancreas cancer has been widely used because of its fidelity to human PDAC, notably activating mutations in Kras(G12D) and loss of Trp53, associated desmoplasia, and inflammation (Hingorani et al., 2003; Morton et al., 2010). The model also mirrors human disease in its resistance to both cytotoxic and immunotherapies (Beatty et al., 2011; Gopinathan et al., 2015). However, KPC mice seldom develop additional genetic alterations that drive prominent neoantigens for studying immune surveillance and evasion (Evans et al., 2016; Li et al., 2018). Studies that have assessed the impact of antigenicity have utilized heterotopic or orthotopic tumor grafts that do not recapitulate de novo pancreas cancer progression and thus may have very divergent immune contexture (Spear et al., 2019). To study antigen-specific responses in the context of de novo pancreas cancer development, we engineered a mouse designed to express a model neoantigen chicken ovalbumin (OVA) bicistronically with green fluorescent protein (GFP) under the control of both Cre activation and tetracycline repression (R26tm1(LSL-OG) or OG, Figure 1A). The presence of neoepitopes for CD8+ T cell, CD4+ T cells and B cells allows us to study OVA-specific cellular and humoral immunity raised during the course of tumor progression. These ‘OG’ mice were crossed to KPC mice to create ‘KPC-OG’ mice.
Figure 1. Neoantigen expression during pancreas cancer development elicits antigen-specific responses.

(A) Genetic loci for KPC-OG model and immunoblot for OVA and GFP expression in KPC-OG-derived cell line 72 hours after doxycycline withdrawal. Representative of three independent cell lines.
(B) Gross images (LEFT) of pancreatic tissue at 6 weeks in KPC-OG mice on or off doxycycline, and (RIGHT) immunofluorescence images of pancreatic tumors at 36 weeks in KPC-OG mice on or off doxycycline.
(C) KPC-OG tumor-derived cell line depicting GFP fluorescence after 24-hour co-culture with antigen-specific (OT-I TCR) or non-specific (C57Bl/6) activated CD8+ T cells (CTL) consistent across three independent cell lines, n=3/group.
(D) Representative images and quantification of CD8+ T cells, CD4+ T cells and B220+ B cells in 6-week-old KPC-OG and KPC mice. n=10 mice/group.
(E) Density of CD8+ T cells, CD4+ TH, CD4+ TREG and CD19+CD22+ B cells measured by flow cytometry in early stage KPC-OG and KPC mice. n=5–8 mice/group.
(F) Density of OVA-specific CD8+ T cells in pancreas, pancreas-dLN, and spleen of early stage KPC-OG and PC-OG mice. n=3–8 mice/group.
Data were consistent across two independent experiments. Scale bar denotes 100 μm in (B) and (D). n.s., not significant; *p < 0.05. Data is presented as mean ± SEM. For comparisons between two groups, Student’s two-tailed t-test used. See also Figure S1.
We first sought to test several key parameters of this model, including antigen expression and presentation, CD8+ T cell recognition and central tolerance. Using KPC-OG mice and cell lines derived from tumors (KP-OG cells), we found that PDAC cells express OVA and GFP which can be repressed by administration of doxycycline (Figure 1A). Notably, similar to other lineage-tracing studies in this model (Rhim et al., 2012), GFP and OVA were expressed concomitant with early transformation and induction of metaplasia. As such, >95% of cytokeratin 19+ (CK19) ductal cells co-expressed GFP (Figure 1B). Tumor lines derived from KPC-OG mice express MHC-I at equivalent levels to traditional KPC mice (Figure S1A). To assess functional antigen presentation by KPC-OG tumor cells, we performed T cell killing assays ex vivo using OVA-specific OT-I CD8+ T cells and found T cells both recognized and killed KPC-OG-derived cells (Figures 1C and S1B). In order to verify that endogenous antigen-specific T cells generated in OG+ mice were not subjected to central tolerance prior to tumorigenesis, we vaccinated tumor-free p48-Cre;Trp53fl/fl;OG (PC-OG) mice with OVA and observed a clear enrichment of dextramer+ OVA-specific CD8+ T cells in peripheral blood and draining lymph nodes (Figure S1C). Furthermore, we implanted KPC-OG-derived tumor cells into PC-OG or PC (control) littermates in the presence or absence of doxycycline. We observed that grafted antigen-positive KP-OG cells grew equally slowly in PC-OG and PC mice, and doxycycline repression of OVA expression led to tumor progression (Figure S1D). Together, these data suggest that p48-Cre-driven OVA neoantigen in developing pancreatic tumors is presented and recognized by T cells not subject to thymic deletion. Notably, we found that untreated KPC-OG mice had equivalent OVA-specific T cell density as mice with doxycycline-withdrawal at birth, so we did not treat with doxycycline for the remainder of the studies.
To determine the impact of neoantigen expression during tumor initiation, we analyzed immune infiltrates in pre-cancerous lesions of KPC-OG or KPC mice. At early stage of tumorigenesis (6 weeks), we observed increased infiltration of CD8+ and CD4+ T cells and B220+ B cells in KPC-OG mice compared to KPC littermates (Figures 1D–E). Assessing antigen-specific responses, we observed increased numbers of OVA-dextramer+ CD8+ T cells in pre-malignant pancreas, draining lymph nodes (dLN) and spleens of early stage KPC-OG compared to non-tumor bearing PC-OG mice (Figure 1F). Interestingly, compared to control animals, the dextramer+ CD8+ T cells in KPC-OG pancreas had higher Ki67+ frequency; but >30% of these cells were PD1hi/TIM3hi, suggesting an early exhausted/dysfunctional phenotype (Figures S1E–F). This recapitulates observations in liver cancer models that found a reversibly-dysfunctional phenotype (Schietinger et al., 2016). To ascertain if there was a systemic response towards tumor neoantigens, we measured OVA IgG levels in serum. We found total IgG1 to be similar between KPC-OG and KPC littermates, but OVA-specific IgG1 titers in KPC-OG serum were markedly higher than age-matched controls (Figure S1G). Together, these data suggest that there is an antigen-directed immune response in KPC-OG pancreas during initial stages of tumorigenesis. These observations emphasize that early pancreatic lesions do not grow out in an immune-privileged environment.
Neoantigen expression accelerates PDAC progression but restrains lung adenocarcinomas
To evaluate the impact of neoantigen expression on pancreatic cancer progression we employed three distinct PDAC models. We utilized the KPC-OG mouse (p53fl/+) and validated our findings in the KPPC-OG model (p53fl/fl), which exhibits faster progression. Surprisingly, in both models we found that OG expression accelerated tumor progression at every stage of disease. In early stage KPC-OG mice at 6 weeks, we found that OG expression led to a marked increase in intraepithelial neoplasia (PANIN) area, higher grade PANIN lesions and increased tumor cell proliferation (Figures 2A–B, and S2A). Associated with this early disease progression was an increased collagen deposition and α-SMA+ fibroblast density (Figures 2C–D, and S2B). Analysis of the inflammatory infiltrates indicated an increased infiltration of neutrophils, eosinophils and macrophages, but not NK, NKT or γδT cells (Figures 2E, and S2C–D). Correspondingly, OG+ mice had reduced overall survival and tumors were of higher grade with markedly more liver metastases (Figures 2F–H). To understand the mechanisms underpinning enhanced disease progression, we conducted RNA sequencing (RNA-seq) of matched KPC-OG and KPC tissue. We observed enrichment of mitogenic pathways (including MAPK, EGFR and TNF signaling) and inflammatory pathway activation, along with a robust upregulation of EGFR ligands (Ray et al., 2014) and pro-inflammatory myeloid chemokines (Figures S2E, Table S1 and S2). Correspondingly, we observed increased phosphorylated-ERK, -STAT3 and -EGFR staining in transformed cells of KPC-OG mice (Figure S2F), suggesting the neoantigen results in changes in the TME that support key pathways of transformation and progression.
Figure 2. Neoantigen expression accelerates PDAC progression but restrains lung adenocarcinomas.
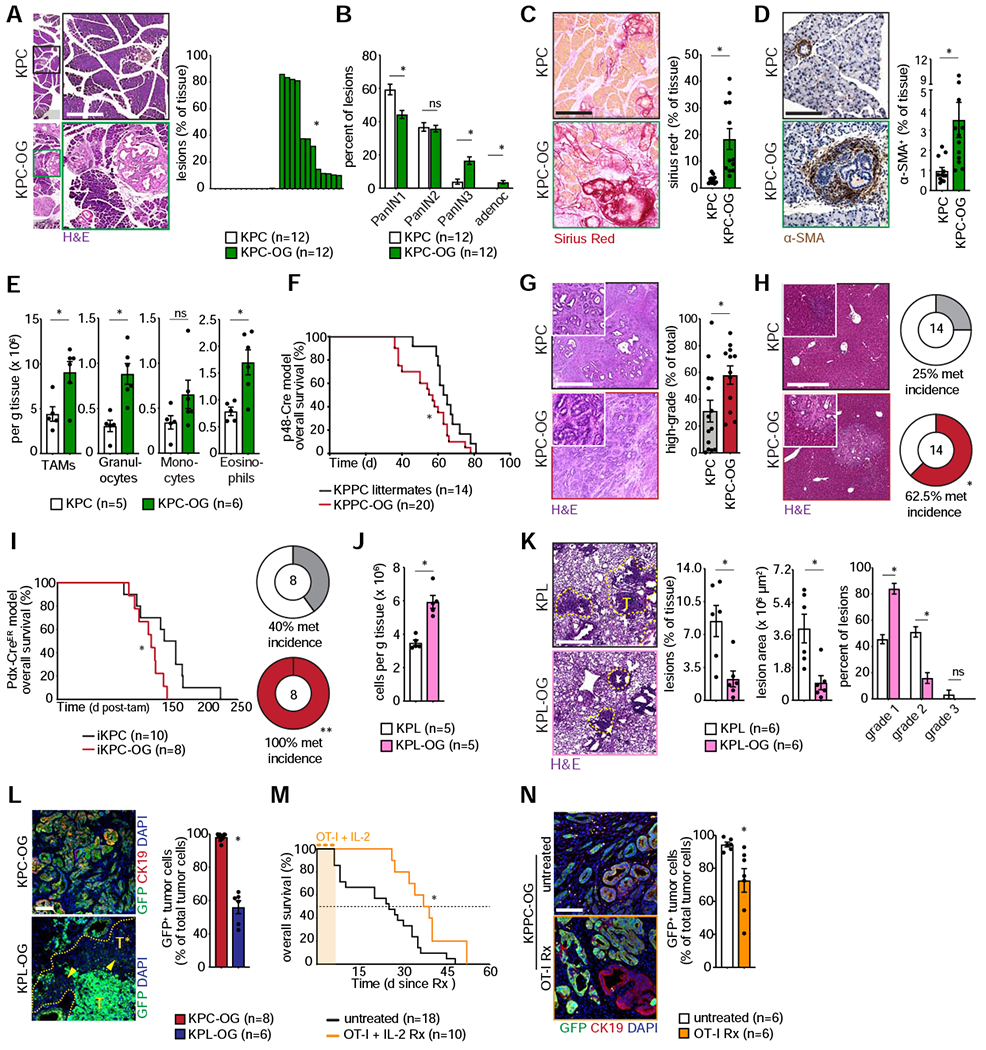
(A) Representative H&E images with quantification of lesions in early stage KPC-OG and KPC mice. n=12 mice/group.
(B) Lesion grades for early stage KPC-OG and KPC pancreata. n=12 mice/group.
(C) Sirius Red staining with quantification in KPC-OG and KPC mice. n=12 mice/group.
(D) αSMA staining with quantification in KPC-OG and KPC mice. n=12 mice/group.
(E) Flow cytometric quantification of various myeloid infiltrates in KPC-OG and KPC mice. n=5–6 mice/group.
(F) Kaplan-Meier survival curve for KPPC-OG mice compared to KPPC littermates. n=14–20 mice/group.
(G) Representative histology of late stage KPC-OG and KPC tumors with quantification of high-grade tumors. n=14–16 mice/group.
(H) Representative H&E images of late stage KPC-OG and KPC livers with quantification of metastases. n=14 mice/group.
(I) Kaplan-Meier survival curve for Pdx1-Cre-ER™-driven iKPC-OG mice compared to iKPC littermates, with quantification of liver metastases. n=8–10 mice/group.
(J) Density of CD8+ T cells in early stage KPL-OG and KPL lung lesions. n=5 mice/group.
(K) Representative H&E images of early stage KPL-OG and KPL lung with quantification of lesion area and grade. Lesions demarcated by yellow line. n=5 mice/group.
(L) Representative immunofluorescence images and quantification of GFP (green) expression in CK19+ (red) tumors of late stage KPC-OG or KPL-OG tumors. GFP-negative lesions in KPL-OG tumors are demarcated by yellow arrowhead. n=6–8 mice/group.
(M) Overall survival since start of treatment for KPPC-OG mice undergoing OT-I adoptive transfer therapy, compared to untreated controls. n=10–18 mice/group.
(N) Representative immunofluorescence images and quantification of GFP (green) expression in CK19+ (red) tumors of KPPC-OG mice subjected to OT-I adoptive transfer, compared to untreated controls. n=6 mice/group.
Data were consistent across two independent experiments. Scale bar denotes 500 μm in (A), (C), (D), (G), (H) and (K); 100 μm in (L) and (N). n.s., not significant; *p < 0.05, **p < 0.01. Data is presented as mean ± SEM. For comparisons between two groups, Student’s two-tailed t-test used. For survival analyses, Log-rank (Mantel-Cox) test used. See also Figure S2, Table S1 and S2.
To address the issue that p48-Cre recombination occurs early in pancreas development and leads to recombination in the majority of acinar cell, we employed an inducible Pdx1-Cre-ER™ driver (Gu et al., 2002). We generated Pdx1-Cre-ER™;KrasLSL-G12D;Trp53fl/fl;OG mice, denoted iKPC-OG. We induced sporadic recombination in iKPC-OG mice by tamoxifen administration at 5-weeks of age, which led to mosaic activation in a field of normal acini (Figure S2G). Thus, oncogenic mutations were activated in parallel with neoantigen expression but only in a subset of pancreas cells. Nevertheless, iKPC-OG mice ultimately developed higher grade tumors, had reduced overall survival and increased liver metastases compared to iKPC littermates (Figure 2I).
Previous work in analogous KP lung models showed that neoantigen recognition leads to productive immunity and restrains tumor progression (DuPage et al., 2011). To mirror these studies in our model system, we intra-tracheally administered Cre to KrasLSL-G12D;Trp53fl/fl;R26tm1(LSL-OG) (KPL-OG) or OG-negative littermate mice (KPL) to generate lung adenocarcinomas and assess the impact of antigenicity (Figure S2H). In agreement with previous studies, we observed increased numbers of CD8+ and CD4+ T cells, lower tumor burden and decreased disease grade in KPL-OG mice compared to control (Figures 2J, 2K, and S2I). These data suggest that OG expression in the lung and pancreas elicit different tumor progression outcomes.
One of the pathways by which tumors escape immune surveillance is through loss of expression of prominent neoantigens, also known as immune-editing (O’Donnell et al., 2019; Schumacher and Schreiber, 2015). To test the propensity for antigen loss as an evasion mechanism in our model, we analyzed end stage KPC-OG and KPL-OG tumors for persistence of neoantigen expression. KPL mice exhibited substantial loss of GFP expression as tumors advanced (Figure 2L). However, in all three models of pancreatic cancer we found no evidence of antigen loss either at the primary site or in liver metastases (Figures 2L and S2J). To further verify these contrasting results, we administered Ad-Cre intramuscularly to create KP-OG+ sarcomas (DuPage et al., 2012). Mirroring observations in the lung, we observed substantial loss of GFP in advanced sarcomas (Figure S2K). Taken together, these data indicate that immunogenic lung tumors and sarcomas elicit an early immune response that delays tumor progression, but antigenicity is lost or silenced with progression. In contrast, this was not observed during pancreatic disease progression.
Neoantigen expressing PDAC tumors are poorly responsive to checkpoint immunotherapy
Lack of high mutational and/or neoantigen burden has been proposed to explain the poor responsiveness to immunotherapy in PDAC patients. An alternative hypothesis is that the PDAC TME enforces this lack of responsiveness to immunotherapy, even when tumor antigens are present (Clark et al., 2009; Kieler et al., 2018; Salmon et al., 2019; Sharma et al., 2017). To determine if OVA expression leads to improved responsiveness in PDAC, we tested efficacy of checkpoint- and adoptive T cell-therapy. We treated established KPPC-OG tumors with anti-PD1 and anti-CTLA4 IgGs. Despite neoantigen expression, checkpoint therapy did not impact survival (Figure S2L). To model the impact of adoptive T cell-therapy, we treated KPPC-OG tumors with three rounds of OT-I adoptive transfer supplemented with IL-2 and observed a modest survival benefit associated with loss of neoantigen at endstage (Figures 2M–N). These data suggest that a key bottleneck for treatment efficacy in PDAC is priming sufficient antigen-specific T cells, and not checkpoint activation on existing T cells (Stromnes et al., 2015).
Pathogenic CD4+ T cell responses drive PDAC acceleration in response to neoantigen
Our data suggest that neoantigen expression leads to adaptive immune responses that surprisingly drive tumor progression. Previous studies have shown that CD4+ T cells or activated B cells can drive pathogenic inflammation and accelerate PDAC progression (Barilla et al., 2019; Gunderson et al., 2016; McAllister et al., 2014; Pylayeva-Gupta et al., 2016; Zhang et al., 2014). Thus, we evaluated if CD4+ T or B cells were critical for the early stage disease progression observed in OG+ mice. We found that while B cell depletion did not alter tumor progression, CD4+ T cell depletion led to a decrease in premalignant disease burden and PANIN grade, reduced collagen density and decreased α-SMA+ fibroblast accumulation (Figures 3A–C, and S3A–B). These data suggest CD4+ T cells accelerate pancreatic neoplasia in response to neoantigen expression. We next evaluated the polarization of CD4+ T cell responses in OG+ mice, and observed higher numbers of pancreas-infiltrating ROR-γt+ and GATA3+ CD4+ TH cells, and more TH cells producing IL-17A, TNF-α, IL-4, and IL-10, consistent with dominant TH17 and TH2 responses (Figures 3D–E, and S3C–E). By contrast, we did not see increased frequency of Tbet+ or IFN-γ-producing TH cells in KPC-OG (Figure S3F). Surprisingly, FOXP3+ TREGS did not increase their frequency among CD4+ T cells, nor impact disease progression when partially depleted in KPC-OG tumors (Figures S3G–H). To determine the function of this enhanced TH17 signature observed in early lesions, we depleted cytokines necessary for their activity. Upon neutralizing proinflammatory IL-17 signaling, we observed lower disease burden and pathological fibrosis (Figures 3F–H). Correspondingly, we found the increased expression of pERK, pSTAT3 and pEGFR signaling observed in KPC-OG lesions was attenuated upon CD4+ T cell depletion or IL-17 neutralization (Figures 3I). We next compared CD4+ T cell polarization in early stage pancreatic and lung lesions and found higher frequency of GATA3+ and ROR-γt+ TH cells in KPC-OG pancreas compared to KPL-OG lung tumors. By contrast, KPL-OG lung-infiltrating TH cells were more TH1-skewed with increased frequency of Tbet+ and IFN-γ-producing cells (Figures S3I–J). Overall, these data indicate that, in contrast to lung, pancreas neoantigen expression results in enhanced pathogenic TH17 responses that can facilitate progression (Alam et al., 2015; McAllister et al., 2014; Zhang et al., 2016; Zhang et al., 2018).
Figure 3. Pro-inflammatory CD4+ T cell responses drive PDAC acceleration in response to neoantigen.

(A) Representative H&E images with quantification of pancreatic lesion area (TOP) and grade (BOTTOM) in early stage KPC-OG mice subjected to depletion of CD4+ T cells or CD19+B220+ B cells. n=8–12 mice/group.
(B) Sirius Red staining with quantification in early stage KPC-OG mice subjected to indicated depletions. n=8–12 mice/group.
(C) αSMA staining with quantification in early stage KPC-OG mice subjected to indicated depletions. n=8–12 mice/group.
(D) Representative flow cytometry plots of RORγt and GATA3 bias in TH cells of KPC-OG and KPC tumors, with cellular density of RORγt+ TH17 and GATA3+ TH2 cells quantified. n=3–6 mice/group.
(E) Representative flow cytometry plots of IL-17A and TNF-α expression in TH cells of KPC-OG and KPC tumors, with cellular density quantified. n=3–6 mice/group.
(F) Representative H&E image with quantification of pancreatic lesion area of early stage KPC-OG mice subjected to IL-17A and IL-17F neutralization. n=8–10 mice/group.
(G) Representative Sirius Red staining of KPC-OG mice subjected to IL-17A, IL-17F neutralization, with quantification. n=8–10 mice/group.
(H) Representative αSMA staining of KPC-OG mice subjected to IL-17A, IL-17F neutralization, with quantification. n=8–10 mice/group.
(I) Representative p-ERK1/2, p-STAT3, p-EGFR immunohistochemistry staining in KPC-OG mice subjected to indicated depletions, with quantification over overall tissue area and lesion area. n=8–10 mice/group.
Data were consistent across two independent experiments and pooled. Scale bar denotes 500 μm. n.s., not significant; *p < 0.05, **p < 0.01. Data is presented as mean ± SEM. For comparisons between two groups, Student’s two-tailed t-test used. See also Figure S3.
cDCs are fewer and less functional in PDAC compared to lung cancer
We sought to determine the cellular origins for differences in response to neoantigenicity in the lung and pancreas. We performed immune profiling of major innate immune cell subsets in both early- and late-stage lung and pancreas tumor tissues and found that conventional dendritic cells (cDCs) were among the most divergent (Figures 4A, and S4A–B). In early premalignant stages, we observed CD103+ CD24hi cDC1s were 10-fold fewer and CD172a+ CD11b+ cDC2s were 4-fold fewer in the pancreas when compared to lung. The disparity in cDC1s was magnified at later stages, with cDC1s in PDAC being 79-fold less than in counterpart lung adenocarcinomas (Figure 4B). These observations were not impacted by OG expression. We also observed fewer migratory CD103+ cDC1s and CD11b+ cDC2s in pancreas-dLNs of KPC-OG mice when compared to lung-dLNs of KPL-OG mice, but no major difference in resident DC populations (Figures 4C and S4C). To determine possible differences in cDC localization between the pancreas and lung TME, we transplanted irradiated KPC and KPL mice with Zbtb46GFP and Snx22GFP bone marrow (BM). The Zbtb46GFP reporter model marks all cDCs (Satpathy et al., 2012), while the Snx22GFP model labels Batf3-dependent cDC1s (Brähler et al., 2018) (Figure S4D). Using IHC to quantify GFP+ cells, we observed similar patterns to our flow cytometric results with markedly more Zbtb46-GFP+ cDCs and Snx22-GFP+ cDC1s in lung when compared to pancreas, both in premalignant tissues and late stage cancer (Figure 4D). We next analyzed cDC localization and found that both Zbtb46-GFP+ cDCs and Snx22-GFP+ cDC1s localized close to lung tumor cells (>60% were within 5 μm or less), while in PDAC cDCs were more distant from tumor nests (Figure 4E). Analysis of lung and pancreatic tumoral cDCs found that cDC1s and cDC2s had lower co-stimulatory and maturation markers in PDAC (Figure S4E), and pancreatic cDC1s were less functional at antigen presentation in ex vivo assays (Figure S4F). The higher cDC1 density found in lung cancer also paralleled higher OVA-specific CD8+ T cell density, suggesting a critical role in antigen-specific T cell immunity (Figure 4F). This was further supported by the observation that depleting cDC1s prior to KPL-OG lung tumor initiation via Batf3−/− bone marrow transplant results in drastically reduced CD8+ T cell infiltration (Figure S4G).
Figure 4. cDCs are fewer and less functional in PDAC compared to lung cancer.

(A) Heat map depicting mean density (log-scale) of major myeloid cell infiltrates in advanced KPC/OG pancreatic and KPL/OG lung tumors. n=5–10 mice/group.
(B) CD103+ cDC1 and CD11b+ cDC2 density in pancreas and lung tumors, at (LEFT) early stage and (RIGHT) late stage. n=5–10 mice/group.
(C) Migratory cDC1 and cDC2 density in respective draining lymph nodes of late stage KPC-OG pancreatic tumors and KPL-OG lung tumors. n=7 mice/group.
(D) Immunohistochemistry for tumor cytokeratin (CK7/19) expression, and Zbtb46-GFP+ (pink) cDCs in late stage KPC or KPL bone marrow chimeras. RIGHT: Zbtb46-GFP+ cDC density in non-tumor (WT) tissue and late stage tumors. FAR RIGHT: Snx22-GFP+ cDC1 density in WT and late stage tumors. n=4–6 mice/group.
(E) Frequency distribution of Zbtb46-GFP + cDC and Snx22-GFP+ cDC1 proximity to nearest CK7/19+ tumor cell. n=3–5 mice/group.
(F) Tumoral cDC1 density (log-scale) plotted against OVA-specific CD8+ T cell density (log-scale) across tissue and stage. RIGHT: OVA-specific CD8+ T cell density in early and late stage tumors. n=5–8 mice/group.
(G) Phenograph of CD45+ immune infiltrates from human PDAC patient CyTOF samples (pooled), with quantification of individual cellular fractions (log-scale). n=11.
(H) Z-normalized cDC1 infiltration score between pancreatic (PAAD, n=177) and lung (LUAD, n=230) adenocarcinoma based on conserved cDC1 gene signature.
(I) Representative histogram indicating ZsGreen in migratory cDC1s and cDC2s from respective draining lymph nodes of KPC-Z or KPL-Z tumors at denoted time points. RIGHT: percentage of migratory cDC subsets that have ZsGreen antigen in respective lymph nodes at denoted time points. n=3–4 mice/group.
(J) Density of OVA-specific CD8+ T cells in draining lymph nodes of early stage tumors. n=5–8 mice/group.
Data were consistent across two independent experiments, except in (A), (B), and (F)–(H) where they were pooled across multiple experiments. Scale bar denotes 100 μm. n.s., not significant; *p < 0.05, **p < 0.01. Data is presented as mean ± SEM, except in (H) where box plot denotes 10th to 90th percentile, middle line indicates median, range lines indicate maximal values, and data points beyond indicate outliers (>1.5X range). For comparisons between any two groups, Student’s two-tailed t-test used. Frequency distributions were compared using non-parametric Kolmogorov-Smirnov test. See also Figure S4.
To determine if these observations in mouse models held true in human pancreatic tumors, we analyzed cDC density in human PDAC tissue by mass cytometry and publicly available datasets. Using mass cytometry, we found that cDC1s specifically are extremely rare and ~100-fold less abundant when compared to tumoral macrophages (TAMs) or neutrophils in human PDAC tissues (Figure 4G). Additionally, normalized cDC1 gene signature levels (Barry et al., 2018; Böttcher et al., 2018; Spranger et al., 2017) are much lower in PDAC when compared to lung adenocarcinoma (Figure 4H). These observations mirror our mouse models and indicate that cDCs, specifically cDC1s, are particularly rare in human PDAC tissue.
A major anti-tumor function of cDCs involves antigen sampling and migration to tumor-dLN to prime T cell responses. To assess this priming function, we bred LSL-ZsGreen (ZsG) mice into KPC or KPL mice. ZsGreen expressed by transformed tissue is lysosome stable (Roberts et al., 2016) and enables us to track antigen uptake and trafficking by different antigen presenting cells (APCs) in the TME and tumor-dLN. We observed ZsGreen throughout transformed pancreatic and lung lesions; and TAMs, cDC1s, and cDC2s robustly took up ZsGreen from malignant cells in both tissues (Figure S4H). However, there were stark differences in the frequency of ZsGreen+ migratory cDC1s and cDC2s in tumor draining lymph nodes. Across multiple time points, significantly more migratory cDCs were ZsGreen+ in KPL-ZsG mice when compared to stage-matched KPC-ZsG mice (Figure 4I). Most striking was the fact that in early stage KPC-ZsG mice, nearly no migratory cDCs trafficked tumor-derived ZsGreen, despite clear antigen expression in lesions and loading on intrapancreatic cDCs at this stage. To determine if poor “antigen-trafficking” by migratory cDCs at early stages of pancreatic tumorigenesis influenced antigen-specific T cell priming, we analyzed OVA-specific CD8+ T cells in the tumor dLNs of OG+ mice. We found that KPC-OG pancreas-dLN had far fewer OVA-specific CD8+ T cells compared to stage-matched KPL-OG dLN (Figure 4J). Collectively, these data suggest that T cell priming by cDCs against neoantigens in developing PDAC is less functional compared to lung adenocarcinomas.
Mobilizing cDCs into early pancreatic lesions can reverse fibro-inflammatory responses
We next tested if increasing cDCs in early stages of PDAC could reassert TH1 and CTL-mediated disease control. To accomplish this, we stimulated hematopoietic mobilization of cDC precursors using Fms-related tyrosine kinase 3 ligand (Flt3L) treatment (Hammerich et al., 2019; Meyer et al., 2018; Salmon et al., 2016). Flt3L administration at early stages of tumorigenesis resulted in robust infiltration of cDCs in the pancreas, including a 10-fold increase in cDC1s (Figure 5A). These data suggest that when mobilized cDC precursors can successfully infiltrate early pancreatic lesions. Additionally, we observed that Flt3L treatment alone could revert disease acceleration and fibro-inflammatory pathology of KPC-OG mice. Compared to untreated mice, Flt3L-treated KPC-OG mice had a reduced lesion area, lower grade PANIN lesions, as well as reduced collagen deposition and α-SMA+ fibroblast density (Figures 5B–D, and S5A). Flt3L treatment also resulted in reduced number of ROR-γt+ IL-17A-expressing TH cells, GATA3+ TNF-α-expressing TH cells and increases in IFN-γ-producing TH1 cells (Figures 5E–F, and S5B–E). Notably, there was a sharp reduction in TNF-α-expressing TH17 cells (Figure 5F). While the absolute number of CTLs did not increase, Flt3L treatment increased CD8+ T cell, proximity to lesions, effector function as measured by IFN-γ+ and TNF-α+ production, and proliferation (Figures 5G–I, and S5F). To determine if these changes were functional, we depleted CD8+ T cells or IFN-γ and found it abolished the tumor control by Flt3L treatment (Figures 5J). Concurrently, we found CD8+ T cell depletion attenuated increases in the tumor cell-death and antigen-editing observed in Flt3L-treated KPC-OG mice (Figures S5G–H). Together these data imply that restoring cDC numbers in early stages of PDAC results in a switch from pathogenic tumor-promoting TH17 to tumor-restraining TH1 and CD8+ CTL responses to neoantigens.
Figure 5. Mobilizing cDCs into early pancreatic lesions can reverse fibro-inflammatory responses.

(A) Schematic of Flt3L administration in KPC-OG mice (starting at P30), with quantification of cDC1 and cDC2 density in pancreata of KPC-OG mice either treated or not with Flt3L and control KPC mice. n=5–6 mice/group.
(B) Representative H&E images of early stage KPC-OG mice either treated or not with Flt3L, with quantification of lesion area. n=8–12 mice/group; mice from figure 2 included in this and following analyses.
(C) Sirius Red staining with quantification in KPC-OG mice either treated or not with Flt3L. n=8–12 mice/group.
(D) αSMA staining with quantification in KPC-OG mice either treated or not with Flt3L. n=8–12 mice/group.
(E) Density of RORγt + TH17 and GATA3+ TH2 cells in early stage KPC-OG mice treated as indicated. n=3–6 mice/group.
(F) Representative flow cytometry plots of IL-17A and TNF-α expression in TH cells of KPC-OG mice either treated or not with Flt3L, with IL-17A+ and TNF-α+ IL-17A+ TH cellular density quantified. n=3–6 mice/group.
(G) Representative immunohistochemistry of CD8+ T cells (brown) and CK19+ tumor lesions (pink) in early stage KPC-OG mice either treated or not with Flt3L, n=6 mice/group.
(H) Cumulative CD8+ T cell density within 30 μm of CK19+ lesions, and distribution of CD8+ T cell proximity to nearest tumor cell in KPC-OG mice treated as indicated. n=6 mice/group.
(I) Density of IFN-γ+ TNF-α+ cytotoxic CD8+ T cells in KPC-OG mice treated as indicated. n=6 mice/group.
(J) Representative H&E images of early stage KPC-OG mice treated with Flt3L and anti-CD8 or anti-IFN-γ depletion antibodies, with quantification of lesion area. n=7–12 mice/group.
Data were consistent across two independent experiments, except in (B)–(D) and (H)–(J) where they were pooled across multiple experiments. Scale bar denotes 500 μm in (B), (C), (D), and (J); denotes 100 μm in (G). n.s., not significant; *p < 0.05, **p < 0.01. Data is presented as mean ± SEM. For comparisons between any two groups, Student’s two-tailed t-test used. Frequency distributions were compared using non-parametric Kolmogorov-Smirnov test. See also Figure S5.
Enhancing cDC infiltration and activation in established PDAC leads to disease stabilization
Our observations raised the possibility that Flt3L-based cDC mobilization in established pancreatic tumors could benefit anti-tumor immunity. Additionally, our previous work has shown that established PDAC in human patients and KPC mouse models can impair cDC1 development in the bone marrow (Meyer et al., 2018) and therapeutic strategies might require boosting cDC mobilization to overcome this disruption. Thus, we treated KPPC-OG mice bearing established tumors with Flt3L. Notably, increases in cDC infiltration upon Flt3L treatment were more modest in established PDAC compared to premalignant pancreas (Figure 6A–B). Also, administering Flt3L alone in this advanced setting did not change intratumoral CTL or TH cells and led to an increase in TREG frequency (Figure 6C). This finding is in line with previous work (Ager et al., 2017; Salmon et al., 2016), and suggested that increasing mobilization of cDC progenitors is insufficient in generating favorable T cell responses in established PDAC.
Figure 6. Enhancing cDC infiltration and activation in established PDAC leads to disease stabilization.

(A) Schematic of Flt3L administration in ultrasound-diagnosed KPPC-OG mice. n=5–8 mice/group.
(B) Density of (LEFT) CD103+ cDC1s, CD11b+ cDC2s in tumors, and (RIGHT) migratory cDC1, cDC2 populations in respective dLNs of KPPC-OG mice treated with Flt3L. n=5–8 mice/group.
(C) Density of CD8+ T cells, CD4+ TH cells and frequency of CD4+ TREG in tumors of KPPC-OG mice treated with Flt3L. n=5–8 mice/group.
(D) Density of cDC1s and cDC2s in tumors of KPPC-OG mice treated as described. n=7–8 mice/group.
(E) Density of CD8+ T cells and CD4+ TH cells and frequency of CD4+ TREGS in tumors of KPPC-OG mice treated as described. n=7–8 mice/group.
(F) Density of OVA-specific CD8+ T cells in tumors of treated KPPC-OG mice. n=5–8 mice/group.
(G) Representative immunohistochemistry of CD8+ T cells (brown) and CK19+ tumor lesions (pink) in KPPC-OG mice treated as indicated. RIGHT: cumulative CD8+ T cell density within 50 μm of CK19+ lesions. n=5–8 mice/group.
(H) Density of tumor-infiltrating NK cells, NKT cells and γδ-T cells in treated KPPC-OG mice. n=5–8 mice/group.
(I) Representative flow histogram indicating ZsGreen in migratory cDC1s from draining nodes of KPPC-Z treated as indicated. RIGHT: absolute number of migratory cDC subsets that have ZsGreen. n=3–4 mice/group.
(J) Density of OVA-specific CD8+ T cell in draining lymph nodes of treated KPPC-OG mice. n=5–8 mice/group.
(K) Tumor growth quantified by ultrasound measurements over 2 weeks of treatment. RIGHT: Individual traces of untreated and anti-CD40 plus Flt3L combination cohorts. n=5–8 mice/group.
(L) Representative Masson’s trichrome staining with quantification in KPPC-OG mice treated as denoted. n=5–8 mice/group.
(M) Representative α-SMA staining with quantification in KPPC-OG mice treated as denoted. n=5–8 mice/group.
Data were pooled across multiple independent experiments for all treatments. Scale bar denotes 100 μm in ; bar denotes 500 μm in (L) and (M). n.s., not significant; *p < 0.05, **p < 0.01. Data is presented as mean ± SEM. For comparisons between any two groups, Student’s two-tailed t-test used. See also Figure S6.
We speculated that the lack of impact of Flt3L on CTL and TH cell infiltration could be due to ineffective licensing of incoming cDCs, allowing for the immature DCs to become tolerogenic in the TME. To overcome this barrier, we either intratumorally injected a STING agonist (RR-S2-CDA) to influence IFN-dependent DC maturation (Corrales et al., 2015; Sivick et al., 2018), or administered CD40-agonist IgGs to improve licensing and enhance APC function and survival (Beatty et al., 2011; Byrne and Vonderheide, 2016). Unlike other tumor models (Kinkead et al., 2018; Ma et al., 2019), we found that neither CD40 nor STING agonist alone enhanced cDC abundance in the PDAC TME. However, combination of either agent with Flt3L worked synergistically to drive massive influx of cDC1s and cDC2s, with CD40 agonist showing clear superiority and a >64-fold increase in cDC1s (Figure 6D). Phenotypically, cDC1s and cDC2s had higher MHCI and MHCII expression and modestly higher CD80/CD86 expression upon CD40 agonist and Flt3L treatment (Figure S6A). Notably, combination treatment with CD40 agonist and Flt3L did not mobilize more pre-cDCs than Flt3L treatment alone, suggesting that the observed synergism was in the PDAC TME (Figures S6B–C).
While CD40 or STING agonist alone modestly enhanced CD8+ T cell infiltration, combination with Flt3L triggered markedly enhanced intratumoral CD8+ CTL and CD4+ TH cell infiltration without TREG induction (Figure 6E). Additionally, CD40 agonist plus Flt3L combination treatment increased the abundance of intratumoral OVA-specific CD8+ T cells (Figure 6F). Histologically, we found more CD8+ CTLs were in close proximity and frequently in contact with PDAC cells of CD40 agonist plus Flt3L combination-treated mice (Figure 6G). Notably, the CD40 agonist plus Flt3L treatment elicited integrated anti-tumor responses involving marked increases in infiltrating NK cells, γδT cells and y5T cells (Figures 6H and S6D) and resulted in significant loss of GFP in OG tumors, suggesting immune evasion under T cell pressure (Figure S6E). Due to the substantial changes observed in cDC numbers upon anti-CD40 plus Flt3L combination treatment, we next tested priming capacity in PDAC-dLNs using KPPC-ZsG mice. We found a considerable increase in ZsGreen+ migratory cDC1s trafficking tumor antigen to dLN of CD40 agonist plus Flt3L-treated mice (Figure 6I). To determine if this enhanced antigen trafficking results in better peripheral cross-priming, we analyzed the enrichment of antigen-specific CD8+ T cells in the dLN of treated KPPC-OG tumors. There was a 6.7-fold increase in OVA-specific CD8+ T cells in dLN of the anti-CD40 plus Flt3L treatment cohort, compared to a 3.5-fold increase in the anti-CD40 only cohort (Figure 6J). This suggested that combination treatment was efficacious in improving T cell priming in PDAC-dLNs.
Combining Flt3L administration with either CD40 or STING agonism resulted in improved disease control beginning a week into either treatment (Figure 6K). Combining CD40 agonism and Flt3L was also effective at slowing tumor progression in the non-antigenic KPPC model (Figures S6F–G) and was dependent on T cells for efficacy (Figures S6H–I). Histologically, tumors receiving Flt3L and anti-CD40 had no major changes in total PDPN+ fibroblast presence, but substantially lower collagen deposition and a reduction in desmoplastic α-SMA+ fibroblasts (Figures 6L–M, and S6J). This data suggested that Flt3L plus anti-CD40 treatment might either result in collagen degradation and/or indirectly switch fibroblast phenotype. In agreement with potential myeloid-dependent matrix remodeling, we observed higher MMP9 production in Flt3L plus anti-CD40 treated tumors (Figure S6K)(Long et al., 2016).
cDC-directed therapy renders PDAC responsive to radiation therapy
While we found that CD40 agonist plus Flt3L reshaped the immune response, we did not observe tumor regression. A possible explanation is that immune priming and “antigen-spill” by tumor cell death is very limited in this model (Vonderheide, 2018). One effective modality to induce immunogenic cell death and boost CTL priming by APCs is radiation therapy (RT) (Ngwa et al., 2018; Twyman-Saint Victor et al., 2015). RT in PDAC patients has limited benefit and is mostly palliative (Balaban et al., 2016), possibly because the TME does not support induction of tumor immunity. To test if cDCs could provide the necessary induction and synergize with RT, we combined anti-CD40 agonist and Flt3L treatment with radiotherapy. We utilized computed tomography-guided RT to provide 3 fractionated 8 Gy doses directed to KPPC-OG pancreata after cDCs were mobilized. While RT alone only modestly impacted tumor progression, the triple-therapy resulted in tumor regression in the majority of KPPC-OG animals (Figures 7A–C). Similar results were observed in orthotopic Kras-Ink tumors that do not express OVA/GFP (Figures 7D–F, and S7A), suggesting these responses were not specific to the GEMM or expression of exogenous antigen. Notably, triple-therapy extended survival over RT alone (Figure 7G). A different strategy in the KPPC GEMM involving RT at the induction step also improved treatment efficacy and survival benefit (Figures 7H–J). In conclusion, amplifying cDC density and function might be a desirable strategy to augment the impact of RT and similar treatments in PDAC.
Figure 7. cDC-directed therapy renders PDAC responsive to radiation therapy.

(A) Dosage schema for administration of radiation (RT) in KPPC-OG mice treated with Flt3L and anti-CD40 upon ultrasound-based tumor diagnosis at day 0.
(B) KPPC-OG tumor growth kinetics quantified by ultrasound measurements over 2 weeks of treatment. n=8 mice/group.
(C) Percentage change in KPPC-OG tumor volume after RT (day 7 to day 14) with representative ultrasound images. n=8 mice/group.
(D) Dosage schema for radiation (RT) in orthotopic Kras-Ink model treated with Flt3L and anti-CD40 upon tumor diagnosis.
(E) Kras-Ink tumor growth kinetics quantified by ultrasound measurements over 2 weeks of treatment. n=8 mice/group.
(F) Percentage change in Kras-Ink tumor volume after RT (day 6 to day 13). n=8 mice/group.
(G) Kaplan-Meier survival curve for Kras-Ink orthotopic tumor-bearing mice undergoing RT-alone or RT in conjunction with Flt3L and anti-CD40. n=9–14 mice/group.
(H) Dosage schema for administration of radiation (RT) in KPPC mice treated with Flt3L and anti-CD40 upon ultrasound-based tumor diagnosis at day 0.
(I) KPPC tumor growth kinetics quantified by ultrasound measurements over 5 weeks since starting treatment. n=8 mice/group.
(J) Kaplan-Meier survival curve for KPPC mice undergoing RT alone or RT in conjunction with Flt3L and anti-CD40. n=10–16 mice/group.
Data were pooled across multiple experiments for (A)–(C), (H)–(J), and representative of two independent experiments for (D)–(G). Scale bar denotes 5 mm. n.s., not significant; *p < 0.05, **p < 0.01. Data is presented as mean ± SEM. For comparisons between any two groups, Student’s two-tailed t-test used. See also Figure S7.
Discussion
In lieu of human tissue analyses, spontaneous mouse models are invaluable for defining how immune surveillance gradually becomes ineffective as tumors progress. In our unperturbed model of PDAC, strong antigenicity is insufficient to drive T cell-dependent tumor control and does not elicit immune-editing. This is in contrast to recent work in transplant models (Evans et al., 2016), underscoring how outcomes can differ depending on initial inflammatory context of the model system. Notably, while the genetic approach in our study avoids the wounding associated with orthotopic models, one limitation may be that a large portion of acinar cells receive both oncogenic mutations and neoantigen; this should be taken into consideration. None-the-less, it is plausible that the pancreas responds differently to neoplastic cues when compared to mucosal/barrier organs such as the lung (Salmon et al., 2019). Frequent environmental insults and mitogens can entrain a rapid response to lesions in the airway epithelia (Lelkes et al., 2014), and the lung-draining lymphatics are amenable for efficient T cell priming (Cook and Bottomly, 2007). In contrast, the pancreas and its lymphatic drainage might not be designed to be at this heightened state; tempering T cell immunity against antigenic lesions and allowing fibro-inflammatory programs to dominate. Additionally, local microbial communities can influence immune responses to lung or skin tumor antigens in a different context when compared to the hepatobiliary/pancreatic tract, wherein the gut-proximal commensal population is divergent (Jin et al., 2019; Pushalkar et al., 2018; Routy et al., 2018). Overall, our comparative studies suggest anti-tumor surveillance in PDAC is heavily influenced by a ‘hard-wired’ program.
TH17 cells and their associated cytokines have been separately implicated in tumor-promoting inflammation, fibrosis, neovascularization and recruitment of inflammatory myeloid cells (Grivennikov et al., 2012; McAllister et al., 2014; Ochi et al., 2012). Our observations suggest an interplay between these TME compartments via immune-cell derived TNF-α and IL-17A, which can drive mitogenic signaling in PDAC and other tumors through alternative p38MAPK activation (Alam et al., 2015) and NFκ-B signaling (Charles et al., 2009; De Simone et al., 2015; Egberts et al., 2008). Despite their plasticity, TH2 and TH17 infiltrates have been linked to worse outcomes in PDAC patients (Bellone et al., 1999; De Monte et al., 2011; De Monte et al., 2016; Fukunaga et al., 2004; Wang et al., 2017). Work from other groups have shown TREGS also play an important role in sustaining pancreatic tumorigenesis (Zhang et al., 2014), although we did not observe this to be prominent in our study.
Human PDAC patients have low numbers of DCs that become rarer with tumor progression (Dallal et al., 2002; Hiraoka et al., 2011). Such an absence or dysfunction of DCs can magnify unproductive TH cell responses (Furuhashi et al., 2012; Ibrahim et al., 2012; Ochi et al., 2012). In agreement, cDC mobilization at PANIN stages reduced pathogenic TH17 activity in the pancreas and limited progression, supporting a protective TH1 role at this early stage (Bedrosian et al., 2011; Henning et al., 2013). The influx of cDCs in our study was associated with concomitant reduction in collagen-deposition which might further benefit antigen sampling and improved trafficking to dLNs (Hugues, 2010). Importantly, these observations insinuate the PDAC TME retains its capacity for TH1 and CTL activity, and is held back by insufficient cDCs.
cDC2s are a heterogeneous population that can have tumor-suppressive roles based on the inflammatory context (Binnewies et al., 2019; Brown et al., 2019; Laoui et al., 2016). CD11b+ TAMs/DCs that skew immunity towards TH2 responses have been described both in the PDAC TME (Ochi et al., 2012) and metastases (Kenkel et al., 2017). Tumor-permissive roles for CD11b+ DCs via FOXP3+ TREGs or FOXP3neg regulatory TR1 cells have also been reported (Barilla et al., 2019; Jang et al., 2017). While we limited our scope to canonical cDC1 and cDC2 subsets, recent work has demonstrated greater heterogeneity and plasticity (Brown et al., 2019; Zilionis et al., 2019). It will become important to map differential cDC distribution/localization and study the resultant impact on PDAC pathogenesis as well as treatment response.
Prior trials involving Flt3L monotherapy have not shown benefit due to a lack of appropriate DC activation and licensing (Freedman et al., 2003; Morse et al., 2000). The paradigm has now shifted to include strategies for enhancing DC function in the TME, and trials are now underway in lymphoma, squamous carcinoma and non-small cell lung cancer (NCT03789097, NCT02839265). The described therapeutic strategy targeting anti-CD40 and Flt3L is also being tested for solid malignancies (NCT03329950). This combination caused a dramatic increase in tumoral cDCs and CD8+ T cells, despite mobilization from bone marrow being similar to Flt3L-monotherapy. This could be due to enhanced DC survival in situ, as signaling downstream of RANK and non-canonical NF-κB signaling upon CD40 ligation is known to enhance DC survival (Hou and Van Parijs, 2004; Miga et al., 2001; Ouaaz et al., 2002). Flt3L and CD40 agonism have been shown to independently enhance IFN-γ and IL-12 production (Borges et al., 1999; Chaudhry et al., 2006; Garris et al., 2018), and their combined activity could impose TH1 immunity in the otherwise-suppressive TME. Even though CD40 agonism has been shown to rely on Batf3-dependent DCs in PDAC (Byrne and Vonderheide, 2016) it is also known to be mediated by TAMs (Hoves et al., 2018; Stromnes et al., 2019). Multiple myeloid cell types could be mediating CD40-dependent immunity in the PDAC TME; this redundancy could be of benefit to patients with extremely low numbers of cDCs.
The described cDC-targeted strategy may have the added benefit of altering the TME for fully-integrated immune killing. The increase in intratumoral NK and NKT cells via Flt3L can have a profound effect on sustaining DC-T cell interaction and TH1 help (Barry et al., 2018; Böttcher et al., 2018; Nair and Dhodapkar, 2017). Additionally, stromal remodeling and resolution of fibrosis can facilitate drug delivery and enhance CTL activity in the TME (Feig et al., 2013; Jiang et al., 2016; Stromnes et al., 2015). Notably, CD40 agonism has been shown to reduce pathogenic fibrosis by enhancing matrix remodeling properties of tumor-infiltrative monocytes (Long et al., 2016). In addition to facilitating CTL activity and access, stromal remodeling has a positive effect on cDC migration, antigen sampling, and activity (Boissonnas et al., 2013; Hope et al., 2017); this can be advantageous for sustaining DCs in similarly ‘insulated’ solid tumors.
Going forward, it becomes important to experimentally determine the best treatment-window to administer inductive RT– to maximize priming capacity of mobilized cDCs and maintain their T cell-assistive function in the TME. It might also be germane to combine this treatment with DC agonistic pathways such as OX40 or 4-1BB to further benefit T cell co-stimulation. Meaningful interventions in PDAC will likely necessitate such combinations (Baird et al., 2016; Hammerich et al., 2019; Rech et al., 2018). In conclusion, increasing the numbers and/or activity of scarce cDCs in PDAC is a distinct strategy that could improve cytotoxic or immune-based therapies that by themselves are poorly effective in this disease.
STAR Methods Text
LEAD CONTACT AND MATERIAL AVAILABILITY
Further information and requests for resources, reagents and samples should be directed to and will be fulfilled by the Lead Contact, David G. DeNardo (ddenardo@wustl.edu). The OG mouse model generated in this study is being deposited to the Jackson laboratory, and requests in the interim will be fulfilled by Lead Contact.
EXPERIMENTAL MODEL AND SUBJECT DETAILS
Genetic mice and other models
The OG mouse (R26tm1(LSL-OG)) was developed at the Washington University Mouse Embryonic Stem Cell Core modifying a previously published construct (Miyazaki et al., 2005). Briefly, this includes a Tet-off regulation cassette for expression of full-length chicken Ovalbumin and IRES-enhanced GFP under Cre-mediated LSL-control and hCMV1 promoter. Successful chimeras from C57Bl/6J blastocyst injections were selected for and verified by DNA sequencing across ROSA junction; bred to C57Bl/6J background and subsequent founder mice were identified via genomic PCR (primers listed in Key Resources Table).
KEY RESOURCES TABLE
| REAGENT or RESOURCE | SOURCE | IDENTIFIER |
|---|---|---|
| Antibodies | ||
| anti-mouse CD45 (30-F11) | eBioscience | RRID: AB_469625 |
| anti-mouse CD3e (145-2C11) | eBioscience | RRID: AB_469315 |
| anti-mouse CD19 (eBio1D3) | eBioscience | RRID: AB_1659676 |
| anti-mouse CD11b (M1/70) | eBioscience | RRID: AB_657585 |
| anti-mouse MHCII (I-A/I-E) (M5/114.15.2) | eBioscience | RRID: AB_1272204 |
| anti-mouse Ly6G (1A8) | BioLegend | RRID: AB_1186104 |
| anti-mouse Ly6C (HK1.4) | eBioscience | RRID: AB_1518762 |
| anti-mouse F4/80 (BM8) | eBioscience | RRID: AB_468798 |
| anti-mouse CD45 (30-F11) | BD Biosciences | RRID: AB_2716861 |
| anti-mouse CD3e (145-2C11) | eBioscience | RRID: AB_1107000 |
| anti-mouse CD3e (145-2C11) | BD Biosciences | RRID: AB_2687954 |
| anti-mouse CD11c (N418) | eBioscience | RRID: AB_1548652 |
| anti-mouse CD24 (30-F1) | eBioscience | RRID: AB_464985 |
| anti-mouse CD24 (M1/69) | eBioscience | RRID: AB_464988 |
| anti-mouse CD103 (2E7) | BioLegend | RRID: AB_2562713 |
| anti-mouse XCR1 (ZET) | BioLegend | RRID: AB_2565230 |
| anti-mouse CD8a (53-6.7) | BD Biosciences | RRID: AB_2732919 |
| anti-mouse CD8a (53-6.7) | BD Biosciences | RRID: AB_11152075 |
| anti-mouse CD4 (RM4-4) | eBioscience | RRID: AB_464900 |
| anti-mouse CD62L (MEL-14) | BioLegend | RRID: AB_11125577 |
| anti-mouse CD44 (IM7) | eBioscience | RRID: AB_1272246 |
| anti-mouse PD1 (J43) | eBioscience | RRID: AB_466295 |
| anti-mouse TIGIT (1G9) | BD Biosciences | RRID: AB_2742062 |
| anti-mouse TIM3 (RMT3-23) | Biolegend | RRID: AB_2571932 |
| anti-mouse CD40L (MR1) | Biolegend | RRID: AB_2563493 |
| anti-mouse ICOS (15F9) | BioLegend | RRID: AB_313337 |
| anti-mouse CD22 (OX-97) | BioLegend | RRID: AB_2244414 |
| anti-mouse γδ TCR (eBioGL3) | eBioscience | RRID: AB_465934 |
| anti-mouse CD49b (DX5) | eBioscience | RRID: AB_469485 |
| anti-mouse NK1.1 (PK136) | BD Biosciences | RRID: AB_2728688 |
| anti-mouse Ki-67 (SolA15) | eBioscience | RRID: AB_2574235 |
| anti-mouse FOXP3 (FJK-16s) | eBioscience | RRID: AB_11218094 |
| anti-mouse CD16/32 (93) | eBioscience | RRID: AB_467133 |
| anti-mouse F4/80 (BM8) | BioLegend | RRID: AB_2564589 |
| anti-mouse MHCI (Kd/Dd) (34-1-2S) | eBioscience | RRID: AB_465358 |
| anti-mouse B220 (RA3-6B2) | BioLegend | RRID: AB_312997 |
| anti-mouse CD80 (16-10A1) | eBioscience | RRID: AB_468774 |
| anti-mouse CD86 (GL1) | eBioscience | RRID: AB_469419 |
| anti-mouse CD107a (1D4B) | BD Biosciences | RRID: AB_2739285 |
| anti-mouse SIINFEKL Dextramer (N/A) | Immudex | Cat# JD2163 |
| anti-mouse IL-4 (11B11) | BioLegend | RRID: AB_315320 |
| anti-mouse IL-10 (JES5-16E3) | BioLegend | RRID: AB_2563240 |
| anti-mouse IFN-γ (XMG1.2) | BioLegend | RRID: AB_315402 |
| anti-mouse TNFa (MP6-XT22) | eBioscience | RRID: AB_10670212 |
| anti-mouse IL-17A (eBio17B7) | eBioscience | RRID: AB_10732356 |
| anti-mouse Tbet (eBio4B10) | eBioscience | RRID: AB_11042699 |
| anti-mouse ROR-gamma T (Q31-378) | BD Biosciences | RRID: AB_2651150 |
| anti-mouse EOMES (Dan11mag) | Ebioscience | RRID: AB_2573454 |
| anti-mouse Granzyme B (GB11) | BD Biosciences | RRID: AB_2738174 |
| anti-mouse MHCII (I-A/I-E) (M5/114.15.2) | Biolegend | RRID: AB_313322 |
| anti-mouse CD86 (B7-2) (GL1) | eBioscience | RRID: AB_469419 |
| anti-mouse CD252 (OX40L) (RM134L) | Biolegend | RRID: AB_313404 |
| anti-mouse CD274 (PD-L1) (MIH5) | eBioscience | RRID: AB_466089 |
| anti-mouse CD137L (4-1BBL) (TKS-1) | Biolegend | RRID: AB_2256408 |
| anti-mouse IgGa, K (MOPC-173) | Biolegend | RRID: AB_326480 |
| anti-mouse IgG1, K (eBRG1) | Ebioscience | RRID: AB_470009 |
| anti-mouse IgG1, K (RTK2071) | Ebioscience | RRID: AB_326518 |
| anti-mouse IgG1, K (RTK2071) | Ebioscience | RRID: AB_326514 |
| anti-mouse CD40 (FGK4.5) | BioXCell | RRID: AB_1107647 |
| anti-mouse CD4 (GK1.5) | BioXCell | RRID: AB_1107636 |
| anti-mouse CD8a (2.43) | BioXCell | RRID: AB_1125541 |
| anti-mouse CD19 (1D3) | BioXCell | RRID: AB_10949187 |
| anti-mouse B220 (TIB-146) | BioXCell | RRID: AB_1107651 |
| anti-mouse IL-17A (17F3) | BioXCell | RRID: AB_10950102 |
| anti-mouse IL-17F (MM17F8F5.1A9) | BioXCell | RRID: AB_2715461 |
| anti-mouse IFN-γ (XMG1.2) | BioXCell | RRID: AB_1107694 |
| anti-mouse CD25 (IL-2Ra; PC-61.5.3) | BioXCell | RRID: AB_1107619 |
| anti-mouse IgG2a (2A3) | BioXCell | RRID: AB_1107769 |
| anti-mouse IgG1 (MOPC-21) | BioXCell | RRID: AB_1107784 |
| anti-mouse IgG2b (LTF-2) | BioXCell | RRID: AB_1107780 |
| anti-mouse PD1 (RMP1-14) | BioXCell | RRID: AB_10949053 |
| anti-mouse CTLA4 (UC10-4F10-11) | BioXCell | RRID: AB_1107598 |
| anti-mouse F4/80 biotinylated (BM8) | Ebioscience | RRID: AB_466657 |
| anti-mouse GR-1 biotinylated (RB6-8C5) | Abcam | RRID: AB_470753 |
| anti-mouse CD8a biotinylated (53-6.7) | Ebioscience | RRID: AB_466346 |
| anti-mouse CD4 biotinylated (GK1.5) | Ebioscience | RRID: AB_466325 |
| anti-mouse FOXP3 (FJK-16s) | Ebioscience | RRID: AB_467576 |
| anti-mouse B220 (RA3-6B2) | BD Biosciences | RRID: AB_396673 |
| anti-mouse Pan-cytokeratin (Poly) | Cell Signaling | RRID: AB_836890 |
| anti-mouse alpha-SMA (Poly) | Abcam | RRID: AB_2223021 |
| anti-mouse Podoplanin (8.1.1) | Biolegend | RRID: AB_1089187 |
| anti-mouse ki67 (Poly) | Abcam | RRID: AB_443209 |
| anti-mouse Sox2 (Poly) | Cell Signaling | RRID: AB_823640 |
| anti-mouse Cytokeratin 19 (TROMA-III) | DSHB | RRID: AB_2133570 |
| anti-mouse Cytokeratin 17/19 (D4G2) | Cell Signaling | RRID: AB_2797912 |
| anti-mouse GFP (D5.1) | Cell Signaling | RRID: AB_1196615 |
| anti-mouse TTF1 (Nkx2.1) (EP1584Y) | Abcam | RRID: AB_1310784 |
| anti-mouse p-ERK1/2 T202/204 (D13.14.4E) | Cell Signaling | RRID: AB_2315112 |
| anti-mouse p-STAT3 Y705 (D3A7) | Cell Signaling | RRID: AB_2491009 |
| anti-mouse p-EGFR Y1068 (EP774Y) | Abcam | RRID: AB_732110 |
| anti-mouse MMP9 (Poly) | Abcam | RRID: AB_776512 |
| anti-mouse Ovalbumin (Poly) | Thermo Fisher | RRID: AB_2539921 |
| anti-mouse beta-actin (13E5) | Cell Signaling | RRID: AB_2223172 |
| anti-human CD11b (ICRF44) | Fluidigm | #3209003B |
| anti-human CD11c (Bu15) | Fluidigm | #3159001B |
| anti-human CD14 (M5E2) | Fluidigm | #3160001B |
| anti-human CD141 (1A4) | Fluidigm | #3173002B |
| anti-human CD15 (W6D3) | Fluidigm | #3164001B |
| anti-human CD16 (3G8) | Fluidigm | #3148004B |
| anti-human CD163 (GHI/61) | Fluidigm | #3154007B |
| anti-human CD19 (HIB19) | Fluidigm | #3142001B |
| anti-human CD192 (CCR2) (K036C2) | Fluidigm | #3153023B |
| anti-human CD1c (L161) | BioLegend | #331502 |
| anti-human CD20 (2H7) | Fluidigm | #3147001B |
| anti-human CD206 (MMR) (15-2) | Fluidigm | #3168008B |
| anti-human CD24 (ML5) | Fluidigm | #3166007B |
| anti-human CD3 (UCHT1) | BioLegend | #300402 |
| anti-human CD32 (FUN-2) | Fluidigm | #3169020B |
| anti-human CD34 (581) | Fluidigm | #3149013B |
| anti-human CD38 (HIT2) | Fluidigm | #3167001B |
| anti-human CD40 (5C3) | Fluidigm | #3165005B |
| anti-human CD45 (HI30) | Fluidigm | #3089003B |
| anti-human CD54 (HA58) | Fluidigm | #3170014B |
| anti-human CD56 (NCAM16.2) | Fluidigm | #3176008B |
| anti-human CD64 (10.1) | Fluidigm | #3146006B |
| anti-human CD68 (Y1/82A) | Fluidigm | #3171011B |
| anti-human CD80 (2D10.4) | Fluidigm | #3162010B |
| anti-human CD81 (5A6) | Fluidigm | #3145007B |
| anti-human CD82 (ASL-24) | Fluidigm | #3158025B |
| anti-human CD86 (IT2.2) | Fluidigm | #3150020B |
| anti-human CX3CR1 (2A9-1) | Fluidigm | #3172017B |
| anti-human CXCR4 (12G5) | Fluidigm | #3175001B |
| anti-human HLA-DR (L243) | Fluidigm | #3174001B |
| anti-human Ki-67 (B56) | Fluidigm | #3161007B |
| Bacterial and Virus Strains | ||
| Ad5CMVCre | U of Iowa | #VVC-UofIowa-5 |
| Biological Samples | ||
| Human PDAC Samples | Washington University | IRB #201704078 |
| Cultrex Basement membrane extract, Pathclear | Trevigen | #3432-001-01 |
| Chemicals, Peptides, and Recombinant Proteins | ||
| Doxycycline hyclate | Sigma-Aldrich | #D9891 |
| SIINFEKL peptide (OVA 257-264) | Sigma-Aldrich | #S7951 |
| ISQ peptide (OVA 323-339) | Invivogen | #vac-isq |
| Endo-free Ovalbumin | Invivogen | #vac-pova-100 |
| PolyI:C (HMW) | Invivogen | #tlrl-pic-5 |
| Flt3L (CDX-301) | Celldex | N/A |
| STING agonist (ML-RR-S2 CDA; ADU-S100) | MedChemExpress | #HY-12885B |
| Recombinant mouse IL-2 | Peprotech | #212-12-20UG |
| Fluo4-AM calcium indicator | Thermo Fisher | #F14201 |
| Collagenase A | Sigma/Roche | #10103586001 |
| DNAse I | Sigma | #11284932001 |
| Cell Stimulation cocktail (PMA/Iono) | Ebioscience | #00-4970-93 |
| Brefeldin A | Biolegend | #420601 |
| Monensin | Biolegend | #420701 |
| Critical Commercial Assays | ||
| Total IgG (mouse) ELISA kit | Thermo Fisher | #88-50400-22 |
| Anti-Ovalbumin IgG1 (mouse) ELISA kit | Cayman chemicals | #500830 |
| CyQUANT LDH cytotoxicity assay kit | Thermo Fisher | #C20300 |
| E.Z.N.A. Total RNA kit I | Omega | #R6834-02 |
| qScript cDNA Supermix kit | Quantabio | #95048-500 |
| Taqman Gene Expression Master Mix | Thermo Fisher | #4370074 |
| TSA Fluorescein kit | Perkin-Elmer | #NEL701001KT |
| TSA Biotin kit | Perkin-Elmer | #NEL700001KT |
| BOND Polymer Refine Detection kit | Leica | #DS9800 |
| BOND Polymer Refine Red Detection kit | Leica | #DS9390 |
| BOND Intense R Detection kit | Leica | #DS9263 |
| Cytofix kit | BD Bioscience | #554655 |
| Transcription Factor Staining kit | Ebioscience | #00-5523-00 |
| MACS LS kit | Miltenyi | #130-042-401 |
| Deposited Data | ||
| RNASeq raw reads and processed data | this paper | GEO: GSE131602 |
| Experimental Models: Cell Lines | ||
| KP-OG1; derived from 20 wk-old KPC-OG mouse | This paper | N/A |
| KP-OG2; derived from 16-wk old KPC-OG mouse | This paper | N/A |
| KPP-OG2; derived from 10-wk old KPPC-OG mouse | This paper | N/A |
| KPC01-03; derived from ~22 wk-old KPC mouse | This paper; Jiang et al. 2016 | N/A |
| KI; derived from Kras-Ink mouse | Doug Hanahan, EPFL | N/A |
| Experimental Models: Organisms/Strains | ||
| mouse: B6.Cg-ROSA26tm1(LSL-OG) i.e. R26tm1(LSL-OG) | This paper | N/A |
| mouse: p48-Cre;KrasLSL-G12D;Trp53fl/fl | Hingorani et al., 2003; Morton et al., 2010 | N/A |
| mouse: C57BL/6-Tg(Pdx1-Cre/Esr1*) | The Jackson Laboratory | Stock#024968 |
| mouse: B6.Cg-Gt(ROSA)26Sortm6(CAG-ZsGreen1)Hze | The Jackson Laboratory | Stock#007906 |
| mouse: C57BL/6J | The Jackson Laboratory | Stock#000664 |
| mouse: C57BL/6-Tg(TcraTcrb)1100Mjb/J | The Jackson Laboratory | Stock#003831 |
| mouse: C57BL/6-Tg(TcraTcrb)425Cbn/J | The Jackson Laboratory | Stock#004194 |
| mouse: B6.129S6(C)-Zbtb46tm1.1Kmm/J | The Jackson Laboratory | Stock#027618 |
| mouse: B6.129S6(C)-Snx22tm1.1Kmm/J | Kenneth M. Murphy, Wash U | N/A |
| mouse: C57BL/6NCr | Charles River Laboratories | Strain#556 |
| mouse: FVB/NCr | Charles River Laboratories | Strain#559 |
| Oligonucleotides | ||
| Primer: ROSA-WT-F1 5’ GTT ATC AGT AAG GGA GCT GCA GTG GAG TAG 3’ |
This paper; Miyazaki et al., 2005 | N/A |
| Primer: ROSA-WT-R1 5’ CCG AAA ATC TGT GGG AAG TCT TGT CCC TCC 3’ |
This paper; Miyazaki et al., 2005 | N/A |
| Primer: ROSA-NEO-R2 5’ CGG AGA ACC TGC GTG CAA TCC ATC TTG TTC 3’ |
This paper; Miyazaki et al., 2005 | N/A |
| Software and Algorithms | ||
| Flowjo v10.5 | Flowjo, L.L.C. | RRID: SCR_008520 |
| Prism v8.0.1 | Graphpad | RRID: SCR_002798 |
| Rstudio v1.1.456 | Rstudio, Inc | https://www.rstudio.com/ |
| REVIGO | revigo.irb.hr | RRID: SCR_005825 |
| Fiji v2.0.0 | ImageJ | RRID: SCR_002285 |
| HALO v2.2 | Indica Labs | http://www.indicalab.com/halo/ |
| cBioportal v2.2.0 | MSK Center for Mol Onc | https://www.cbioportal.org/ |
| ssGSEA v2.0 | Broad Institute | http://software.broadinstitute.org/gsea/index.jsp |
| GENE-E & Morpheus | Broad Institute | https://software.broadinstitute.org/morpheus/ |
| FACSDiva | BD Biosciences | RRID: SCR_001456 |
| Cytobank Premium | Cytobank, Inc | RRID: SCR_014043 |
KPC (p48-Cre;KrasLSL-G12D;Trp53fl/+) or KPPC mice (p48-Cre;KrasLSL-G12D;Trp53fl/fl) used in these studies have been rapidly bred to C57Bl/6J background in our lab using speed-congenics and further backcrossed >5-times. Independent founder OG lines were crossed into our in-house KPC background and backcrossed >3-times while deriving KPC-OG mice (p48-Cre;KrasLSL-G12D;Trp53fl/+;R26tm1(LSL-OG)), KPPC-OG mice (p48-Cre;KrasLSL-G12D;Trp53fl/fl;R26tm1(LSL-OG)), or PC-OG mice (p48-Cre;Trp53fl/fl;R26tm1(LSL-OG)). Certain KP-OG mice (KrasLSL-G12D;Trp53fl/fl;R26tm1(LSL-OG)) were administered Ad5CMVCre at 6 weeks of age by intratracheal instillation to generate analogous lung tumors (DuPage et al., 2011). In Figure 1 and S1, KPC or KPC-OG cages were kept ad libitum on doxycycline (0.5 mg/ml in water, changed every 3 days) and weaned off it at birth.
LSL-ZsG mice (B6.Cg-Gt(ROSA)26Sortm6(CAG-ZsGreen1)Hze) were crossed into our in-house KPC background and backcrossed >3-times while deriving KPC-ZsG mice (p48-Cre;KrasLSL-G12D;Trp53fl/+;R26tm1(LSL-ZsG)). KP-ZsG mice (KrasLSL-G12D;Trp53fl/+;R26tm1(LSL-ZsG)) were administered Ad5CMVCre at 6 weeks of age by intratracheal instillation to generate analogous lung tumors. For some studies; tamoxifen-inducible Pdx1-Cre/Esr1* mice (Gu et al., 2002) were bred with KP-OG mice to generate iKPC-OG mice (Pdx1-Cre/Esr1*;KrasLSL-G12D;Trp53fl/fl;R26tm1(LSL-OG)). iKPC-OG and iKPC mice at 5 weeks were administered tamoxifen for 5 days (2 mg i.p. daily, dissolved in corn oil). Survival events were scored when mice lost >15% body weight, tumor burden reached >1.8 cm in diameter, moribund appearance, severe cachexia, or per absolute survival. For all studies, care was taken to include negative littermates as well as sex- and age-match in the same experimental setup.
KPPC/KPPC-OG mice were enrolled for treatment studies when first >0.5 cm tumor was detected by biweekly palpation corroborated by ultrasound measurement. Thereafter, tumor size was assessed weekly by ultrasound (SonoSite m-Turbo). Survival events were scored when mice lost >15% body weight, tumor burden reached >1.8 cm in diameter or per absolute survival outcome.
OT-I TCR-Tg mice, OT-II TCR-Tg mice, C57Bl/6 and FVB/N mice were obtained from Jackson or Charles River laboratories. Snx22GFP and Zbtb46GFP were provided kindly by Dr. Kenneth Murphy (Washington University). Snx22GFP and Zbtb46GFP mice were backcrossed >3 times to C57Bl/6 background before being used. All mice were housed, bred and maintained under specific pathogen-free conditions in accordance with NIH-AALAC standards and consistent with Washington University School of Medicine IACUC regulations (protocol #20160265).
Human subjects
Human PDAC samples were obtained from informed consenting patients diagnosed at Washington University and Siteman Cancer Center. Patients underwent pancreaticoduodenectomy and had not received neoadjuvant therapy. Washington University Ethics committee approved the study under IRB protocol #201704078.
Cell lines
Three independent primary cell lines were derived from tumor-bearing female KPC-OG or KPPC-OG mice (denoted KP-OG1 and KP-OG2 and KPP-OG2), along with three KPC-derived control lines. We observed similar in vivo and ex vivo results for all OG-expressing cell lines; data from one cell line (KP-OG1) is reported unless noted. Kras-Ink or KI cells used in certain orthotopic transplant experiments were derived from Pdx1-Cre;LSL-KrasG12D;Ink/Arffl/fl mice in Dr. Hanahan’s laboratory (EPFL, Lausanne).
Cell suspension derived after tumor harvest (detailed below) was plated on collagen-coated tissue culture flasks under standard antibiotics. GFP+ tumor cells were sorted on FACSAria-II (BD Biosciences), and replated in complete medium until stable cell lines were established. All cell lines were cultured in complete medium (DMEM-F12 with 10% FBS and 1% PenStrep) at 37° C and 5% CO2. All cell lines were passaged <6 times and were tested positive for cytokeratin-19, and negative for smooth muscle actin and vimentin to verify their carcinoma identity and purity. All cell lines were tested negative for MAP and mycoplasma using 2 independent commercial kits (Sigma and Lonza).
METHOD DETAILS
Tissue harvest
Mice were euthanized by trans-cardiac perfusion (insert LV apex, cut RA) using 15 mL of PBS-heparin under isoflurane anesthesia. For lung studies, mice were euthanized by lung-specific perfusion (insert RV apex, cut LA) using 10 mL of PBS-heparin under isoflurane anesthesia. When taken for histology, tumor tissue were equally divided between 10% neutral-buffered formalin and OCT-based cryopreservation. When taken for cellular assays, tumor tissue or respective lymph nodes were manually minced and digested in 20 mL of sterile 1X HBSS (Thermo Fisher) containing 2 mg/mL of collagenase A (Roche) and 1X DNase I (Sigma) for 30 min at 37° C with constant stirring. Digestion was quenched in 5 mL of sterile fetal bovine serum (FBS, Atlanta Biologicals) filtered through 40 μm Nylon mesh, pelleted through centrifugation (2000 RPM for 5 min at 4°C), and resuspended in required media/buffer as single cell suspensions.
Orthotopic implantations
To establish orthotopic models, either 100,000 KI or 200,000 KP-OG cells in 50 μL of Cultrex (Trevigen) were injected into the pancreas of 8-12-week old sex-matched FVB/NJ or C57Bl/6-background PC-OG mice as previously described (Kim et al., 2009). For 5 days prior to implantation of KP-OG cells, recipient mice were kept on 0.5 mg/ml doxycycline (in water, changed every 3 days) and cells were kept on 1.5 μg/ml doxycycline (in medium, changed every 3 days). Certain groups were weaned off doxycycline 3 days post-tumor implant.
Perinatal and immunotherapeutic neutralizing antibodies
For cellular depletion perinatally, neutralizing IgG antibodies were administered to post-partum dam in KPC-OG breeding cages via i.p. injection to pass onto pups via milk. The first injection was given to the female on the day of litter. For T cell depletion perinatally, CD4- or CD8-neutralizing IgG antibodies (anti-mCD4 clone GK1.5; anti-mCD8 clone 2.43, BioXCell) were administered, with 1st injection containing 400 μg and subsequent injections (every 4 days) containing 200 μg of each IgG. Once pups were 3 weeks old; individual weaned pups received 200 μg every 4 days, until 6-week timepoint was reached. Isotype controls with same dosage were administered similarly (rat IgG2b clone LTF-2, BioXCell) and are included in certain data panels. For B cell depletion perinatally, CD19- and B220-neutralizing IgG antibodies (rat clone 1D3; clone TIB-146, BioXCell) were administered, with 1st injection containing 900 μg and subsequent injections (every 4 days) containing 450 μg of each IgG. Once pups were 3 weeks old; individual weaned pups received 300 μg every 4 days, until 6-week timepoint was reached. Depletion of targeted cell type was verified both in pancreas and blood by flow cytometry, utilizing staining antibodies of a different clone (CD4 clone RM4-4; CD8 clone 53-6.7; CD19 clone DK5). For cytokine depletion regimen, 400 μg each of IL-17A and IL-17F neutralizing antibodies (rat clone 17F3; clone MM17F8F5.1A9, BioXCell) or 250 μg of IFN-γ neutralizing antibodies (rat clone XMG1.2, BioXCell) were similarly administered (every 3-4 days) until 6-week timepoint was reached. For immunotherapy regimen, 250 μg of agonist antibodies (anti-mCTLA4 clone UC10-4F10-11; anti-mPD1 clone RMP1-14; BioXCell) were given by intraperitoneal (i.p.) injection; anti-PD1 was given every 3 days and anti-CTLA4 was given every 4 days from beginning of treatment. Treatments were discontinued after 3 weeks to prevent anti-rat IgG reaction.
Adoptive T cell transfer
Three days prior to adoptive transfer, spleen and inguinal lymph node from OT-I Tg mouse were crushed and cell suspensions were cultured in T-cell medium (45% RPMI-1640, 45% DMEM, 10% FBS, 1% Penicillin-Streptomycin, 1X 2-mercaptoethanol) with 0.5 μg/mL SIINFEKL and 10 ng/mL IL-2. After 2 days of culture, cell suspension was supplemented with fresh medium, SIINFEKL and IL-2. On day of transfer, CD8+ T cells were enriched from cell suspension using MACS LS column and Ly-2 microbeads (Miltenyi) and suspended in ice-cold sterile 1X PBS. Enrichment was verified (every 5th experiment) to be >90%. 5 million activated T cells were transferred into mice by retro-orbital venous injection (i.v.) on days noted. T cell transfer was supplemented with five rIL-2 injections (20,000 IU per mouse, i.p.) every other day for 10 days.
DC-modulatory therapy and radiation therapy
Mice received 30 μg of Flt3L (CDX-301, Celldex) i.p. every day for 9 days as previously published (Salmon et al., 2016). Mice received 100 μg of anti-CD40 (clone FGK4.5, BioXCell) i.p. every 5 days starting concurrent with other treatment upon palpation and 1st ultrasound measure. Certain mice received 25 μg of STING agonist (ML-RR-S2 CDA, MedChemExpress) intratumorally every 4 days starting concurrent with other treatment upon palpation and 1st ultrasound measure.
Mice received Radiation (RT) as three daily fractionated doses (8 Gy x 3) using the Small Animal Radiation Research Platform (SARRP200, XStrahl Life Sciences). Mice were injected i.p. with an iodine contrast agent (2100 mg/kg) before being placed on the irradiation platform one at a time under isoflurane anesthesia. Conebeam computed tomography (CT) imaging was performed for each individual mouse to pinpoint the pancreas, images were imported into Muriplan and used to select an isocenter. The tumor was then irradiated using anterior-posterior-opposed beams using the 10mm x 10mm collimator at a dose rate of 3.9 Gy/min. Mice were monitored over 2 weeks for signs of radiation sickness or weight-loss. DietGel recovery gel was provided for 14 day window immediately following radiation therapy in survival studies.
Cytotoxicity and degranulation assays
KPC-derived cells were cultured in 96-well format with purified, activated OT-I CD8+ T cells (derived and expanded as described above) in triplicates at different ratios. Positive-control wells contained OT-I cells incubated with CD3/CD28 dynabeads (Ebioscience). Cytotoxicity was measured using CyQUANT LDH release assay (Thermo Fisher) run according to kit instructions on the Synergy H1 microplate reader (Biotek). Viability of tumor cells was also measured using PrestoBlue HS fluorescent reagent (Thermo Fisher) according to manufacturer’s instructions. OG cell killing was verified by measuring GFP fluorescence levels normalized to cellular density on the Synergy H1 microplate reader. To measure CD107a degranulation, parallel wells containing tumor and T cells were co-incubated with 1 μM Monensin (Biolegend) for 5 hours at 37° C and 5% CO2. CD107a antibody was utilized in the incubation step, prior to flow cytometric labeling.
Bone marrow chimerism
Recipient mice received two (split) doses of 450 cGy four hours apart, followed by transplant of bone marrow by retro-orbital injection (i.v). Irradiation was carried out using an X-ray irradiator (XRAD 320). Donor bone marrow was prepared as follows: donor mice were sacrificed by CO2 inhalation, both femurs were extracted in sterile setting and flushed using pulsed centrifugation to collect marrow. Bone marrow was reconstituted in cold sterile serum-free 1X HBSS and injected i.v. at a concentration of 5 million cells per 100 μL per mouse. Mice were monitored over 2 weeks for signs of radiation sickness or weight-loss.
Vaccination strategy
PC-OG mice received 40 μ9 of full-length Ovalbumin (Invivogen) and 25 μg of HMW PolyI:C adjuvant (Invivogen) in Cultrex subcutaneously on day 0, followed by analysis at day 10 and day 20. Vaccination was verified by measuring OVA-specific T cells in blood and draining lymph nodes using dextramer immunolabeling.
Immunohistochemical staining
Tissues were fixed in 10% neutral-formalin for 18 hours, embedded in paraffin after graded-ethanol dehydration, and sectioned into 6-μm sections using a microtome. Where applicable, FFPE sections were stained for Hematoxylin & Eosin (Thermo Fisher), Picro-Sirius Red (Sigma-Aldrich) and Masson’s Trichrome (Diagnostic Biosystems) according to manufacturer’s instructions. Automated staining of tissues was carried out on the Bond Rxm (Leica Biosystems) following dewaxing and appropriate epitope retrieval. Immunostaining was chromogenically visualized using the Bond Polymer Refine Detection alone or in conjunction with Bond Intense R Detection Systems (DS9263, Leica Biosystems). Staining used antibodies listed in Key Resources Table. Slides were mounted using Xylene-based Cytoseal (Thermo Fisher) or Vectamount (Vector Labs) as appropriate.
Immunofluorescence staining
6 μm-thick cryo-sections were air-dried and fixed in 4% PFA (Ted Pella, Inc.) for 20 min before being washed thrice with PBS. Slides were peroxidase-quenched by incubating in hydrogen peroxide (1% v/v in PBS, Invitrogen) for 10 min at RT. After blocking for 30 min at RT in blocking buffer (5% goat serum, 2.5% BSA in 1X PBS), slides were additionally blocked using an Avidin/Biotin Blocking Kit (Vector Labs) according to manufacturer’s recommendations. Slides were then incubated overnight in a humidified chamber at 4° C with antibodies listed in Key Resources Table. The next day, slides underwent three PBST (1X PBS with 0.05% Tween-20) washes, and incubation with anti-rat HRP (1:500) for 30 min at RT. After three more PBST washes, slides were incubated in biotinylated Tyramide reagent (1:50) for 8 min, followed by washes and AlexaFluor 594-conjugated goat streptavidin secondary antibodies (Invitrogen) for 30 min at RT. Slides were subsequently washed and mounted using Vectashield with DAPI (Vector Labs). Automated staining of FFPE tissues was carried out on the Bond Rxm (Leica Biosystems) following dewaxing and EDTA-based epitope retrieval (AR9640, Leica Biosystems). Fluorescence immunostaining for GFP and CK19 was visualized on an Open Research Kit arm using standard (non-TSA) immunostaining protocols.
Multiparametric flow cytometry
Following tissue digestion, single cell suspensions were resuspended in flow cytometry buffer (PBS containing 1% BSA and 5 mM EDTA), FcR blocked with rat anti-mouse CD16/CD32 antibodies (EBioscience) for 10 min and pelleted by centrifugation. When used, Live/Dead viability dyes were applied for 15–30 min at room temperature prior. Where applicable, CD8+ T cells specific for antigen OVA were labeled by incubating cell suspension with H2Kb::SIINFEKL-specific MHCI dextramer (1:5; Immudex protocol) for 10 min at room temperature prior to extracellular staining. Cells were consequently labeled with 100 μl of fluorophore-conjugated anti-mouse extracellular antibodies at recommended dilutions for 25 min on ice. Intracellular staining for transcription factors and intracellular markers was conducted subsequently using the EBioscience Transcription Factor Staining buffer set, according to manufacturer’s instructions. All antibodies are listed in Key Resources Table. FCS Data were acquired on BD LSR-II and BD Fortessa X-20 (BD Biosciences) within 3-4 days, and analyzed using FlowJo software (v10) with application of bead-based post-hoc compensation. For live analysis of GFP or ZsGreen uptake, fixation step was not performed, and labeled cells were analyzed immediately (within 2 hours) on cytometer(s).
For experiments that measured T cell cytokines involving ex vivo stimulation, primary cell suspensions were incubated in 96-well format with 1 μM Brefeldin A (Biolegend) and 1X Stimulation Cocktail (Ebioscience) for 4 hours at 37° C and 5%CO2. Post-incubation, cells were quenched and resuspended in Fc block buffer and then labeled with fluorophore-conjugated anti-mouse antibodies as above.
Mass cytometry
Human tumor samples were digested in HBSS supplemented with 2mg/ml collagenase A (Roche), 2.5U/ml hyaluronidase and DNase I at 37C for 30 min with agitation to generate single-cell suspensions. Cell suspensions were counted and stained in 5 μM cisplatin per million cells for exactly 3 min on ice and washed with Cy-FACS buffer (PBS, 0.1% BSA, 0.02% NaN3, 2 mM EDTA) twice. Cells were incubated with FcR blocking reagent plus surface-antibody cocktail for 40 min on ice. After incubation, surface-marker stained cells were washed twice with Cy-FACS buffer. Cells were then fixed with 4% PFA for 10 min on ice and permeabilized with permeabilization buffer (Invitrogen) for 40 min containing the intracellular stain cocktail. All antibodies are listed in Key Resources Table. Cells were then washed twice with PBS and stained with 200 μl of DNA intercalator per million cells. Cells were acquired on a CyTOF2 mass cytometer (Fluidigm) and data were uploaded to Cytobank for further analysis. Events were gated on singlets, live, and CD45+. A maximum of 100,000 events were then visualized using standard t-SNE algorithm. Populations of interest were manually gated and verified based on lineage marker-expression.
ELISA
Blood was collected by cardiac puncture at endpoints and serum isolated by coagulation and centrifugation. Serum aliquots were snap-frozen at −80° C until use. Total IgG1 was measured using IgG (Total) Mouse ELISA Kit (Thermo) and OVA-specific IgG1 was measured using Anti-Ovalbumin IgG1 (mouse) ELISA Kit (Cayman Chemical) on duplicate sera samples diluted 1:10,000 and 1:100 respectively. Absorbance values within dynamic range were read at 450 nm and 570 nm, and final concentrations were interpolated on Sigmoidal (4PL) fit of standard-curve.
Ex vivo cDC cross-presentation assay
Endstage pancreatic and lung GEMM tumors were harvested on the same day as detailed above. Following tissue digestion, single cell suspensions were resuspended in flow cytometry buffer at required cell concentration, FcR blocked with rat anti-mouse CD16/CD32 antibodies (EBioscience) for 10 min and pelleted by centrifugation. 20 million cells were consequently labeled with 1000 μl of fluorophore-conjugated anti-mouse extracellular antibodies for 25 min on ice. Subsequently, cells were incubated with 7-AAD for live/dead discrimination and run live on BD FACSAria-II (BD Biosciences) using a 100 μm nozzle and low flow rate.
After excluding T, B cells, granulocytic & monocytic cells, around 2000–5000 MHCIIhiCD11chiCD24hiXCR1+ cDC1s and MHCIIhiCD11chiCD11b+ cDC2s were sorted into complete media (containing Flt3L, L-Glutamine, beta-mercaptoethanol and NEAA) and plated in 384 well-plate format. cDC1 and cDC2 wells were incubated with 2 μg/ml SIINFEKL [OVA257-264] and ISQ [OVA323-339] peptide, respectively, for 3 hours at 37° C prior to 2 washes. Freshly isolated naïve splenocytes from OT-I and OT-II mice were enriched for CD8+ T cells and CD4+ T cells, respectively. OT-I and OT-II cells were labeled with nuclear violet LCS1 (Cayman Chemical) as well as Fluo4-AM calcium indicator (Thermo) according to kit instructions, and subsequently co-cultured with cDC1s and cDC2s at 5:1 ratio. Cellular movement and calcium flux were longitudinally monitored over 3 hours on Cytation 5 multi-mode reader (Biotek) and data normalized to T-cell alone wells. After 3 hours of imaging, CD8+ or CD4+ T cells from the above co-culture setup were lifted and separately assayed on mouse IFN-γ single-color ELISPOT strip according to manufacturer’s instructions. Readings were taken on Immunospot S6 Universal Analyzer (CTL) after 18 hours of incubation.
Western immunoblot
Tissue or cell lysates were harvested using radioimmunoprecipitation assay (RIPA) lysis buffer [25 mM Tris-HCl pH 7.5, 150 mM NaCl, 1% NP-40, 0.5% DOC, 0.1% SDS] supplemented with protease and phosphatase inhibitors (Roche). Cell lysates were resolved in Tris-glycine sodium dodecyl sulfate/polyacrylamide gel electrophoresis (SDS/PAGE) gels and transferred to polyvinylidene difluoride (PVDF) membranes (Invitrogen). After blocking in 1X TBST buffer with 5% w/v BSA, membranes were probed with primary antibodies against Ovalbumin (PA1-196), GFP (D5.1) and beta-actin (13E5) overnight at 4°C. Membranes were washed thrice i n 1X TBST and probed with HRP-conjugated secondary antibody for 1 hour at RT. Membranes were developed with Pierce ECL Western Blotting Substrates and detected using a ChemiDoc XRS+ system (Bio-Rad).
RNA isolation
Total RNA was extracted from cryo-preserved pancreatic tissues using an E.Z.N.A.® Total RNA kit (OMEGA) according to manufacturer’s instructions, and banked in −80° C until use. cDNA for downstream applications were synthesized using qScript cDNA SuperMix kit (QuantaBio) according to manufacturer’s instructions.
RNA sequencing and analysis
Samples were prepared in-lab according to kit manufacturer’s protocol, ribo-depleted using RiboZero protocol and subsequently indexed, pooled, and sequenced on HiSeq 3000 (Illumina) at the Genome Technology Access Center (GTAC), Washington University. Differential expression analysis of normalized counts (after standard basecalling and demultiplexing) was performed to analyze for differences between conditions and the results were filtered for only those genes with Benjamini-Hochberg FDR adjusted p values ≤ 0.05. For each contrast extracted with Limma, global perturbations in known Gene Ontology (GO) terms and KEGG pathways were detected using the R/Bioconductor package GAGE to test for changes in expression of the reported log2 fold-changes reported for each term versus the background log2 fold-changes of all genes found outside the respective term.
TCGA Patient Analysis
Gene expression data was downloaded for lung adenocarcinoma (TCGA, Nature 2014) and pancreatic adenocarcinoma (TCGA, PanCancer Atlas) from cBioportal. Comparison of DC1 gene signature (KIT, CCR7, BATF3, FLT3, ZBTB46, IRF8, BTLA, MYCL, CLEC9A, XCR1) between LUAD and PAAD was conducted using ssGSEA on the GenePattern web interface from the Broad Institute. Expression scores were Z-score normalized on GraphPad Prism v8.
QUANTIFICATION AND STATISTICAL ANALYSIS
Image analysis
Whole-tissue scans at 10X or 20X magnification were obtained on a Zeiss Axio Scan Z1 brightfield/fluorescence Slide Scanner. Additional 40X images were taken when necessary on the Nikon Eclipse 80i brightfield/epifluorescence microscope (Nikon). Whole-tissue scans were analyzed with HALO software (Indica Labs) using Area quantification V1.0, Cytonuclear v1.5, Cytonuclear FL v1.4 module or Immune Cell Proximity v1.2 module. Where noted, grading was conducted by a trained pathologist in a blinded fashion and verified by principal investigator post-hoc. For proximity analyses, distances less than or equal to zero were culled for clarity. The normalized percentage of target cells (T cells, cDCs) proximal to CK19-expressing tumor lesions was binned and quantified on GraphPad Prism v8.
Statistical analysis
All statistical analyses were performed using GraphPad Prism software v8, with input from a Biostatistics core expert at Washington University. All data are representative of at least two independent experiments, unless specifically noted. Sample size was pre-calculated to satisfy power-requirements (with >85% confidence) in most experiments, and is specified in the figure legends wherever applicable. To accomplish randomization for KI experiments in Figure 6 and 7, animals were sorted by a blinded investigator with tumor sizes in ascending order and then groups were assigned in descending order. Each group was checked post-hoc to verify no statistical difference in average starting tumor size. Randomization was not possible for genetic mouse studies except in Figure 6 and 7 where mice were randomized at ultrasound-guided enrollment stage. Data are shown as mean ± SEM, unless otherwise noted. Normal-distribution of data was assessed using the D’Agostino–Pearson omnibus normality test in Prism. Statistical tests such as unpaired parametric Student’s t-test, ANOVA analysis (Bonferroni multiple comparison) or unpaired non-parametric Mann–Whitney U test were used appropriately based on normality of data. For survival analyses, Log-Rank (Mantel-Cox) test was used. For proximity analyses; non-parametric Kolmogorov-Smirnov test was used to distinguish differences in frequency distributions. p < 0.05 was considered statistically significant for all studies. *p < 0.05; **p < 0.01; n.s. denotes not significant.
DATA AND SOFTWARE AVAILABILITY
Bulk-RNA sequencing data from KPC or KPC-OG pancreatic lesions can be found at the Gene Expression Omnibus Repository (GEO) accession number GSE131602. All software packages used are publicly available through commercial vendors.
Supplementary Material
Highlights.
Neoantigen expression elicits pathogenic T cell response accelerating PDAC
cDC dysfunction precludes early Th1 and CTL response to PDAC neoantigens
Increasing cDCs in early PDAC lesions restores anti-tumor T cell immunity
Restoring cDC function in advanced PDAC improves efficacy of radiation therapy
Significance.
T cell-directed immunotherapies have not been effective for the majority of pancreatic cancer patients, in part, due to our limited understanding of how T cell immunity is subverted in this disease. We sought to identify mechanisms for this failure using spontaneous mouse models. We report that endogenous antigen-specific responses in PDAC are aberrant due to a scarcity of dendritic cells, which favors the expansion of tumor-promoting TH17 immunity. Restoring cDCs in pancreatic cancer can enhance CD8+ T cell and TH1 activity to ultimately help control disease. These findings expand our understanding of T cell ineffectiveness in pancreatic cancer, and propose combinatorial strategies to modulate cDCs in conjunction with existing therapies for pancreatic cancer and similar solid malignancies.
Acknowledgements:
S.H. was supported by the NCI predoctoral-to-postdoctoral fellowship F99CA223043. J.K.S. was supported by NCI R01CA181745 and the Small Animal Radiation Research Platform was purchased with S10OD020136. D.G.D. was supported by NCI P50CA196510, R01CA177670, R01CA203890, P30CA09184215 and BJC Cancer Frontier Fund. C.J.D was supported by 1DP5OD026427. We thank Brian Ruffell for his feedback while drafting the manuscript. We thank the Genome Technology Access Center for help with genomic analyses, supported by NCI P30CA91842 and by ICTS/CTSA UL1RR024992 from the NCRR and the NIH. We also thank the Digestive Disease Research Core Center for histological help, supported by NIDDK P30DK052574. Imaging experiments were performed through the use of Washington University Center for Cellular Imaging supported by CDI-CORE-2015-505 and the Foundation for Barnes-Jewish Hospital.
Footnotes
Publisher's Disclaimer: This is a PDF file of an unedited manuscript that has been accepted for publication. As a service to our customers we are providing this early version of the manuscript. The manuscript will undergo copyediting, typesetting, and review of the resulting proof before it is published in its final form. Please note that during the production process errors may be discovered which could affect the content, and all legal disclaimers that apply to the journal pertain.
Declaration of interests:
The authors declare no competing interests for this manuscript.
References:
- Ager CR, Reilley MJ, Nicholas C, Bartkowiak T, Jaiswal AR, and Curran MA (2017). Intratumoral STING Activation with T-cell Checkpoint Modulation Generates Systemic Antitumor Immunity. Cancer Immunology Research 5, 676–684. [DOI] [PMC free article] [PubMed] [Google Scholar]
- Alam MS, Gaida MM, Bergmann F, Lasitschka F, Giese T, Giese NA, Hackert T, Hinz U, Hussain SP, Kozlov SV, and Ashwell JD (2015). Selective inhibition of the p38 alternative activation pathway in infiltrating T cells inhibits pancreatic cancer progression. Nature Medicine 21, 1337–1343. [DOI] [PMC free article] [PubMed] [Google Scholar]
- Bailey P, Chang DK, Forget MA, Lucas FAS, Alvarez HA, Haymaker C, Chattopadhyay C, Kim SH, Ekmekcioglu S, Grimm EA, et al. (2016a). Exploiting the neoantigen landscape for immunotherapy of pancreatic ductal adenocarcinoma. Scientific Reports 6, 35848. [DOI] [PMC free article] [PubMed] [Google Scholar]
- Bailey P, Chang DK, Nones K, Johns AL, Patch AM, Gingras MC, Miller DK, Christ AN, Bruxner TJ, Quinn MC, et al. (2016b). Genomic analyses identify molecular subtypes of pancreatic cancer. Nature 531, 47–52. [DOI] [PubMed] [Google Scholar]
- Baird JR, Friedman D, Cottam B, Dubensky TW, Kanne DB, Bambina S, Bahjat K, Crittenden MR, and Gough MJ (2016). Radiotherapy combined with novel STING-targeting oligonucleotides results in regression of established tumors. Cancer Research 76, 50–61. [DOI] [PMC free article] [PubMed] [Google Scholar]
- Balaban EP, Mangu PB, Khorana AA, Shah MA, Mukherjee S, Crane CH, Javle MM, Eads JR, Allen P, Ko AH, et al. (2016). Locally Advanced, Unresectable Pancreatic Cancer: American Society of Clinical Oncology Clinical Practice Guideline. J Clin Oncol 34, 2654–2668. [DOI] [PubMed] [Google Scholar]
- Balachandran VP, Luksza M, Zhao JN, Makarov V, Moral JA, Remark R, Herbst B, Askan G, Bhanot U, Senbabaoglu Y, et al. (2017). Identification of unique neoantigen qualities in long-term survivors of pancreatic cancer. Nature 551, S12–S16. [DOI] [PMC free article] [PubMed] [Google Scholar]
- Barilla RM, Diskin B, Caso RC, Lee KB, Mohan N, Buttar C, Adam S, Sekendiz Z, Wang J, Salas RD, et al. (2019). Specialized dendritic cells induce tumor-promoting IL-10+IL-17+ FoxP3neg regulatory CD4+ T cells in pancreatic carcinoma. Nature Communications 10, 1424. [DOI] [PMC free article] [PubMed] [Google Scholar]
- Barry KC, Hsu J, Broz ML, Cueto FJ, Binnewies M, Combes AJ, Nelson AE, Loo K, Kumar R, Rosenblum MD, et al. (2018). A natural killer–dendritic cell axis defines checkpoint therapy–responsive tumor microenvironments. Nature Medicine 24, 1178–1191. [DOI] [PMC free article] [PubMed] [Google Scholar]
- Beatty GL, Chiorean EG, Fishman MP, Saboury B, Teitelbaum UR, Sun W, Huhn RD, Song W, Li D, Sharp LL, et al. (2011). CD40 agonists alter tumor stroma and show efficacy against pancreatic carcinoma in mice and humans. In Science (New York, N.Y.), pp. 1612–1616. [DOI] [PMC free article] [PubMed] [Google Scholar]
- Beatty GL, Winograd R, Evans RA, Long KB, Luque SL, Lee JW, Clendenin C, Gladney WL, Knoblock DM, Guirnalda PD, and Vonderheide RH (2015). Exclusion of T Cells From Pancreatic Carcinomas in Mice Is Regulated by Ly6Clow F4/80+ Extratumoral Macrophages. Gastroenterology 149, 201–210. [DOI] [PMC free article] [PubMed] [Google Scholar]
- Bedrosian AS, Nguyen AH, Hackman M, Connolly MK, Malhotra A, Ibrahim J, Cieza-Rubio NE, Henning JR, Barilla R, Rehman A, et al. (2011). Dendritic cells promote pancreatic viability in mice with acute pancreatitis. Gastroenterology 141, 1915–1926.e1914. [DOI] [PMC free article] [PubMed] [Google Scholar]
- Bellone G, Carbone A, Smirne C, Scirelli T, Buffolino A, Novarino A, Stacchini A, Bertetto O, Palestro G, Sorio C, et al. (2014). Cooperative Induction of a Tolerogenic Dendritic Cell Phenotype by Cytokines Secreted by Pancreatic Carcinoma Cells. The Journal of Immunology 177, 3448–3460. [DOI] [PubMed] [Google Scholar]
- Bellone G, Turletti A, Artusio E, Mareschi K, Carbone A, Tibaudi D, Robecchi A, Emanuelli G, and Rodeck U (1999). Tumor-associated transforming growth factor-beta and interleukin-10 contribute to a systemic Th2 immune phenotype in pancreatic carcinoma patients. Am J Pathol 155, 537–547. [DOI] [PMC free article] [PubMed] [Google Scholar]
- Binnewies M, Mujal AM, Pollack JL, Combes AJ, Hardison EA, Barry KC, Tsui J, Ruhland MK, Kersten K, Abushawish MA, et al. (2019). Unleashing Type-2 Dendritic Cells to Drive Protective Antitumor CD4+ T Cell Immunity. Cell, 1–16. [DOI] [PMC free article] [PubMed] [Google Scholar]
- Boissonnas A, Licata F, Poupel L, Jacquelin S, Fetler L, Krumeich S, Théry C, Amigorena S, and Combadière C (2013). CD8+ tumor-infiltrating T cells are trapped in the tumor-dendritic cell network. Neoplasia 15, 85–94. [DOI] [PMC free article] [PubMed] [Google Scholar]
- Borges L, Miller RE, Jones JS, Ariail K, Whitmore J, Fanslow W, and Lynch DH (1999). Synergistic action of fms-like tyrosine kinase 3 ligand and CD40 ligand in the induction of dendritic cells and generation of antitumor immunity in vivo. Journal of immunology (Baltimore, Md : 1950) 163, 1289–1297. [PubMed] [Google Scholar]
- Böttcher JP, Bonavita E, Chakravarty P, Blees H, Cabeza-Cabrerizo M, Sammicheli S, Rogers NC, Sahai E, Zelenay S, and Reis e Sousa C (2018). NK Cells Stimulate Recruitment of cDC1 into the Tumor Microenvironment Promoting Cancer Immune Control. Cell 172, 1022–1037.e1014. [DOI] [PMC free article] [PubMed] [Google Scholar]
- Brähler S, Zinselmeyer BH, Raju S, Nitschke M, Suleiman H, Saunders BT, Johnson MW, Böhner AMC, Viehmann SF, Theisen DJ, et al. (2018). Opposing Roles of Dendritic Cell Subsets in Experimental GN. Journal of the American Society of Nephrology 29, 138–154. [DOI] [PMC free article] [PubMed] [Google Scholar]
- Brahmer JR, Tykodi SS, Chow LQ, Hwu WJ, Topalian SL, Hwu P, Drake CG, Camacho LH, Kauh J, Odunsi K, et al. (2012). Safety and activity of anti-PD-L1 antibody in patients with advanced cancer. N Engl J Med 366, 2455–2465. [DOI] [PMC free article] [PubMed] [Google Scholar]
- Brown CC, Gudjonson H, Pritykin Y, Deep D, Lavallee VP, Mendoza A, Fromme R, Mazutis L, Ariyan C, Leslie C, et al. (2019). Transcriptional Basis of Mouse and Human Dendritic Cell Heterogeneity. Cell 179, 846–863 e824. [DOI] [PMC free article] [PubMed] [Google Scholar]
- Byrne KT, and Vonderheide RH (2016). CD40 Stimulation Obviates Innate Sensors and Drives T Cell Immunity in Cancer. Cell Reports 15, 2719–2732. [DOI] [PMC free article] [PubMed] [Google Scholar]
- Charles KA, Kulbe H, Soper R, Escorcio-Correia M, Lawrence T, Schultheis A, Chakravarty P, Thompson RG, Kollias G, Smyth JF, et al. (2009). The tumor-promoting actions of TNF-α involve TNFR1 and IL-17 in ovarian cancer in mice and humans. Journal of Clinical Investigation 119, 3011–3023. [DOI] [PMC free article] [PubMed] [Google Scholar]
- Chaudhry UI, Katz SC, Kingham TP, Pillarisetty VG, Raab JR, Shah AB, and DeMatteo RP (2006). In vivo overexpression of Flt3 ligand expands and activates murine spleen natural killer dendritic cells. FASEB J 20, 982–984. [DOI] [PubMed] [Google Scholar]
- Clark CE, Beatty GL, and Vonderheide RH (2009). Immunosurveillance of pancreatic adenocarcinoma: Insights from genetically engineered mouse models of cancer. Cancer Letters 279, 1–7. [DOI] [PubMed] [Google Scholar]
- Cook DN, and Bottomly K (2007). Innate immune control of pulmonary dendritic cell trafficking. Proc Am Thorac Soc 4, 234–239. [DOI] [PMC free article] [PubMed] [Google Scholar]
- Corrales L, Glickman LH, McWhirter SM, Kanne DB, Sivick KE, Katibah GE, Woo SR, Lemmens E, Banda T, Leong JJ, et al. (2015). Direct Activation of STING in the Tumor Microenvironment Leads to Potent and Systemic Tumor Regression and Immunity. Cell Rep 11, 1018–1030. [DOI] [PMC free article] [PubMed] [Google Scholar]
- Cristescu R, Mogg R, Ayers M, Albright A, Murphy E, Yearley J, Sher X, Liu XQ, Lu H, Nebozhyn M, et al. (2018). Pan-tumor genomic biomarkers for PD-1 checkpoint blockade–based immunotherapy. Science 362, eaar3593. [DOI] [PMC free article] [PubMed] [Google Scholar]
- Dallal RM, Christakos P, Lee K, Egawa S, Son YI, and Lotze MT (2002). Paucity of dendritic cells in pancreatic cancer. Surgery 131, 135–138. [DOI] [PubMed] [Google Scholar]
- de Mingo Pulido Á, Gardner A, Hiebler S, Soliman H, Rugo HS, Krummel MF, Coussens LM, and Ruffell B (2018). TIM-3 Regulates CD103+ Dendritic Cell Function and Response to Chemotherapy in Breast Cancer. Cancer Cell 33, 60–74.e66. [DOI] [PMC free article] [PubMed] [Google Scholar]
- De Monte L, Reni M, Tassi E, Clavenna D, Papa I, Recalde H, Braga M, Di Carlo V, Doglioni C, and Protti MP (2011). Intratumor T helper type 2 cell infiltrate correlates with cancer-associated fibroblast thymic stromal lymphopoietin production and reduced survival in pancreatic cancer. The Journal of Experimental Medicine 208, 469–478. [DOI] [PMC free article] [PubMed] [Google Scholar]
- De Monte L, Woermann S, Brunetto E, Heltai S, Magliacane G, Reni M, Paganoni AM, Recalde H, Mondino A, Falconi M, et al. (2016). Basophil recruitment into tumor draining lymph nodes correlates with Th2 inflammation and reduced survival in pancreatic cancer patients. Cancer Research. [DOI] [PubMed] [Google Scholar]
- De Simone V, Franzè E, Ronchetti G, Colantoni A, Fantini MC, Di Fusco D, Sica GS, Sileri P, MacDonald TT, Pallone F, et al. (2015). Th17-type cytokines, IL-6 and TNF-α synergistically activate STAT3 and NF-kB to promote colorectal cancer cell growth. Oncogene 34, 3493–3503. [DOI] [PMC free article] [PubMed] [Google Scholar]
- DuPage M, Cheung AF, Mazumdar C, Winslow MM, Bronson R, Schmidt LM, Crowley D, Chen J, and Jacks T (2011). Endogenous T cell responses to antigens expressed in lung adenocarcinomas delay malignant tumor progression. Cancer cell 19, 72–85. [DOI] [PMC free article] [PubMed] [Google Scholar]
- DuPage M, Mazumdar C, Schmidt LM, Cheung AF, and Jacks T (2012). Expression of tumour-specific antigens underlies cancer immunoediting. Nature 482, 405–409. [DOI] [PMC free article] [PubMed] [Google Scholar]
- Egberts JH, Cloosters V, Noack A, Schniewind B, Thon L, Klose S, Kettler B, von Forstner C, Kneitz C, Tepel J, et al. (2008). Anti-tumor necrosis factor therapy inhibits pancreatic tumor growth and metastasis. Cancer Res 68, 1443–1450. [DOI] [PubMed] [Google Scholar]
- Evans RA, Diamond MS, Rech AJ, Chao T, Richardson MW, Lin JH, Bajor DL, Byrne KT, Stanger BZ, Riley JL, et al. (2016). Lack of immunoediting in murine pancreatic cancer reversed with neoantigen. JCI Insight 1, 1–16. [DOI] [PMC free article] [PubMed] [Google Scholar]
- Feig C, Jones JO, Kraman M, Wells RJB, Deonarine A, Chan DS, Connell CM, Roberts EW, Zhao Q, Caballero OL, et al. (2013). Targeting CXCL12 from FAP-expressing carcinoma- associated fi broblasts synergizes with anti – PD-L1 immunotherapy in pancreatic cancer. Proc Natl Acad Sci U S A 110, 20212–20217. [DOI] [PMC free article] [PubMed] [Google Scholar]
- Freedman RS, Vadhan-Raj S, Butts C, Savary C, Melichar B, Verschraegen C, Kavanagh JJ, Hicks ME, Levy LB, Folloder JK, and Garcia ME (2003). Pilot study of Flt3 ligand comparing intraperitoneal with subcutaneous routes on hematologic and immunologic responses in patients with peritoneal carcinomatosis and mesotheliomas. Clin Cancer Res 9, 5228–5237. [PubMed] [Google Scholar]
- Fukunaga A, Miyamoto M, Cho Y, Murakami S, Kawarada Y, Oshikiri T, Kato K, Kurokawa T, Suzuoki M, Nakakubo Y, et al. (2004). CD8+ tumor-infiltrating lymphocytes together with CD4+ tumor-infiltrating lymphocytes and dendritic cells improve the prognosis of patients with pancreatic adenocarcinoma. Pancreas 28, e26–31. [DOI] [PubMed] [Google Scholar]
- Furuhashi K, Suda T, Hasegawa H, Suzuki Y, Hashimoto D, Enomoto N, Fujisawa T, Nakamura Y, Inui N, Shibata K, et al. (2012). Mouse lung CD103 + and CD11b high dendritic cells preferentially induce distinct CD4 + T-cell responses. American Journal of Respiratory Cell and Molecular Biology 46, 165–172. [DOI] [PubMed] [Google Scholar]
- Gardner A, and Ruffell B (2016). Dendritic Cells and Cancer Immunity. Trends in Immunology 37, 855–865. [DOI] [PMC free article] [PubMed] [Google Scholar]
- Garris CS, Arlauckas SP, Kohler RH, Trefny MP, Garren S, Piot C, Engblom C, Pfirschke C, Siwicki M, Gungabeesoon J, et al. (2018). Successful Anti-PD-1 Cancer Immunotherapy Requires T Cell-Dendritic Cell Crosstalk Involving the Cytokines IFN-γ and IL-12. Immunity 49, 1148–1161.e1147. [DOI] [PMC free article] [PubMed] [Google Scholar]
- Gopinathan a., Morton JP, Jodrell DI, and Sansom OJ (2015). GEMMs as preclinical models for testing pancreatic cancer therapies. Disease Models & Mechanisms 8, 1185–1200. [DOI] [PMC free article] [PubMed] [Google Scholar]
- Grivennikov SI, Wang K, Mucida D, Stewart CA, Schnabl B, Jauch D, Taniguchi K, Yu GY, Österreicher CH, Hung KE, et al. (2012). Adenoma-linked barrier defects and microbial products drive IL-23/IL-17-mediated tumour growth. Nature 491, 254–258. [DOI] [PMC free article] [PubMed] [Google Scholar]
- Gu G, Dubauskaite J, and Melton DA (2002). Direct evidence for the pancreatic lineage: NGN3+ cells are islet progenitors and are distinct from duct progenitors. Development 129, 2447–2457. [DOI] [PubMed] [Google Scholar]
- Gubin MM, Zhang X, Schuster H, Caron E, Ward JP, Noguchi T, Ivanova Y, Hundal J, Arthur CD, Krebber W.-j., et al. (2014). Checkpoint blockade cancer immunotherapy targets tumour-specific mutant antigens. Nature 515, 577–581. [DOI] [PMC free article] [PubMed] [Google Scholar]
- Gunderson AJ, Kaneda MM, Tsujikawa T, Nguyen AV, Affara NI, Ruffell B, Gorjestani S, Liudahl SM, Truitt M, Olson P, et al. (2016). Bruton Tyrosine Kinase-Dependent Immune Cell Cross-talk Drives Pancreas Cancer. Cancer Discov 6, 270–285. [DOI] [PMC free article] [PubMed] [Google Scholar]
- Hammerich L, Marron TU, Upadhyay R, Svensson-Arvelund J, Dhainaut M, Hussein S, Zhan Y, Ostrowski D, Yellin M, Marsh H, et al. (2019). Systemic clinical tumor regressions and potentiation of PD1 blockade with in situ vaccination. Nature Medicine. [DOI] [PubMed] [Google Scholar]
- Henning JR, Graffeo CS, Rehman A, Fallon NC, Zambirinis CP, Ochi A, Barilla R, Jamal M, Deutsch M, Greco S, et al. (2013). Dendritic cells limit fibroinflammatory injury in nonalcoholic steatohepatitis in mice. Hepatology 58, 589–602. [DOI] [PMC free article] [PubMed] [Google Scholar]
- Hingorani SR, Petricoin EF, Maitra A, Rajapakse V, King C, Jacobetz M.a., Ross S, Conrads TP, Veenstra TD, Hitt B.a., et al. (2003). Preinvasive and invasive ductal pancreatic cancer and its early detection in the mouse. Cancer Cell 4, 437–450. [DOI] [PubMed] [Google Scholar]
- Hiraoka N, Yamazakiitoh R, Ino Y, Mizuguchi Y, Yamada T, Hirohashi S, and Kanai Y (2011). CXCL17 and ICAM2 are associated with a potential anti-tumor immune response in early intraepithelial stages of human pancreatic carcinogenesis. Gastroenterology 140, 310–321.e314. [DOI] [PubMed] [Google Scholar]
- Hope C, Emmerich PB, Papadas A, Pagenkopf A, Matkowskyj KA, Van De Hey DR, Payne SN, Clipson L, Callander NS, Hematti P, et al. (2017). Versican-Derived Matrikines Regulate Batf3–Dendritic Cell Differentiation and Promote T Cell Infiltration in Colorectal Cancer. The Journal of Immunology 199, 1933–1941. [DOI] [PMC free article] [PubMed] [Google Scholar]
- Hou WS, and Van Parijs L (2004). A Bcl-2-dependent molecular timer regulates the lifespan and immunogenicity of dendritic cells. Nat Immunol 5, 583–589. [DOI] [PubMed] [Google Scholar]
- Hoves S, Ooi CH, Wolter C, Sade H, Bissinger S, Schmittnaegel M, Ast O, Giusti AM, Wartha K, Runza V, et al. (2018). Rapid activation of tumor-associated macrophages boosts preexisting tumor immunity. J Exp Med 215, 859–876. [DOI] [PMC free article] [PubMed] [Google Scholar]
- Hugues S (2010). Dynamics of dendritic cell-T cell interactions: A role in T cell outcome. Seminars in Immunopathology 32, 227–238. [DOI] [PubMed] [Google Scholar]
- Ibrahim J, Nguyen AH, Rehman A, Ochi A, Jamal M, Graffeo CS, Henning JR, Zambirinis CP, Fallon NC, Barilla R, et al. (2012). Dendritic cell populations with different concentrations of lipid regulate tolerance and immunity in mouse and human liver. Gastroenterology 143, 1061–1072. [DOI] [PMC free article] [PubMed] [Google Scholar]
- Jang JE, Hajdu CH, Liot C, Miller G, Dustin ML, and Bar-Sagi D (2017). Crosstalk between Regulatory T Cells and Tumor-Associated Dendritic Cells Negates Anti-tumor Immunity in Pancreatic Cancer. Cell Reports 20, 558–571. [DOI] [PMC free article] [PubMed] [Google Scholar]
- Jiang H, Hegde S, Knolhoff BL, Zhu Y, Herndon JM, Meyer MA, Nywening TM, Hawkins WG, Shapiro IM, Weaver DT, et al. (2016). Targeting focal adhesion kinase renders pancreatic cancers responsive to checkpoint immunotherapy. Nature Medicine, 1–13. [DOI] [PMC free article] [PubMed] [Google Scholar]
- Jin C, Lagoudas GK, Zhao C, Bullman S, Bhutkar A, Hu B, Ameh S, Sandel D, Liang XS, Mazzilli S, et al. (2019). Commensal Microbiota Promote Lung Cancer Development via γδ T Cells. Cell 176, 998–1013.e1016. [DOI] [PMC free article] [PubMed] [Google Scholar]
- Kenkel JA, Tseng WW, Davidson MG, Tolentino LL, Choi O, Bhattacharya N, Seeley ES, Winer DA, Reticker-Flynn NE, and Engleman EG (2017). An immunosuppressive dendritic cell subset accumulates at secondary sites and promotes metastasis in pancreatic cancer. Cancer Research 77, 4158–4170. [DOI] [PMC free article] [PubMed] [Google Scholar]
- Kieler M, Unseld M, Bianconi D, and Prager G (2018). Challenges and Perspectives for Immunotherapy in Adenocarcinoma of the Pancreas: The Cancer Immunity Cycle. Pancreas 47, 142–157. [DOI] [PubMed] [Google Scholar]
- Kim MP, Evans DB, Wang H, Abbruzzese JL, Fleming JB, and Gallick GE (2009). Generation of orthotopic and heterotopic human pancreatic cancer xenografts in immunodeficient mice. Nat Protoc 4, 1670–1680. [DOI] [PMC free article] [PubMed] [Google Scholar]
- Kinkead HL, Hopkins A, Lutz E, Wu AA, Yarchoan M, Cruz K, Woolman S, Vithayathil T, Glickman LH, Ndubaku CO, et al. (2018). Combining STING-based neoantigen-targeted vaccine with checkpoint modulators enhances antitumor immunity in murine pancreatic cancer. JCI Insight 3. [DOI] [PMC free article] [PubMed] [Google Scholar]
- Kunk PR, Bauer TW, Slingluff CL, and Rahma OE (2016). From bench to bedside a comprehensive review of pancreatic cancer immunotherapy. J Immunother Cancer 4, 14. [DOI] [PMC free article] [PubMed] [Google Scholar]
- Laoui D, Keirsse J, Morias Y, Van Overmeire E, Geeraerts X, Elkrim Y, Kiss M, Bolli E, Lahmar Q, Sichien D, et al. (2016). The tumour microenvironment harbours ontogenically distinct dendritic cell populations with opposing effects on tumour immunity. Nature Communications 7, 13720. [DOI] [PMC free article] [PubMed] [Google Scholar]
- Lelkes E, Headley MB, Thornton EE, Looney MR, and Krummel MF (2014). The spatiotemporal cellular dynamics of lung immunity. Trends Immunol 35, 379–386. [DOI] [PMC free article] [PubMed] [Google Scholar]
- Li J, Byrne KT, Yan F, Yamazoe T, Chen Z, Baslan T, Richman LP, Lin JH, Sun YH, Rech AJ, et al. (2018). Tumor Cell-Intrinsic Factors Underlie Heterogeneity of Immune Cell Infiltration and Response to Immunotherapy. Immunity 49, 178–193.e177. [DOI] [PMC free article] [PubMed] [Google Scholar]
- Long KB, Gladney WL, Tooker GM, Graham K, Fraietta JA, and Beatty GL (2016). IFNgamma and CCL2 Cooperate to Redirect Tumor-Infiltrating Monocytes to Degrade Fibrosis and Enhance Chemotherapy Efficacy in Pancreatic Carcinoma. Cancer Discov 6, 400–413. [DOI] [PMC free article] [PubMed] [Google Scholar]
- Ma HS, Poudel B, Torres ER, Sidhom J-W, Robinson TM, Christmas B, Scott B, Cruz K, Woolman S, Wall VZ, et al. (2019). A CD40 Agonist and PD-1 Antagonist Antibody Reprogram the Microenvironment of Nonimmunogenic Tumors to Allow T-cell–Mediated Anticancer Activity. Cancer Immunology Research 7, 428–442. [DOI] [PMC free article] [PubMed] [Google Scholar]
- McAllister F, Bailey JM, Alsina J, Nirschl CJ, Sharma R, Fan H, Rattigan Y, Roeser JC, Lankapalli RH, Zhang H, et al. (2014). Oncogenic Kras activates a hematopoietic-to-epithelial IL-17 signaling axis in preinvasive pancreatic neoplasia. Cancer cell 25, 621–637. [DOI] [PMC free article] [PubMed] [Google Scholar]
- Meyer MA, Baer JM, Knolhoff BL, Nywening TM, Panni RZ, Su X, Weilbaecher KN, Hawkins WG, Ma C, Fields RC, et al. (2018). Breast and pancreatic cancer interrupt IRF8-dependent dendritic cell development to overcome immune surveillance. Nature Communications 9, 1250. [DOI] [PMC free article] [PubMed] [Google Scholar]
- Miga AJ, Masters SR, Durell BG, Gonzalez M, Jenkins MK, Maliszewski C, Kikutani H, Wade WF, and Noelle RJ (2001). Dendritic cell longevity and T cell persistence is controlled by CD154-CD40 interactions. Eur J Immunol 31, 959–965. [DOI] [PubMed] [Google Scholar]
- Miyazaki S, Miyazaki T, Tashiro F, Yamato E, and Miyazaki J.-i. (2005). Development of a singlecassette system for spatiotemporal gene regulation in mice. Biochemical and biophysical research communications 338, 1083–1088. [DOI] [PubMed] [Google Scholar]
- Morse MA, Nair S, Fernandez-Casal M, Deng Y, St Peter M, Williams R, Hobeika A, Mosca P, Clay T, Cumming RI, et al. (2000). Preoperative mobilization of circulating dendritic cells by Flt3 ligand administration to patients with metastatic colon cancer. J Clin Oncol 18, 3883–3893. [DOI] [PubMed] [Google Scholar]
- Morton JP, Timpson P, Karim S.a., Ridgway R.a., Athineos D, Doyle B, Jamieson NB, Oien K.a., Lowy AM, Brunton VG, et al. (2010). Mutant p53 drives metastasis and overcomes growth arrest/senescence in pancreatic cancer. Proceedings of the National Academy of Sciences of the United States of America 107, 246–251. [DOI] [PMC free article] [PubMed] [Google Scholar]
- Nair S, and Dhodapkar MV (2017). Natural Killer T Cells in Cancer Immunotherapy. Front Immunol 8, 1178. [DOI] [PMC free article] [PubMed] [Google Scholar]
- Ngwa W, Irabor OC, Schoenfeld JD, Hesser J, Demaria S, and Formenti SC (2018). Using immunotherapy to boost the abscopal effect. Nat Rev Cancer 18, 313–322. [DOI] [PMC free article] [PubMed] [Google Scholar]
- O’Donnell JS, Teng MWL, and Smyth MJ (2019). Cancer immunoediting and resistance to T cell-based immunotherapy. Nat Rev Clin Oncol 16, 151–167. [DOI] [PubMed] [Google Scholar]
- Ochi A, Nguyen AH, Bedrosian AS, Mushlin HM, Zarbakhsh S, Barilla R, Zambirinis CP, Fallon NC, Rehman A, Pylayeva-Gupta Y, et al. (2012). MyD88 inhibition amplifies dendritic cell capacity to promote pancreatic carcinogenesis via Th2 cells. The Journal of Experimental Medicine 209, 1671–1687. [DOI] [PMC free article] [PubMed] [Google Scholar]
- Ouaaz F, Arron J, Zheng Y, Choi Y, and Beg AA (2002). Dendritic cell development and survival require distinct NF-kappaB subunits. Immunity 16, 257–270. [DOI] [PubMed] [Google Scholar]
- Poschke I, Faryna M, Bergmann F, Flossdorf M, Lauenstein C, Hermes J, Hinz U, Hank T, Ehrenberg R, Volkmar M, et al. (2016). Identification of a tumor-reactive T-cell repertoire in the immune infiltrate of patients with resectable pancreatic ductal adenocarcinoma. OncoImmunology 5, e1240859. [DOI] [PMC free article] [PubMed] [Google Scholar]
- Pushalkar S, Hundeyin M, Daley D, Zambirinis CP, Kurz E, Mishra A, Mohan N, Aykut B, Usyk M, Torres LE, et al. (2018). The pancreatic cancer microbiome promotes oncogenesis by induction of innate and adaptive immune suppression. Cancer Discovery 8, 403–416. [DOI] [PMC free article] [PubMed] [Google Scholar]
- Pylayeva-Gupta Y, Das S, Handler JS, Hajdu CH, Coffre M, Koralov SB, and Bar-Sagi D (2016). IL35-producing b cells promote the development of pancreatic neoplasia. Cancer Discovery 6, 247–255. [DOI] [PMC free article] [PubMed] [Google Scholar]
- Ray KC, Moss ME, Franklin JL, Weaver CJ, Higginbotham J, Song Y, Revetta FL, Blaine SA, Bridges LR, Guess KE, et al. (2014). Heparin-binding epidermal growth factor-like growth factor eliminates constraints on activated Kras to promote rapid onset of pancreatic neoplasia. Oncogene 33, 823–831. [DOI] [PMC free article] [PubMed] [Google Scholar]
- Rech AJ, Dada H, Kotzin JJ, Henao-Mejia J, Minn AJ, Victor CTS, and Vonderheide RH (2018). Radiotherapy and CD40 activation separately augment immunity to checkpoint blockade in cancer. Cancer Research 78, 4282–4291. [DOI] [PMC free article] [PubMed] [Google Scholar]
- Rhim AD, Mirek ET, Aiello NM, Maitra A, Bailey JM, McAllister F, Reichert M, Beatty GL, Rustgi AK, Vonderheide RH, et al. (2012). EMT and dissemination precede pancreatic tumor formation. Cell 148, 349–361. [DOI] [PMC free article] [PubMed] [Google Scholar]
- Roberts EW, Broz ML, Binnewies M, Bogunovic D, Bhardwaj N, Krummel MF, Roberts EW, Broz ML, Binnewies M, Headley MB, et al. (2016). Critical Role for CD103 + / CD141 + Dendritic Cells Bearing CCR7 for Tumor Antigen Trafficking and Priming of T Cell Immunity in Melanoma. Cancer Cell, 1–13. [DOI] [PMC free article] [PubMed] [Google Scholar]
- Routy B, Le Chatelier E, Derosa L, Duong CPM, Alou MT, Daillere R, Fluckiger A, Messaoudene M, Rauber C, Roberti MP, et al. (2018). Gut microbiome influences efficacy of PD-1-based immunotherapy against epithelial tumors. Science 359, 91–97. [DOI] [PubMed] [Google Scholar]
- Royal RE, Levy C, Turner K, Mathur A, Hughes M, Kammula US, Sherry RM, Topalian SL, Yang JC, Lowy I, and Rosenberg S.a. (2010). Phase 2 trial of single agent Ipilimumab (anti-CTLA-4) for locally advanced or metastatic pancreatic adenocarcinoma. Journal of immunotherapy (Hagerstown, Md. : 1997) 33, 828–833. [DOI] [PMC free article] [PubMed] [Google Scholar]
- Salmon H, Idoyaga J, Rahman A, Leboeuf M, Remark R, Jordan S, Casanova-Acebes M, Khudoynazarova M, Agudo J, Tung N, et al. (2016). Expansion and Activation of CD103+ Dendritic Cell Progenitors at the Tumor Site Enhances Tumor Responses to Therapeutic PD-L1 and BRAF Inhibition. Immunity 44, 924–938. [DOI] [PMC free article] [PubMed] [Google Scholar]
- Salmon H, Remark R, Gnjatic S, and Merad M (2019). Host tissue determinants of tumour immunity. Nature Reviews Cancer. [DOI] [PMC free article] [PubMed] [Google Scholar]
- Satpathy AT, KC W, Albring JC, Edelson BT, Kretzer NM, Bhattacharya D, Murphy TL, and Murphy KM (2012). Zbtb46 expression distinguishes classical dendritic cells and their committed progenitors from other immune lineages The Journal of Experimental Medicine 209, 1135–1152. [DOI] [PMC free article] [PubMed] [Google Scholar]
- Schietinger A, Philip M, Krisnawan VE, Chiu EY, Delrow JJ, Basom RS, Lauer P, Brockstedt DG, Knoblaugh SE, Hämmerling GJ, et al. (2016). Tumor-Specific T Cell Dysfunction Is a Dynamic Antigen-Driven Differentiation Program Initiated Early during Tumorigenesis. Immunity, 1–13. [DOI] [PMC free article] [PubMed] [Google Scholar]
- Schumacher TN, and Schreiber RD (2015). Neoantigens in cancer immunotherapy. Science 348, 69–74. [DOI] [PubMed] [Google Scholar]
- Sharma P, Hu-Lieskovan S, Wargo JA, and Ribas A (2017). Primary, Adaptive, and Acquired Resistance to Cancer Immunotherapy. Cell 168, 707–723. [DOI] [PMC free article] [PubMed] [Google Scholar]
- Sivick KE, Desbien AL, Glickman LH, Reiner GL, Corrales L, Surh NH, Hudson TE, Vu UT, Francica BJ, Banda T, et al. (2018). Magnitude of Therapeutic STING Activation Determines CD8 + T Cell-Mediated Anti-tumor Immunity. Cell Reports 25, 3074–3085.e3075. [DOI] [PubMed] [Google Scholar]
- Spear S, Candido JB, McDermott JR, Ghirelli C, Maniati E, Beers SA, Balkwill FR, Kocher HM, and Capasso M (2019). Discrepancies in the Tumor Microenvironment of Spontaneous and Orthotopic Murine Models of Pancreatic Cancer Uncover a New Immunostimulatory Phenotype for B Cells. Front Immunol 10, 542. [DOI] [PMC free article] [PubMed] [Google Scholar]
- Spranger S, Dai D, Horton B, and Gajewski TF (2017). Tumor-Residing Batf3 Dendritic Cells Are Required for Effector T Cell Trafficking and Adoptive T Cell Therapy. Cancer Cell 31, 711–723.e714. [DOI] [PMC free article] [PubMed] [Google Scholar]
- Stromnes IM, Brockenbrough JS, Izeradjene K, Carlson M.a., Cuevas C, Simmons RM, Greenberg PD, and Hingorani SR (2014). Targeted depletion of an MDSC subset unmasks pancreatic ductal adenocarcinoma to adaptive immunity. Gut, 1–13. [DOI] [PMC free article] [PubMed] [Google Scholar]
- Stromnes IM, Burrack AL, Hulbert A, Bonson P, Black C, Brockenbrough JS, Raynor JF, Spartz EJ, Pierce RH, Greenberg PD, and Hingorani SR (2019). Differential Effects of Depleting versus Programming Tumor-Associated Macrophages on Engineered T Cells in Pancreatic Ductal Adenocarcinoma. Cancer Immunol Res, canimm.0448.2018. [DOI] [PMC free article] [PubMed] [Google Scholar]
- Stromnes IM, Schmitt TM, Hulbert A, Brockenbrough JS, Nguyen HN, Cuevas C, Dotson AM, Tan X, Hotes JL, Greenberg PD, and Hingorani SR (2015). T Cells Engineered against a Native Antigen Can Surmount Immunologic and Physical Barriers to Treat Pancreatic Ductal Adenocarcinoma. Cancer Cell, 1–15. [DOI] [PMC free article] [PubMed] [Google Scholar]
- Twyman-Saint Victor C, Rech AJ, Maity A, Rengan R, Pauken KE, Stelekati E, Benci JL, Xu B, Dada H, Odorizzi PM, et al. (2015). Radiation and dual checkpoint blockade activate non-redundant immune mechanisms in cancer. Nature 520, 373–377. [DOI] [PMC free article] [PubMed] [Google Scholar]
- Vonderheide RH (2018). The Immune Revolution: A Case for Priming, Not Checkpoint. Cancer Cell 33, 563–569. [DOI] [PMC free article] [PubMed] [Google Scholar]
- Wang S, Li Z, and Hu G (2017). Prognostic role of intratumoral IL-17A expression by immunohistochemistry in solid tumors: a meta-analysis. Oncotarget 8, 66382–66391. [DOI] [PMC free article] [PubMed] [Google Scholar]
- Zhang Y, Velez-delgado A, Mathew E, Li D, Mendez FM, Flannagan K, Rhim AD, Simeone DM, Beatty GL, and Pasca M (2016). Myeloid cells are required for PD-1 / PD-L1 checkpoint activation and the establishment of an immunosuppressive environment in pancreatic cancer. Gut, 1–13. [DOI] [PMC free article] [PubMed] [Google Scholar]
- Zhang Y, Yan W, Mathew E, Bednar F, Wan S, Collins M.a., Evans R.a., Welling TH, Vonderheide RH, and di Magliano MP (2014). CD4+ T Lymphocyte Ablation Prevents Pancreatic Carcinogenesis in Mice. Cancer immunology research 2, 423–435. [DOI] [PMC free article] [PubMed] [Google Scholar]
- Zhang Y, Zoltan M, Riquelme E, Xu H, Sahin I, Castro-Pando S, Montiel MF, Chang K, Jiang Z, Ling J, et al. (2018). Immune Cell Production of Interleukin 17 Induces Stem Cell Features of Pancreatic Intraepithelial Neoplasia Cells. Gastroenterology 155, 210–223.e213. [DOI] [PMC free article] [PubMed] [Google Scholar]
- Zilionis R, Engblom C, Pfirschke C, Savova V, Zemmour D, Saatcioglu HD, Krishnan I, Maroni G, Meyerovitz CV, Kerwin CM, et al. (2019). Single-Cell Transcriptomics of Human and Mouse Lung Cancers Reveals Conserved Myeloid Populations across Individuals and Species. Immunity 50, 1317–1334 e1310. [DOI] [PMC free article] [PubMed] [Google Scholar]
Associated Data
This section collects any data citations, data availability statements, or supplementary materials included in this article.
Supplementary Materials
Data Availability Statement
Bulk-RNA sequencing data from KPC or KPC-OG pancreatic lesions can be found at the Gene Expression Omnibus Repository (GEO) accession number GSE131602. All software packages used are publicly available through commercial vendors.