Abstract
Background:
ETS transcription factor Etv2 / Etsrp is one of the earliest markers for vascular and hematopoietic progenitors and functions as a key regulator of hematovascular development in multiple vertebrates, including zebrafish. Therefore transgenic etv2 reporter lines provide a valuable tool to study vasculogenesis and hematopoiesis. However, previously generated zebrafish reporter lines do not fully recapitulate the endogenous pattern of etv2 expression.
Results:
Here we used CRISPR / Cas9-mediated homology-independent DNA repair approach to knock-in a Gal4 transcriptional activator into the zebrafish etv2 genomic locus, thus generating etv2ci32Gt gene trap line. etv2ci32Gt; UAS:GFP embryos show GFP expression in vascular endothelial, myeloid and red blood cells. Because gal4 insertion interrupts the etv2 locus, homozygous etv2ci32Gt embryos display defects in vasculogenesis and myelopoiesis, and enable visualizing etv2-deficient hematovascular progenitors in live embryos. Furthermore, we performed differential transcriptome analysis of sorted GFP-positive cells from heterozygous and homozygous etv2ci32Gt embryos. Approximately 500 downregulated genes were identified in etv2ci32Gt homozygous embryos, which include multiple genes expressed in vascular endothelial and myeloid cells.
Conclusions:
The etv2ci32Gt gene trap line and the datasets of misregulated genes will be valuable resources to study hematopoietic and vascular development.
Keywords: CRISPR, Cas9, RNA-seq, transcriptome, vascular endothelial, myeloid, red blood cell, zebrafish
INTRODUCTION
During vertebrate embryogenesis, vascular endothelial progenitors originate in the yolk sac and / or lateral plate mesoderm and coalesce into the first embryonic blood vessels. An evolutionarily conserved ETS transcription factor Etv2 / ER71/ Etsrp is one of the earliest markers of vascular endothelial and hematopoietic progenitors (Sumanas and Lin, 2006; Pham et al., 2007; Lee et al., 2008; Sumanas et al., 2008). In zebrafish, an advantageous model system to study early hematovascular development, etv2 is expressed in all vascular endothelial progenitors which originate in the anterior and posterior lateral plate mesoderm (ALPM or PLPM, respectively) (Sumanas and Lin, 2006; Sumanas et al., 2008). Zebrafish etv2 mutants and morpholino knockdown embryos display nearly complete loss of early vascular endothelial differentiation prior to 24 hpf (Sumanas and Lin, 2006). At later developmental stages, vascular development partially recovers due to the redundancy of etv2 with a related ETS transcription factor fli1b (Craig et al., 2015). In addition to its role in vascular development, etv2 is also required for myelopoiesis in zebrafish embryos (Sumanas et al., 2008). Etv2 MO-injected zebrafish embryos display loss of myeloid cells, suggesting that etv2 functions in early myeloid progenitors which originate in the zebrafish ALPM region. These etv2 functions are conserved between vertebrate embryos, and mouse Etv2 mutant embryos show failure of yolk sac and intraembryonic vasculogenesis and hematopoiesis (Lee et al., 2008; Ferdous et al., 2009).
Because etv2 is one of the earliest markers for hematopoietic and vascular progenitors, etv2 transgenic reporter lines have been a valuable tool to study vascular and hematopoietic development. A few such zebrafish reporter lines have been previously generated and include the TgBAC(etv2:GFP), which was generated by BAC recombineering (Proulx et al., 2010), and the Tg(−2.3 etv2:GFP) reporter line, which contains 2.3 kb region of the etv2 promoter and the first intron (Veldman and Lin, 2012). Both of these lines appear to recapitulate etv2 expression in vascular endothelial progenitors and differentiated vascular endothelial cells during early stages of vascular development. However, the TgBAC(etv2:GFP) line shows non-specific expression in the neural tube while the Tg(−2.3 etv2:GFP) line shows non-specific expression in epithelial and neuronal cells (Proulx et al., 2010; Davis et al., 2018). Furthermore, not all distal regulatory elements involved in the dynamic regulation of etv2 expression may be present in these reporters.
CRISPR/Cas9-mediated knock-in approaches allow inserting a construct of interest into the endogenous gene locus, thus preserving regulatory elements that would be excluded by other methods of transgenesis. Knock-in strategies that utilize homologous recombination and homology-independent DNA repair have been previously reported in zebrafish embryos (Auer et al., 2014; Hoshijima et al., 2016). Here we performed CRISPR/Cas9-mediated knock-in of a targeting vector containing Gal4 transcriptional activator into the endogenous etv2 locus. Using this approach, we generated the etv2Gt(2A-Gal4)ci32 line (further referred to as etv2ci32Gt), which, when crossed with the Tg(UAS:EGFP) line, shows highly specific GFP expression in vascular endothelial and hematopoietic cells. Due to an interruption of the etv2 coding sequence, homozygous etv2ci32Gt embryos show strong defects in vascular development, allowing to visualize vascular progenitors in the etv2 loss-of-function background. We further used these lines to analyze global transcriptional changes observed in etv2ci32Gt homozygous embryos, which resulted in identification of multiple novel candidate vascular endothelial and myeloid-specific genes. This reporter line will be a valuable tool for multiple researchers studying vascular and hematopoietic development.
RESULTS
Generation of etv2ci32Gt zebrafish knock-in line.
To generate a reporter line, which would accurately label etv2-expressing cells in live zebrafish embryos, we employed a targeted knock-in approach. A highly efficient CRISPR / Cas9-mediated knock-in strategy has been previously reported, which utilizes homology-independent DNA repair (Auer et al., 2014). We designed and tested single-guide RNA (sgRNA) which targeted exon 5 of the etv2 gene with nearly 100% efficiency (data not shown). Subsequently, we engineered a donor construct which contained etv2 sgRNA bait sequence followed by the self-cleaving P2A peptide sequence fused to Gal4 transcriptional activator and polyadenylation sequence (Fig. 1). Integration of this construct in-frame with etv2 coding sequence was expected to result in expression of the N-terminal fragment of Etv2 protein and a separate Gal4 protein. Although the N-terminal fragment of Etv2 was not expected to show any functional activity, heterozygous embryos were expected to be morphologically normal, while homozygous embryos should recapitulate the etv2 loss-of-function phenotype due to the absence of full-length Etv2 protein.
Figure 1.
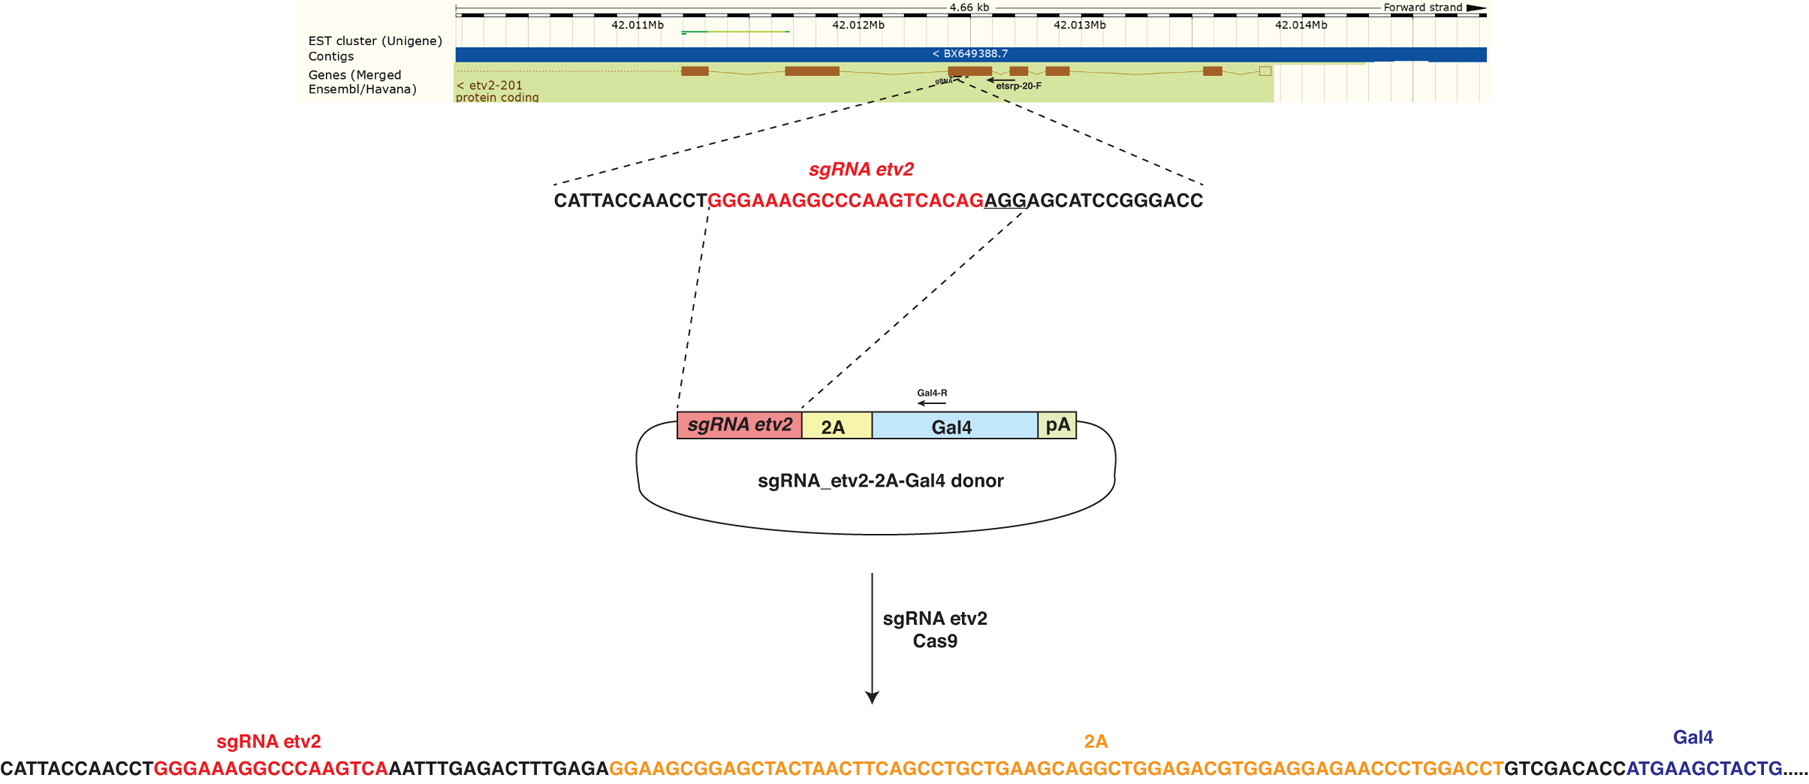
A diagram of sgRNA-2A-Gal4 construct and its insertion into the etv2 genomic locus. The targeting construct contained etv2 sgRNA site, followed by in-frame fusion to the viral peptide P2A, a transcriptional activator Gal4 and the SV40 polyA sequence. etv2 sgRNA targets the fifth exon of etv2 genomic sequence. The diagram shows approximate locations (not to scale) of the primers used for PCR amplification and sequencing.
A mixture containing Cas9 mRNA, etv2 sgRNA, and the etv2 sgRNA-2A-Gal4 donor plasmid was injected into UAS:GFP transgenic embryos. A fraction of embryos showed mosaic GFP expression in vascular endothelial cells. Subsequently, the embryos were raised and fish progeny were screened for GFP expression. A founder was identified which produced embryos with specific GFP expression in the vasculature. The integration site was analyzed by PCR amplification and Sanger sequencing using genomic DNA isolated from GFP positive embryos. As expected, the P2A-Gal4 construct was specifically integrated in exon 5 of the etv2 gene (Fig. 1). Unexpectedly, the predicted translation of the P2A-Gal4 was out of frame with the predicted translation of the etv2 gene. It is possible that an alternative peptide can be produced from etv2 mRNA in a different reading frame, which contains an upstream ATG codon. Alternatively, Gal4 translation may be initiated internally due to the presence of a strong Kozak sequence which was included in the construct design. To test for these possibilities, we designed etv2–2A-GFP reporter construct which contained 5’UTR of etv2 gene, N-terminal portion of the Etv2 protein coding sequence and 2A-GFP sequence which was joined out-of-frame to the etv2 coding sequence, precisely recapitulating the integration site present in etv2ci32Gt embryos. Mutations in all four potentially-initiating ATG sites in the etv2 coding sequence resulted in greatly increased GFP fluorescence compared to wt construct (Fig. 2). This suggests that there is a competing translation from both reading frames 1 and 2 present in embryos injected with the wild-type (wt) construct. Mutations that affect translation in frame 1 result in increased translation from frame 2. Mutation in the upstream ATG codon present in frame 2, as well as the ATG codon, which initiates GFP translation resulted in reduced fluorescence compared with the wt construct (Fig. 2). This suggests that translation from both ATG codons in frame 2 contributes to Gal4 expression in etv2ci32Gt embryos.
Figure 2.
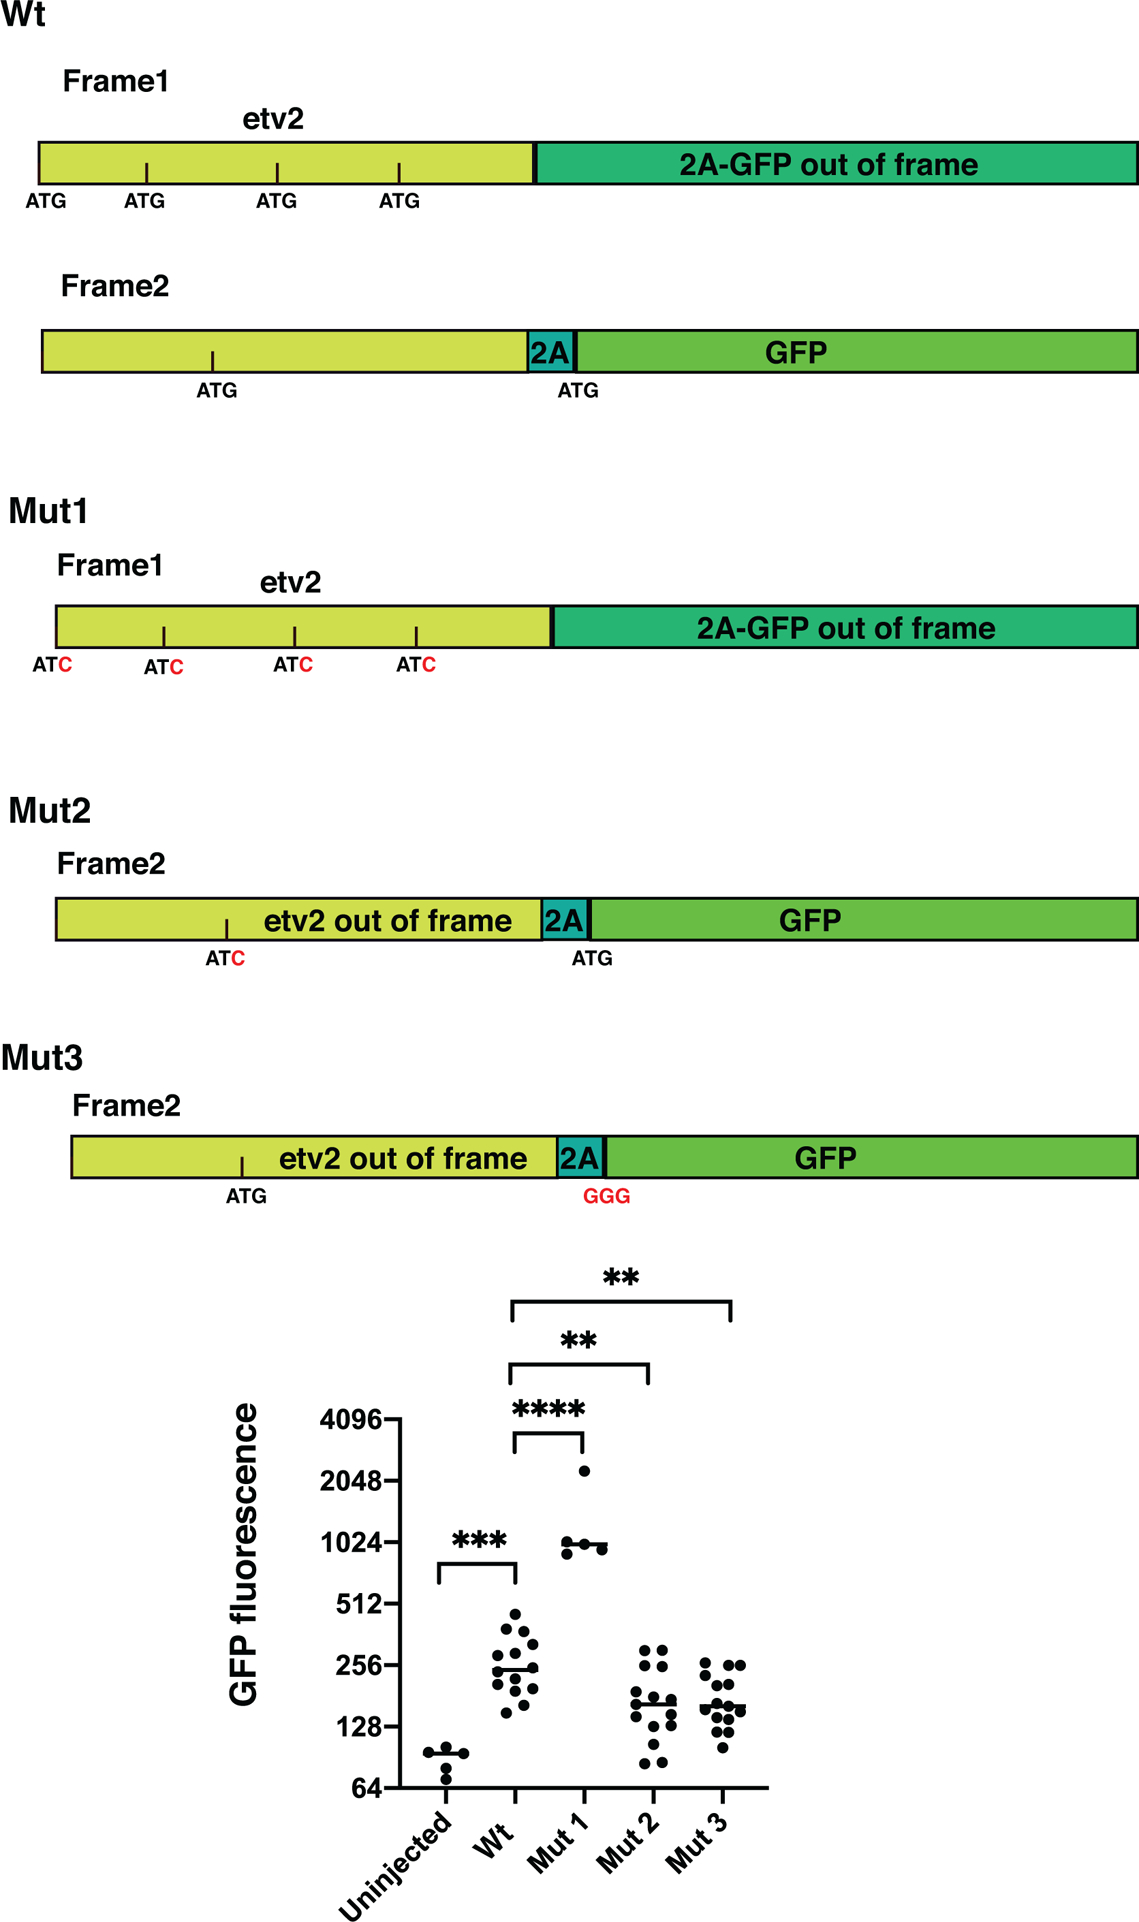
Effect of different mutations on expression of the etv2-2A-GFP reporter. The reporter was designed to mimic the insertion of 2A-Gal4 into the genomic etv2 locus. Wild-type (wt) construct contains 5’UTR and the N-terminal coding sequence of the etv2 gene, and 2A-GFP sequence inserted out-of-frame. Four potential translation-initiating ATG sequences are shown in Frame 1. Frame 2 contains a single initiating ATG which is in-frame with 2A-GFP translation. Mutant 1 (Mut1) has mutations in all four ATG sites present in frame 1. Mutant 2 (Mut2) has mutation in the ATG site within the frame 2. Mutant 3 (Mut3) has a mutation within the ATG sequence that initiates GFP translation. The scatter plot shows relative GFP fluorescence intensity values (plotted in log2 scale) of embryos injected with different etv2–2A-GFP reporter constructs. Note increased GFP fluorescence in embryos injected with Mut1 construct and reduced expression in Mut2 and Mut3-injected embryos compared to embryos injected with the wt construct. ** p<0.01, *** p<0.001, ****p<0.0001, t-Student’s test (two-tailed).
In some cases CRISPR / Cas9 may cleave at off-target sites, which could result in the insertion of 2A-gal4 construct into additional sites within the zebrafish genome. We analyzed RNA-seq results obtained from etv2ci32Gt heterozygous embryos at the 15-somite stage (see Transcriptome analysis section below for additional details). All analyzed sequence reads that contained 2A-Gal4 sequence at the 5’ end were fused to the same upstream etv2 sequence. While this does not exclude the possibility of additional insertion sites, it shows that their contribution to GFP expression (if there was any) would be negligibly small.
etv2ci32Gt knock-in line labels vascular endothelial and blood cells.
GFP expression was then analyzed in etv2ci32Gt heterozygous embryos in Tg(UAS:GFP) background and compared with GFP expression in Tg(−2.3 etv2:GFP) and TgBAC(etv2:GFP) lines, as well as with the endogenous etv2 expression pattern. Specific GFP expression in vascular endothelial progenitors in the cranial, trunk and tail regions was observed in both etv2ci32Gt; UAS:GFP and Tg(−2.3 etv2:GFP) lines at the 14–21-somite stages, which was very similar to the endogenous etv2 expression pattern analyzed by in situ hybridization (Fig. 3). Tg(−2.3 etv2:GFP) line also showed weak non-specific GFP expression in the epidermal cells which was not apparent in etv2ci32Gt; UAS:GFP embryos. etv2ci32Gt; UAS:GFP embryos were also much brighter compared to Tg(−2.3 etv2:GFP) embryos. TgBAC (etv2:GFP) line, as reported previously (Proulx et al., 2010), exhibited strong non-specific GFP expression in the neural tube which was absent in the other two lines (Fig. 3). At 24 hpf stage, GFP expression in the etv2ci32Gt; UAS:GFP line was apparent in vascular endothelial cells of all blood vessels (Fig. 4). In addition, GFP expression was also present in red blood cells and macrophages, which did not show vascular endothelial mCherry expression when crossed to kdrl:mCherry line. The two other etv2 reporter lines also exhibited similar expression patterns at this stage, except that TgBAC(etv2:GFP) line also exhibited non-specific neural tube expression (Fig. 4). Endogenous etv2 expression was apparent in the vasculature but not red blood cells or macrophages (Fig. 4I). As we have suggested previously (Sumanas et al., 2008; Proulx et al., 2010), GFP fluorescence is observed in blood cells likely due to the perdurance of GFP protein; etv2 is expressed in early hematopoietic progenitors but is downregulated as these cells differentiate.
Figure 3.
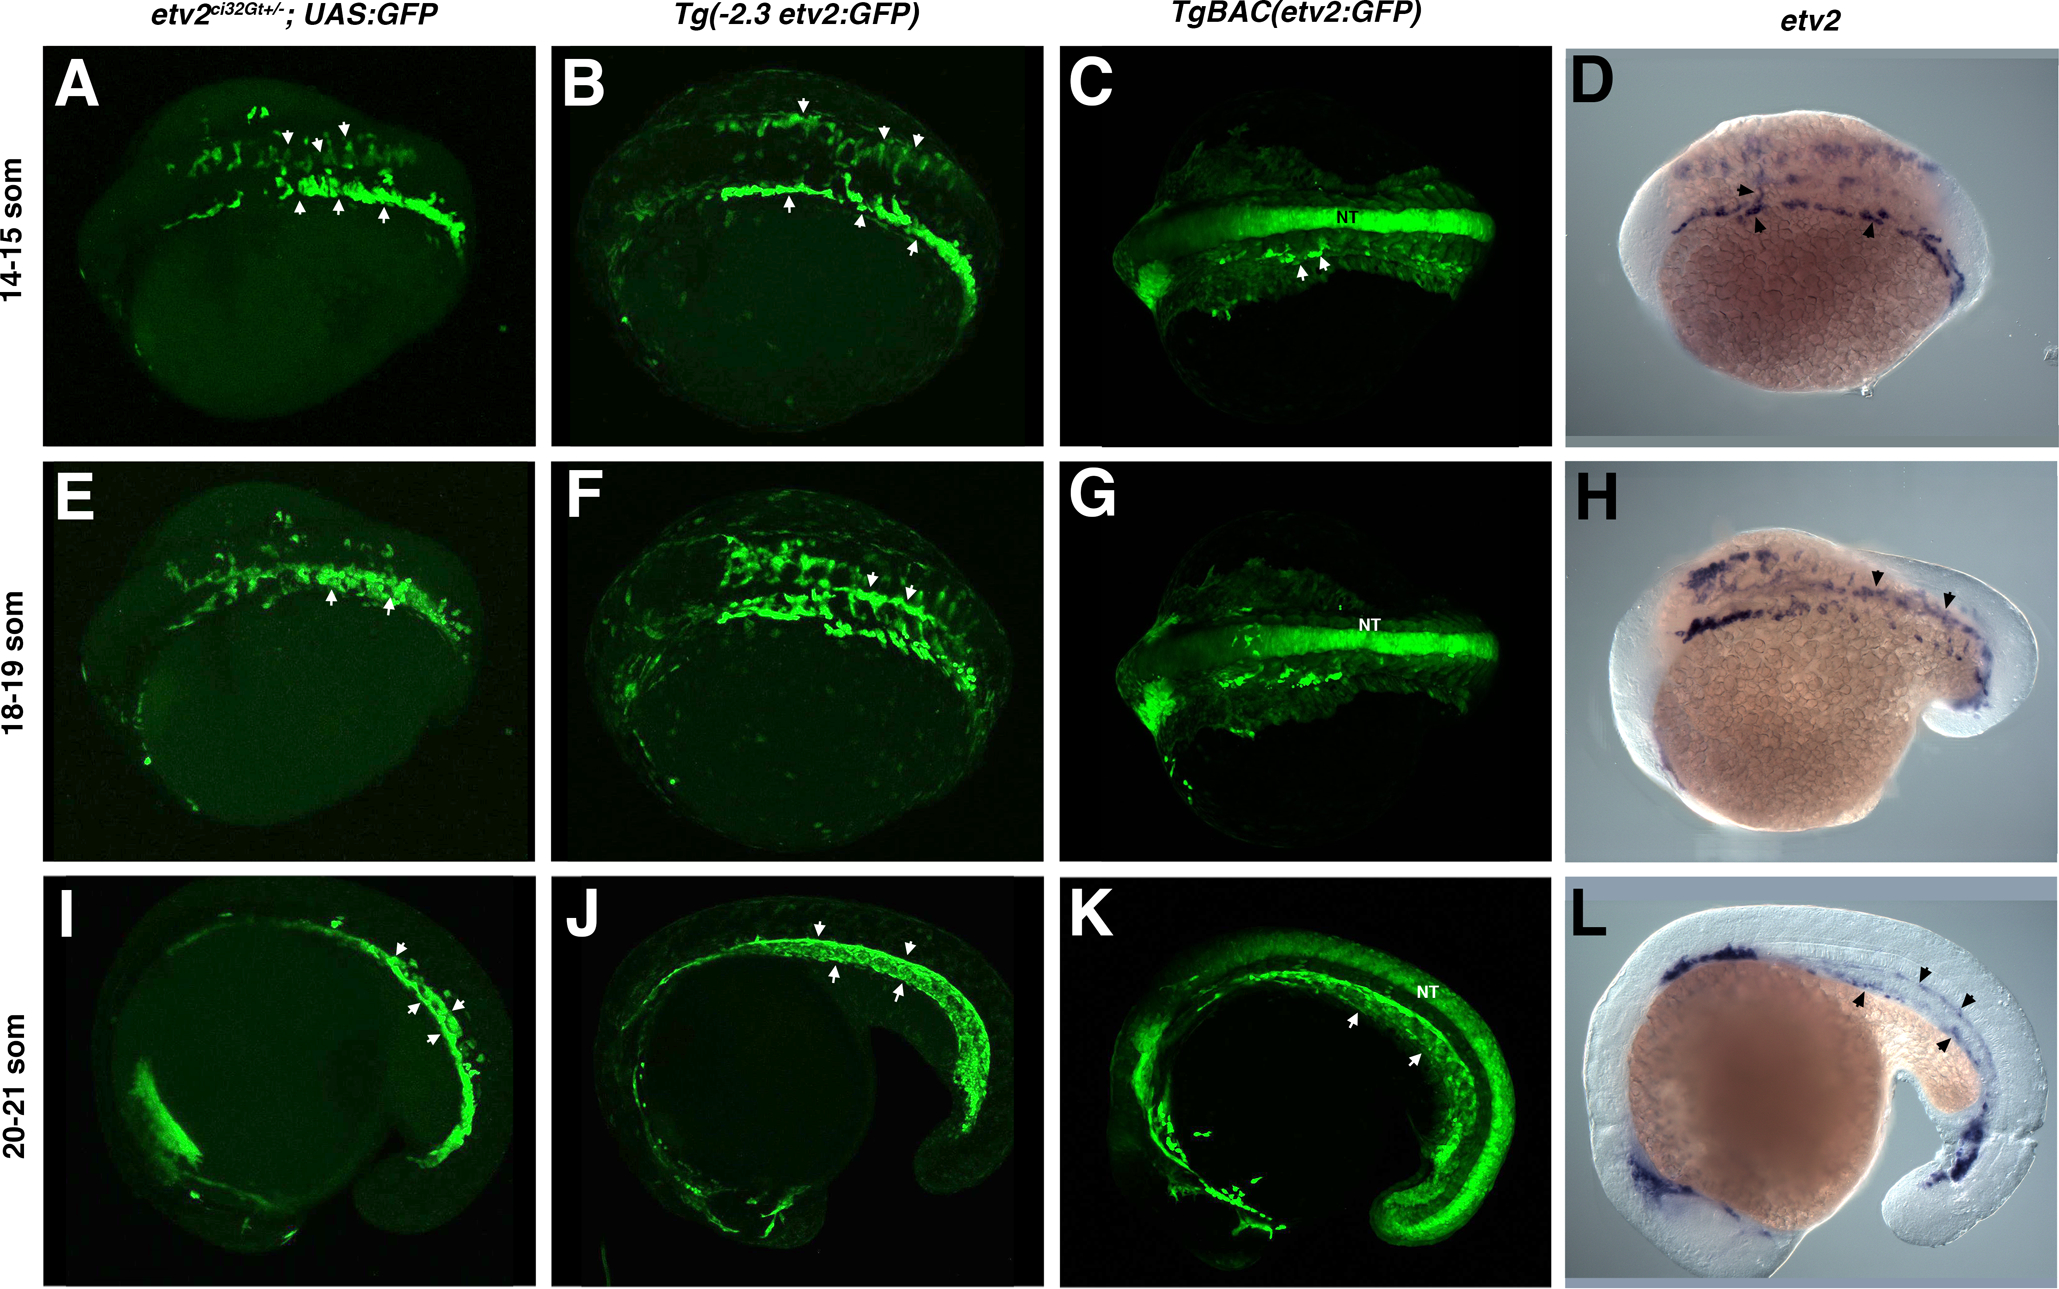
A comparison of etv2ci32Gt+/−; UAS:GFP, Tg(−2.3etv2:GFP), TgBAC(etv2:GFP) fluorescence pattern and etv2 mRNA expression analyzed by in situ hybridization (ISH) at the 14–21 somite stages. (A-C) GFP fluorescence or (D) etv2 mRNA expression is apparent in bilaterally located vascular endothelial progenitors which have started migrating towards the midline at the 14–15-somite stages (arrowheads). Strong non-specific GFP expression in the neural tube (NT) is apparent in TgBAC(etv2:GFP) embryos. (E-H) GFP-positive vascular endothelial progenitors at the 18–19-somite stages are coalescing at the midline into vascular cords (arrowheads, E,F). Similar etv2 expression pattern is observed by ISH analysis (H). (I-L) GFP expression at the 20–21-somite stages is apparent in the forming axial vasculature (arrowheads), and non-specific expression is apparent in the neural tube (K). Similar etv2 expression pattern is apparent from ISH analysis (L). A-H, dorsal or dorso-lateral view; I-L, lateral view, anterior is to the left.
Figure 4.
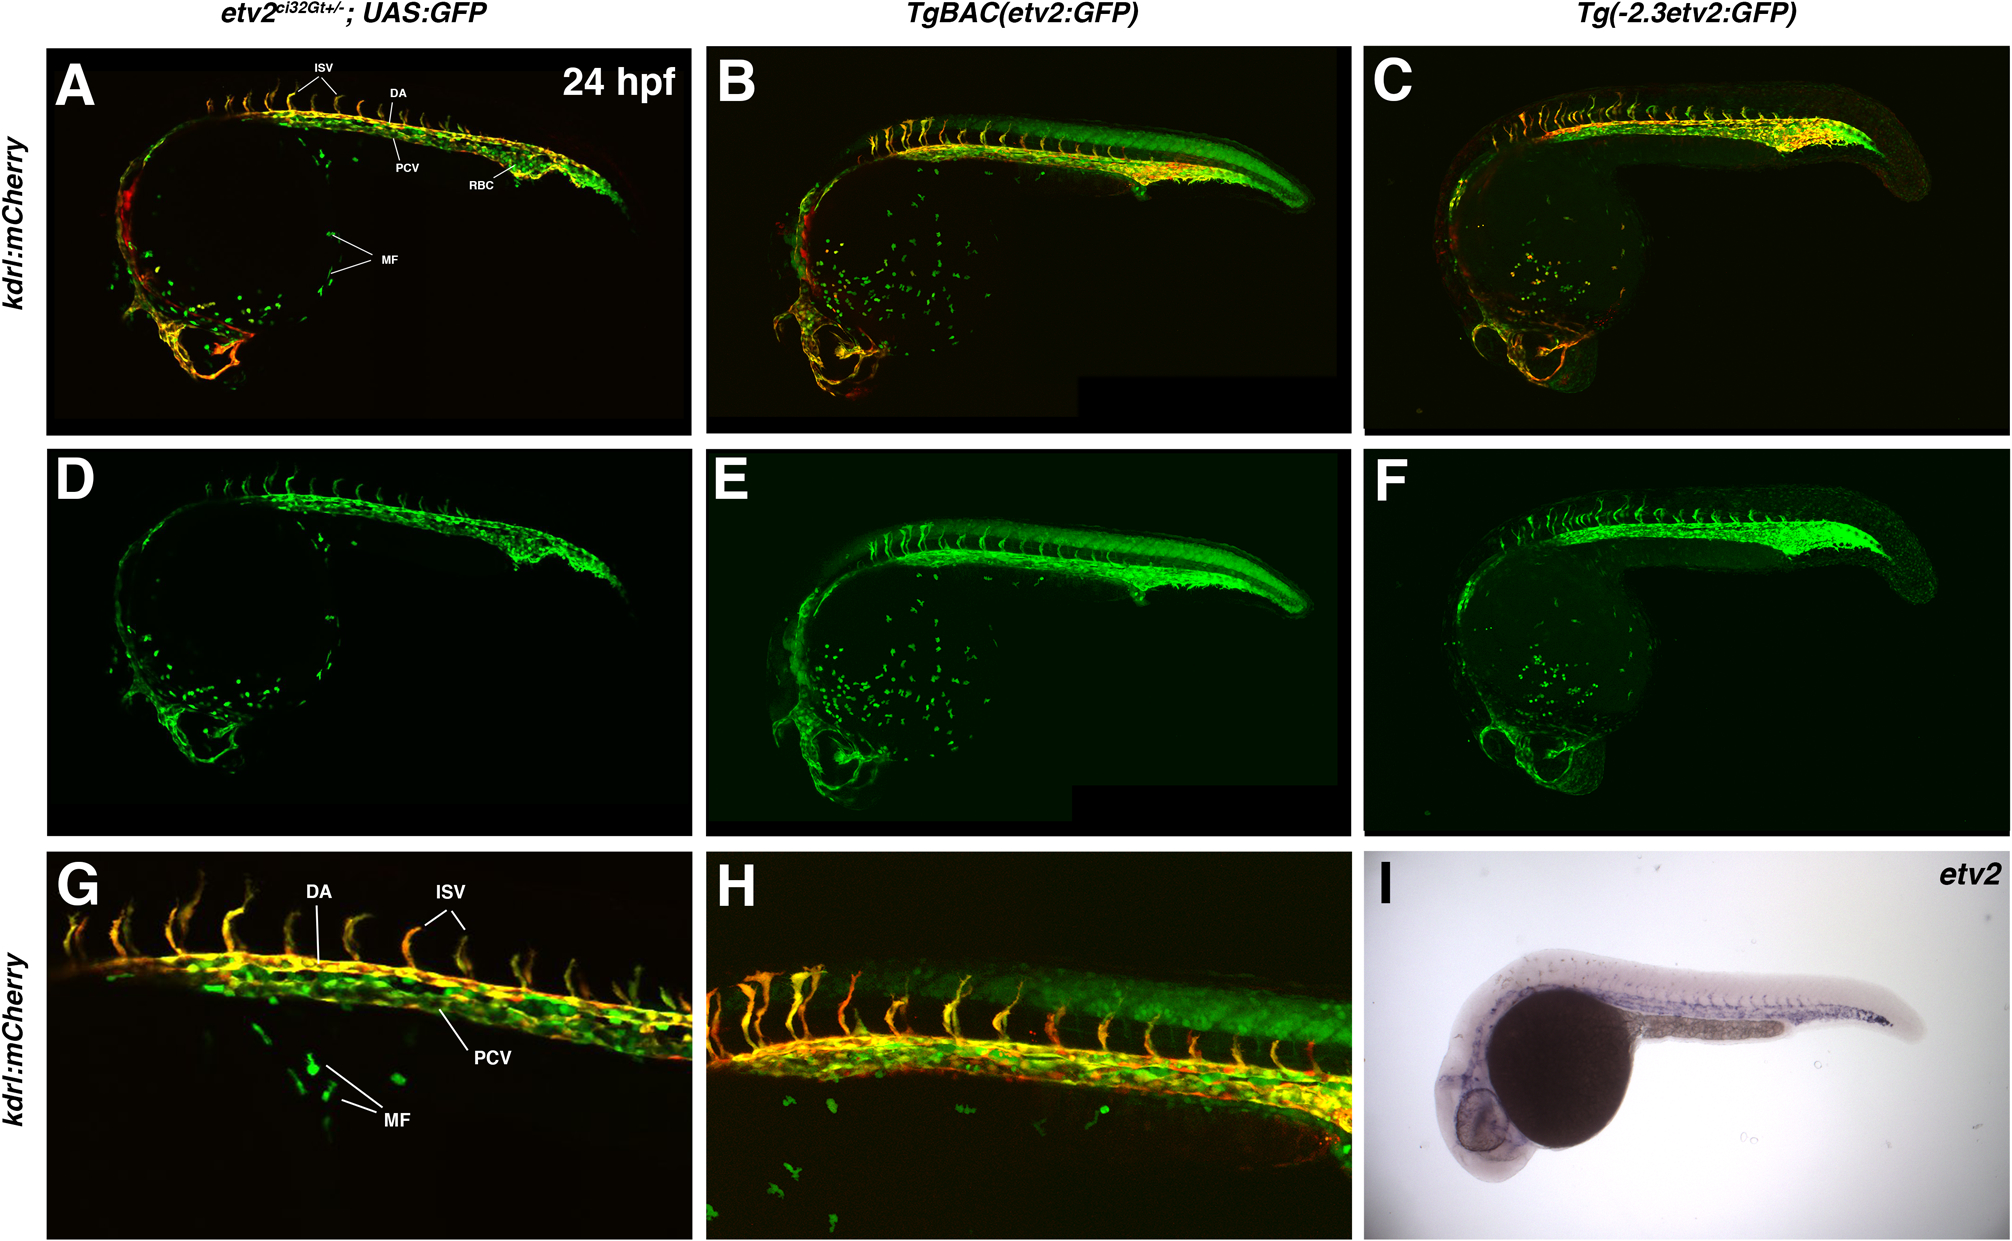
A comparison of etv2ci32Gt+/−; UAS:GFP, TgBAC(etv2:GFP), Tg(−2.3etv2:GFP) fluorescence pattern (in kdrl:mCherry background, top row) and etv2 mRNA expression analyzed by in situ hybridization (ISH) at 24 hpf. etv2ci32Gt+/−; UAS:GFP expression is apparent throughout the entire vasculature, red blood cells (RBC) and macrophages (MF). TgBAC(etv2:GFP) shows similar expression pattern, and also shows non-specific expression in the neural tube. (A-C) Merged mCherry and GFP channels; (D-F) GFP channel; (G,H) magnified images of the trunk region in (A,B). (I) ISH analysis for etv2 mRNA expression at 24 hpf. DA, dorsal aorta; PCV, posterior cardinal vein; ISV, intersegmental vessels.
Strong GFP expression in the entire vasculature continued throughout 2–7 dpf in etv2ci32Gt; UAS:GFP and TgBAC(etv2:GFP) embryos (Fig. 5,6) and was also apparent in the tail fin vasculature of adult fish (data not shown). Both lines also showed GFP expression in the lymphatic vasculature (Fig. 6). We have previously reported similar although weaker etv2 mRNA expression in the vasculature at 2–2.5 dpf (Davis et al., 2018). Although endogenous etv2 expression in most blood vessels was largely not detectable at 3 dpf or later stages (data not shown), it is challenging to detect expression using whole-mount in situ hybridization in older embryos due to the limited probe penetration (see Discussion). In contrast, vascular endothelial specific expression in Tg(−2.3 etv2:GFP) line was downregulated between 48–72 hpf, while non-specific GFP expression in epithelial cells and a subset of neurons was apparent (Fig. 6). Endothelial expression was very weak or not apparent in this line at 5 dpf or later stages (data not shown). Overall, etv2ci32Gt; UAS:GFP heterozygous embryos and adults were morphologically normal and did not have any apparent phenotypic defects.
Figure 5.
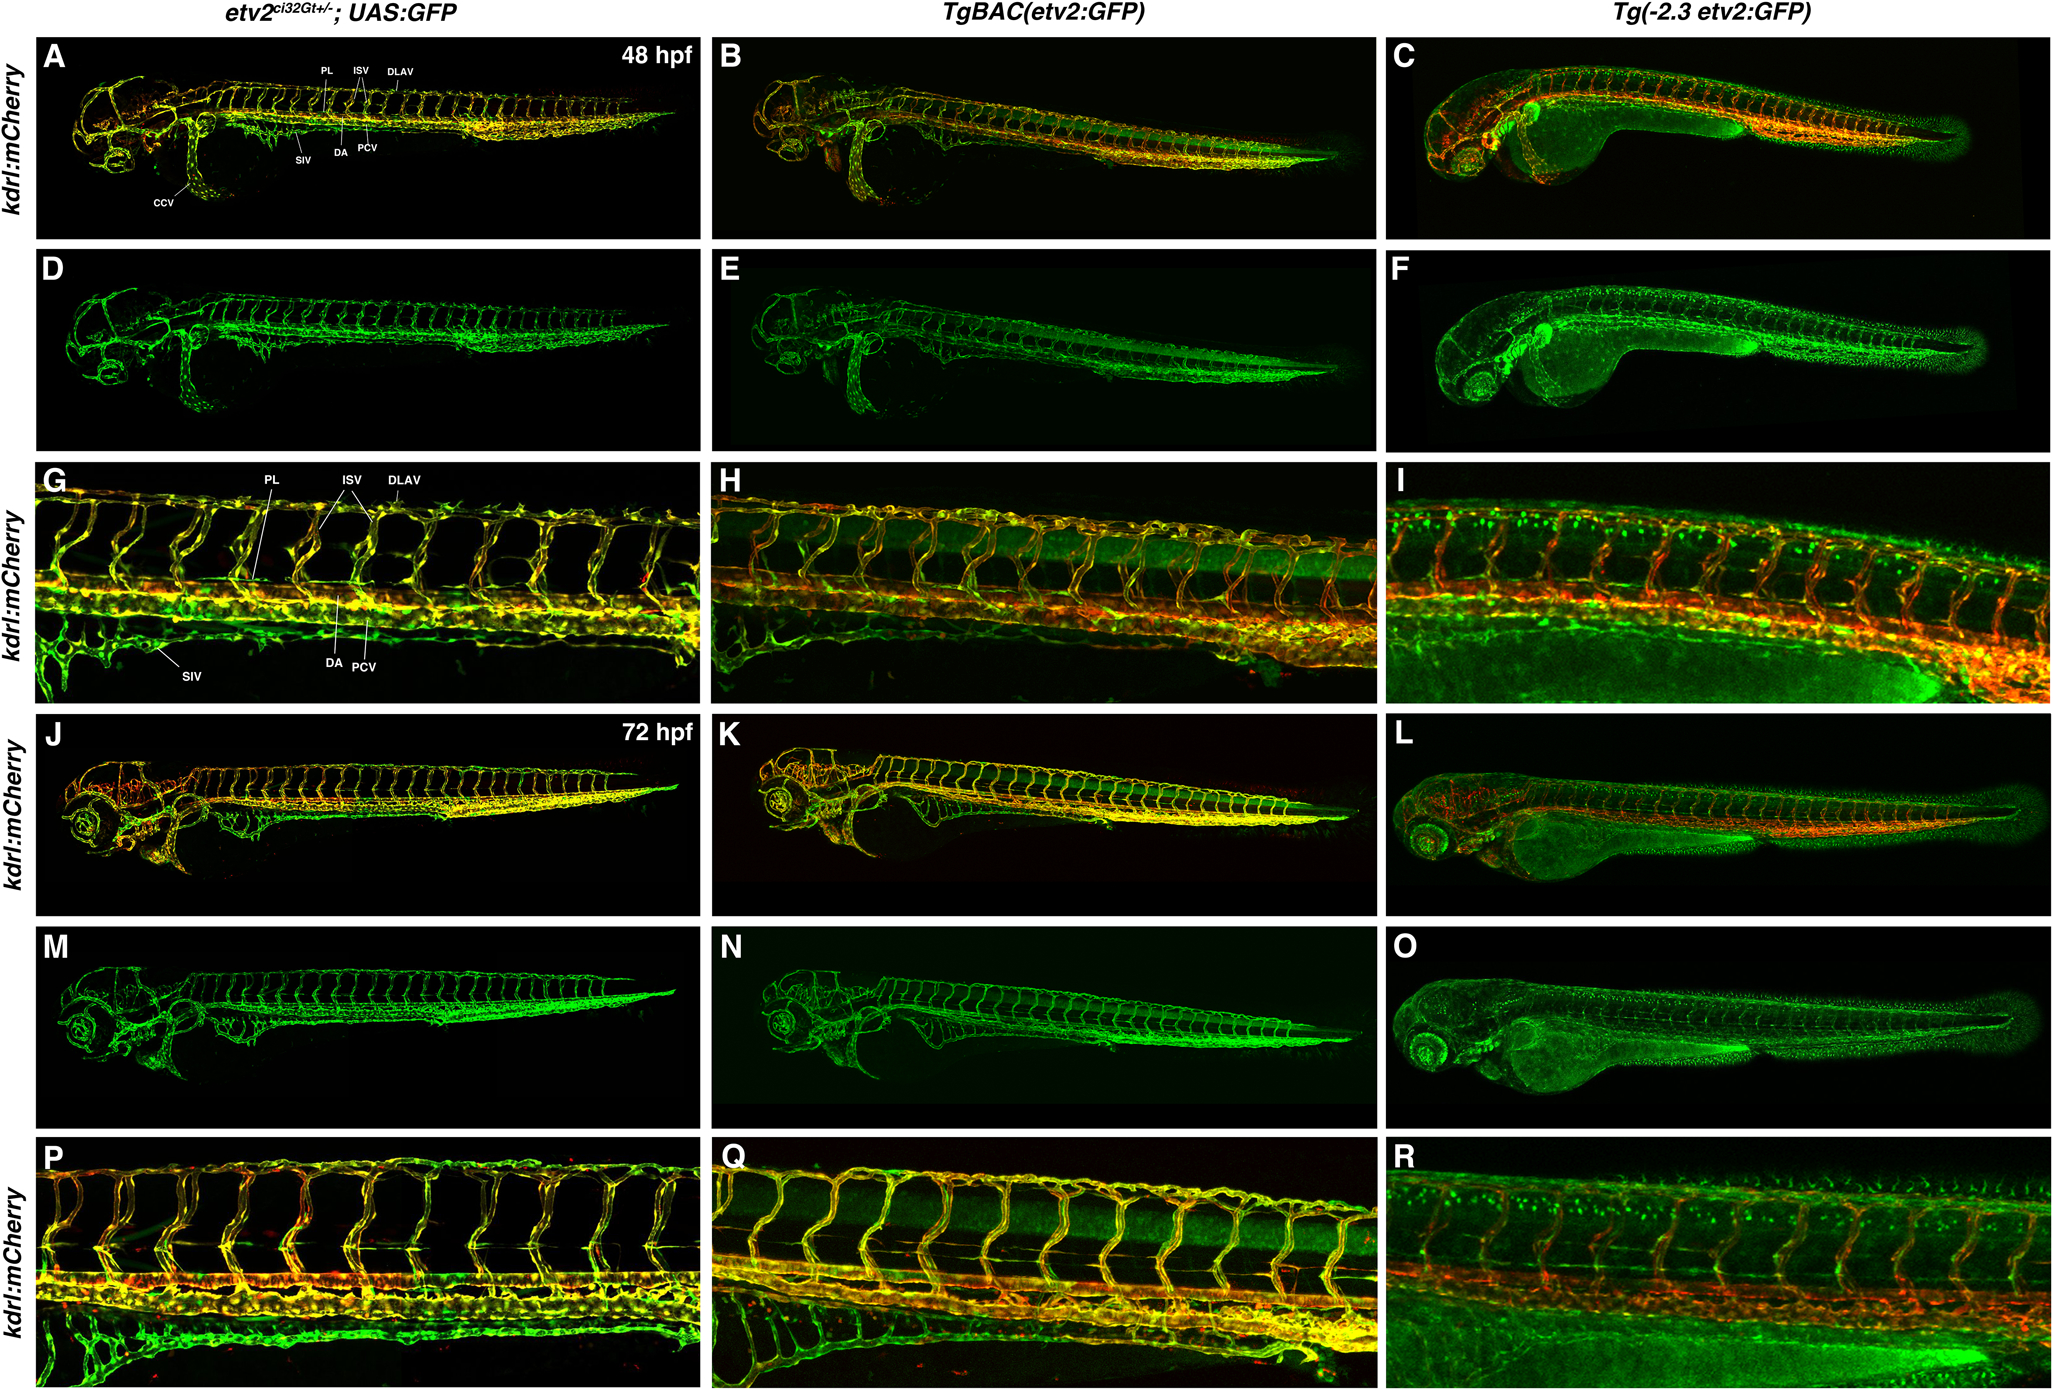
A comparison of etv2ci32Gt+/−; UAS:GFP, TgBAC(etv2:GFP), Tg(−2.3etv2:GFP) fluorescence pattern (in kdrl:mCherry background) at 48 hpf (A-I) and 72 hpf (J-R). etv2ci32Gt+/−; UAS:GFP expression is apparent throughout the entire vasculature and in lymphatic progenitors (parachordal lymphangioblasts, PLs). TgBAC(etv2:GFP) shows similar expression pattern, and also shows non-specific expression in the neural tube. Vascular endothelial expression in Tg(−2.3etv2:GFP) line is downregulated after 48 hpf and is very weak at 72 hpf, while non-specific epithelial expression is apparent. (A-C, J-L) Merged mCherry and GFP channels; (D-F, M-O) GFP channel; (G-I, P-R) magnified images of the trunk region in (A-C, J-L). DA, dorsal aorta; PCV, posterior cardinal vein; ISV, intersegmental vessels, SIV, subintestinal vessel; DLAV, dorsal longitudinal anastomotic vessel; CCV, common cardinal vein.
Figure 6.
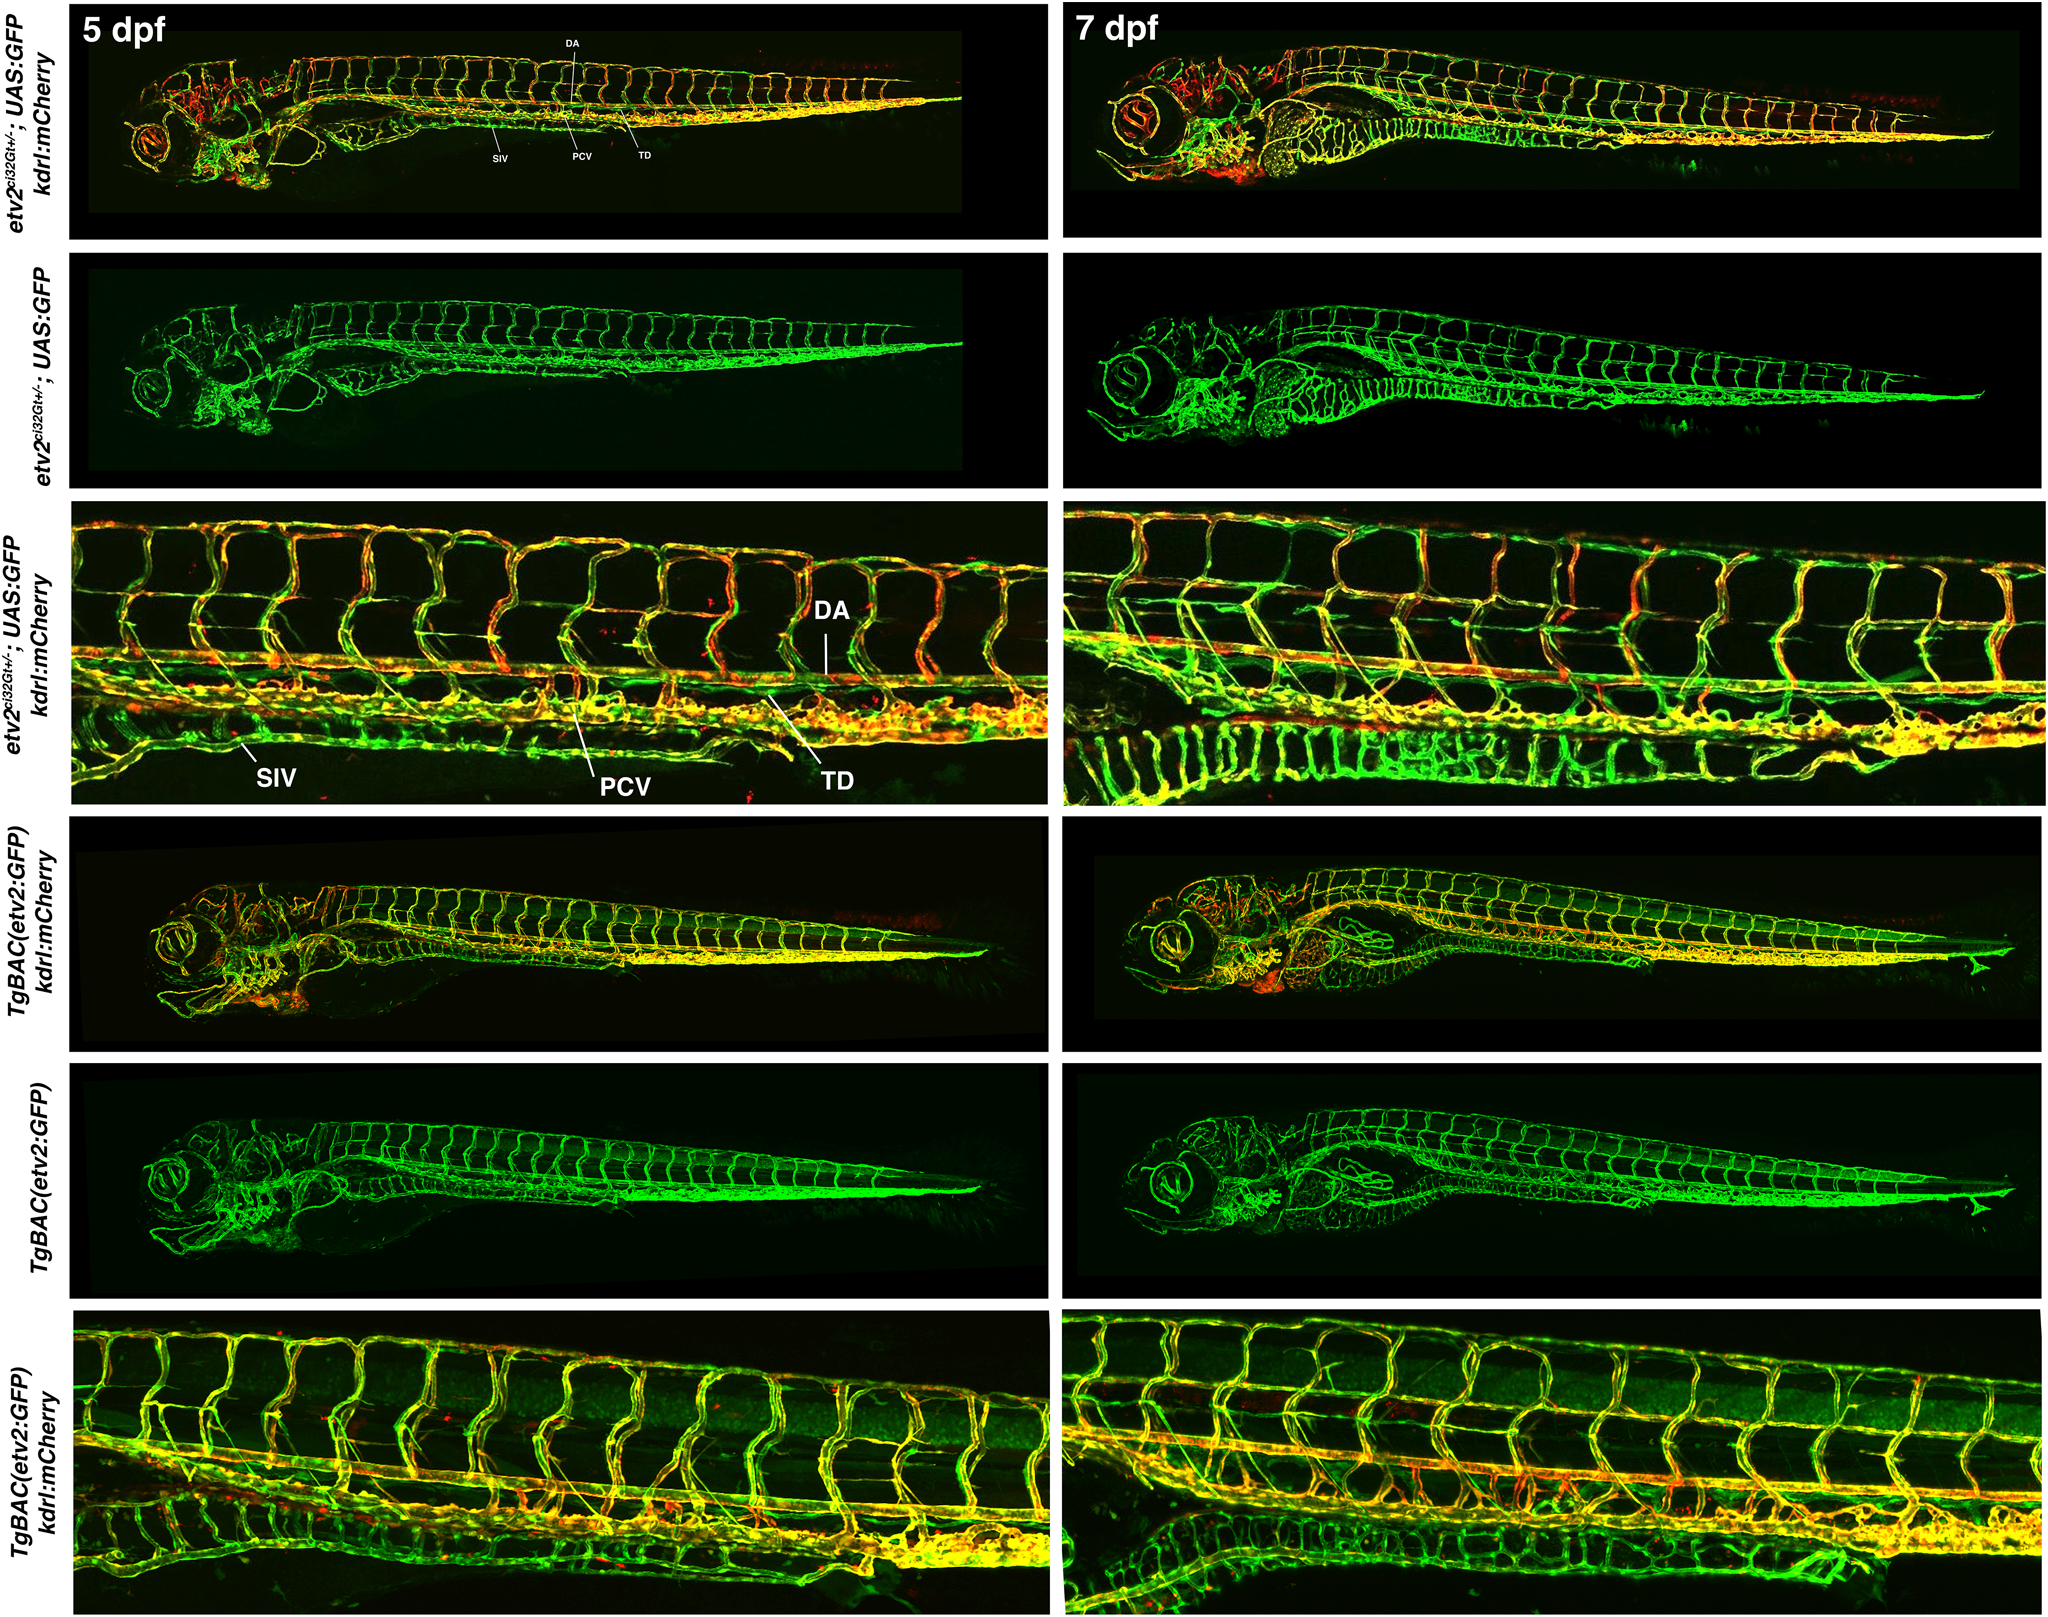
A comparison of etv2ci32Gt+/−; UAS:GFP and TgBAC(etv2:GFP) embryos in kdrl:mCherry background at 5 and 7 dpf. Both lines show GFP expression in the entire vasculature and lymphatics. DA, dorsal aorta; PCV, posterior cardinal vein; SIV, subintestinal vein (thoracic duct, TD). Tg (−2.3etv2:GFP) line did not show vascular endothelial expression at these stages.
etv2ci32Gt; UAS:GFP homozygous embryos show vascular defects.
We then examined GFP expression in etv2ci32Gt; UAS:GFP homozygous embryos which were expected to show the phenotype, associated with the loss of etv2 function. As expected, etv2 expression was nearly completely absent in etv2ci32Gt−/− embryos as analyzed by in situ hybridization at the 20-somite and 24 hpf stages (Fig. 7). Initiation of GFP expression in vascular and hematopoietic progenitors at or prior to the 10-somite stage did not appear to be affected in etv2ci32Gt; UAS:GFP homozygous embryos (data not shown). However, GFP-positive putative vascular progenitors failed to migrate from the lateral plate mesoderm to the midline and did not coalesce into vascular cords at 14–22-somite stages (Fig. 8A,E, and data not shown). No intersegmental vessels (ISVs) were apparent at 24 hpf in etv2ci32Gt homozygous embryos, although some ISV sprouts did emerge between 48–72 hpf (Fig. 8). These sprouts did not extend all the way and were misguided. Intriguingly, vascular defects in etv2ci32Gt homozygous embryos between 48–72 hpf appeared more severe compared to the previously described etv2y11 allele and the etv2 MO knockdown phenotype (Sumanas and Lin, 2006; Pham et al., 2007). Aside from these vascular defects, both etv2ci32Gt+/− and etv2ci32Gt−/− embryos appeared morphologically normal when analyzed using brightfield microscopy (Fig. 9).
Figure 7.
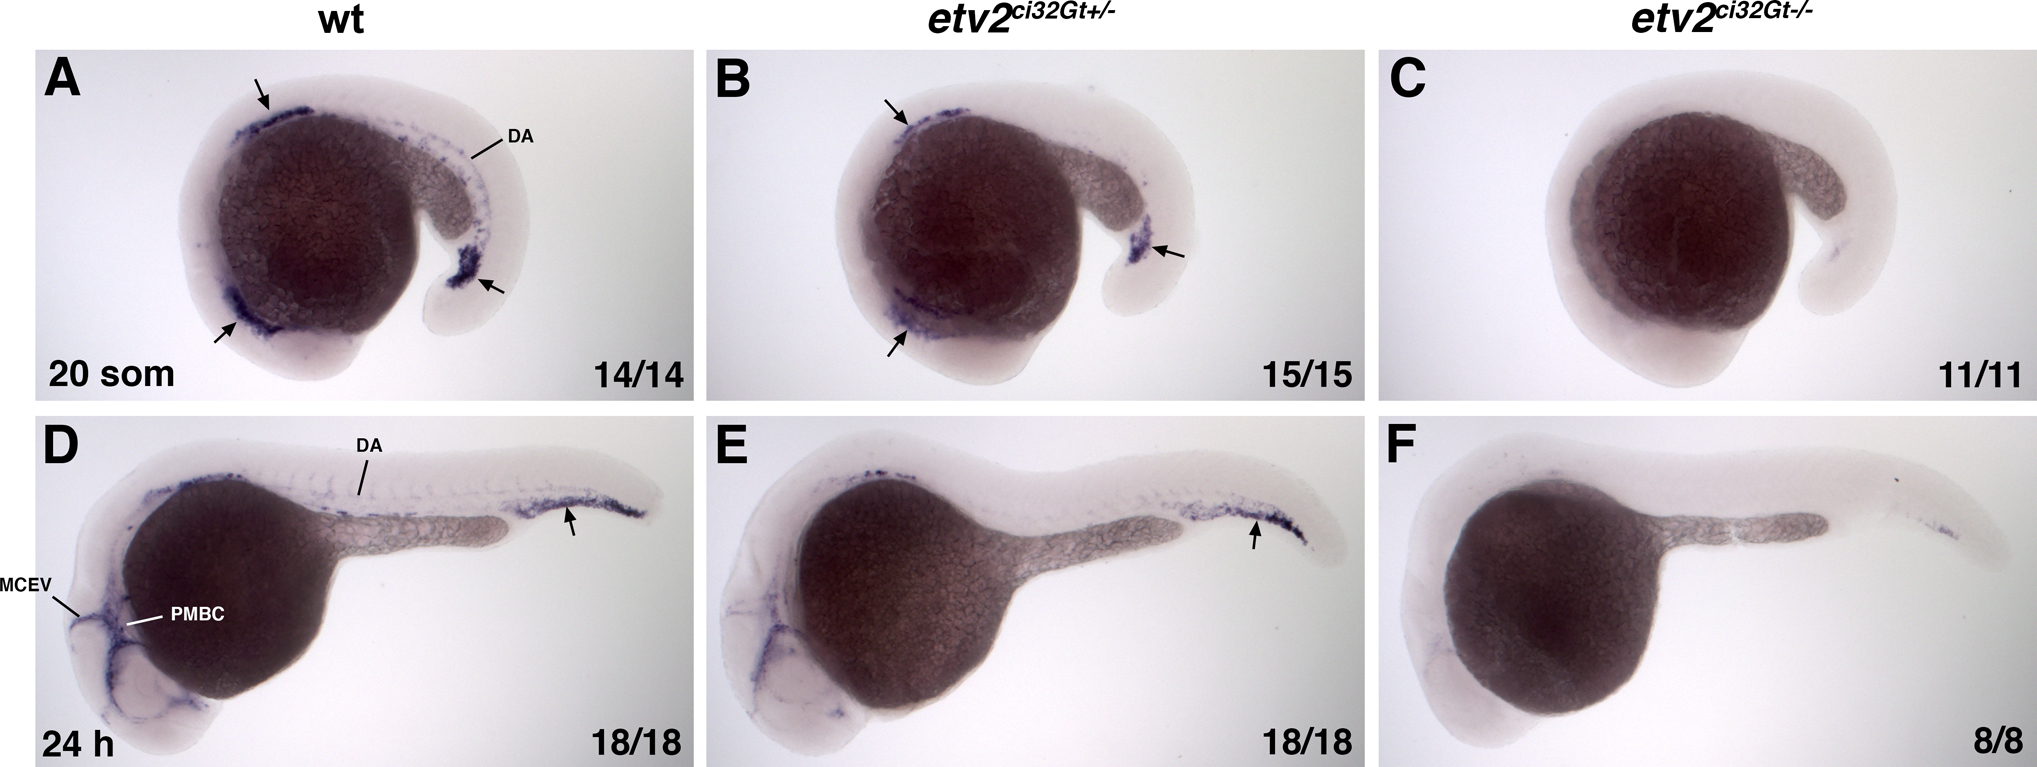
etv2 expression analysis in wild-type, etv2ci32G+−/− and etv2ci32Gt−/− embryos at the 20-somite (A-C) and 24 hpf stages (D-F). Embryos were obtained from an incross of etv2ci32Gt+/−; UAS:GFP+/+ parents and sorted based on their GFP fluorescence pattern. Antisense etv2 RNA probe which corresponds to the C-terminal portion of the etv2 coding sequence and 3’UTR downstream of the Gal4 insertion side was used for in situ hybridization (see Experimental Procedures). (A-C) In non-fluorescent wild-type siblings (wt), strong etv2 expression is apparent in vascular progenitors in the anterior lateral plate mesoderm, presumptive progenitors of the anterior and common cardinal veins, and in vascular progenitors next to the tailbud (arrows). Weaker expression in the dorsal aorta (DA) is also apparent. Note the reduced etv2 expression in etv2ci32Gt+/− embryos and nearly absent expression in etv2ci32Gt−/− embryos. (D-F) In wild-type siblings, strong etv2 expression is apparent in the cranial venous vasculature, including the primordial midbrain channel (PMBC) and the middle cerebral vein (MCEV), as well as the tail plexus region (arrow). Weaker expression in the DA is also apparent. Note the reduced etv2 expression in etv2ci32Gt+/− embryos and nearly absent expression in etv2ci32Gt−/− embryos.
Figure 8.
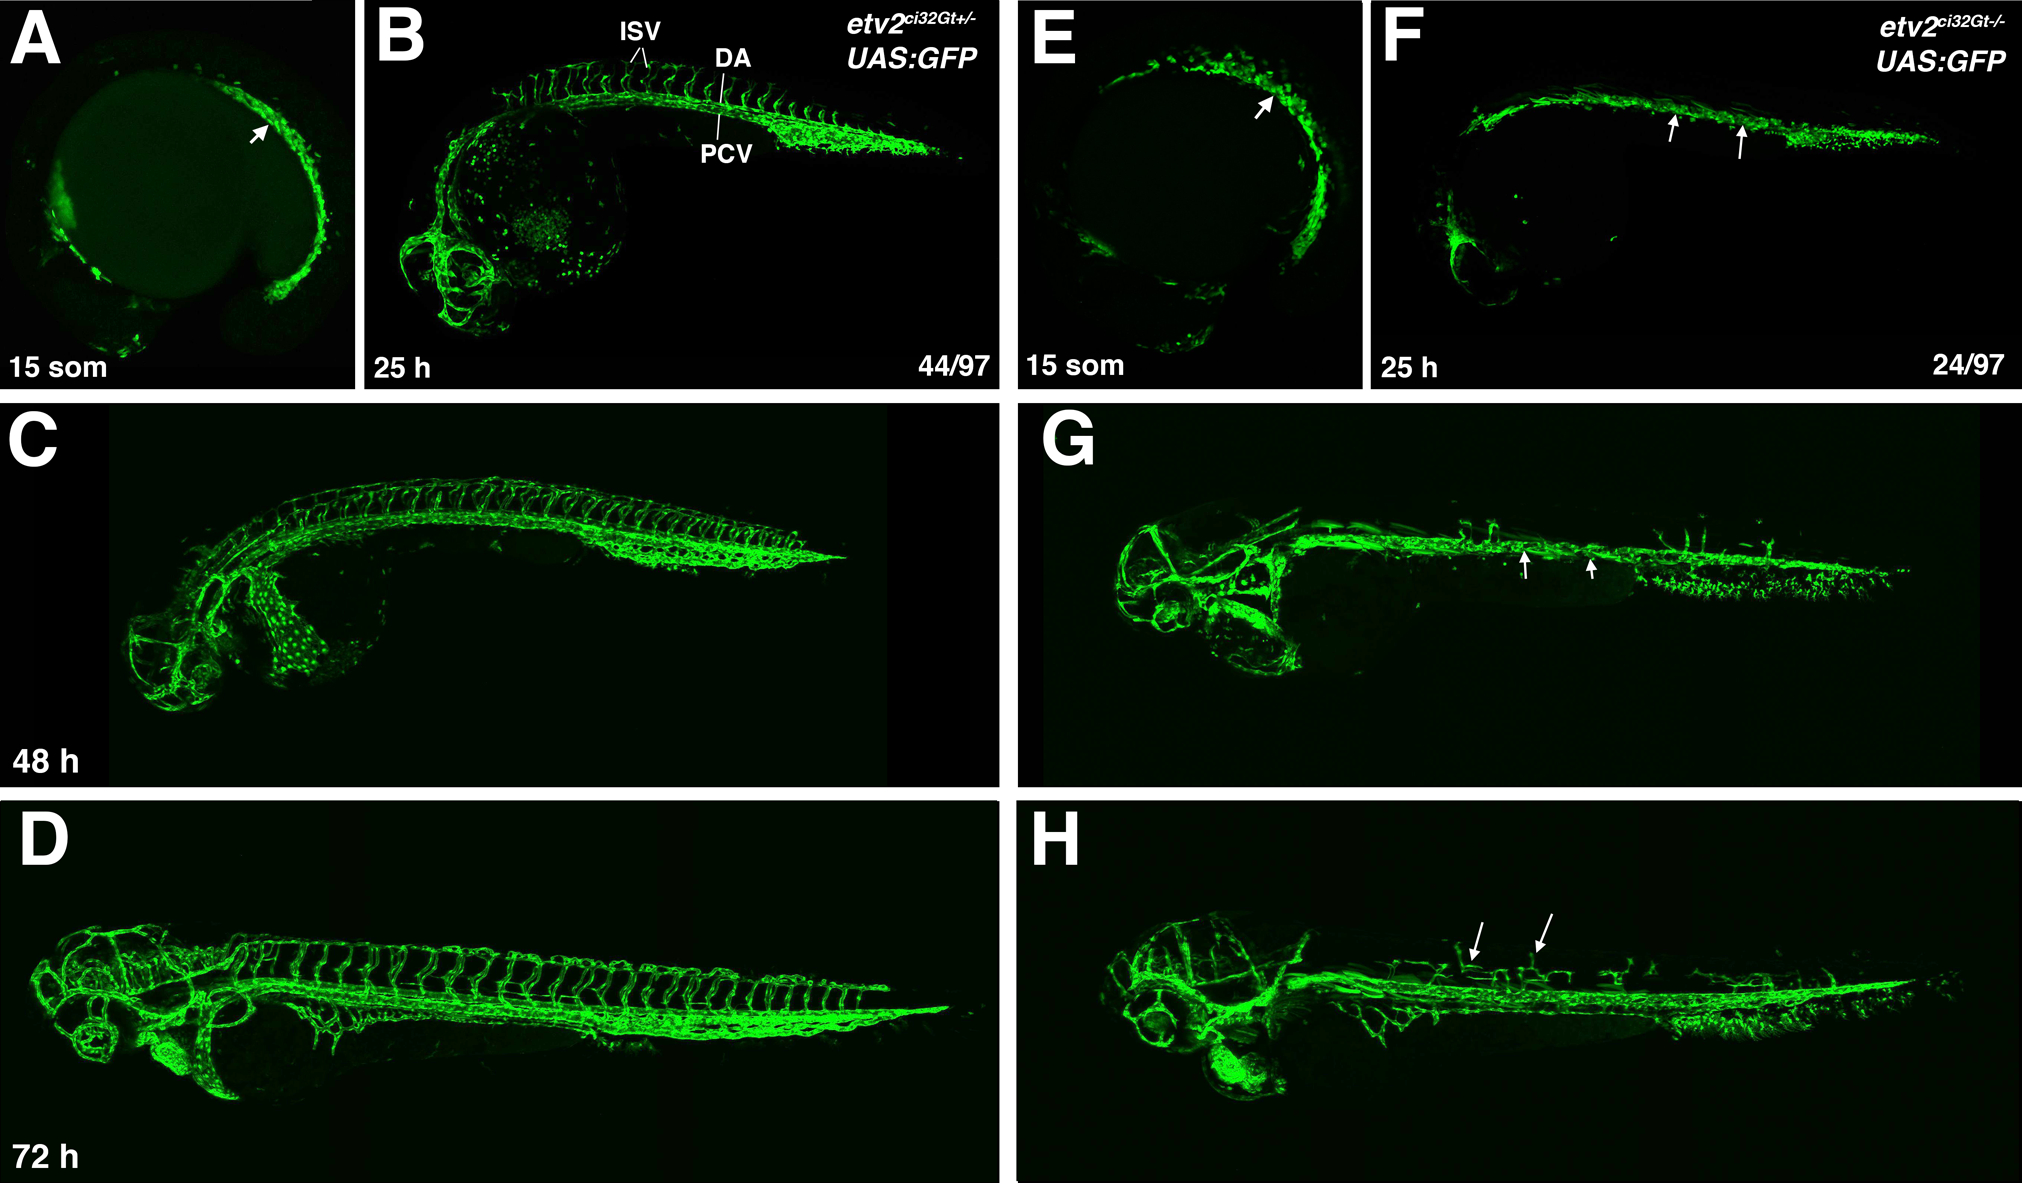
A comparison of vascular development in heterozygous etv2ci32Gt+/−; UAS:GFP and homozygous etv2ci32Gt−/−; UAS:GFP embryos. GFP expression is apparent in vascular progenitors of the trunk axial vasculature (arrow, A) in etv2ci32Gt+/−; UAS:GFP embryos. This domain is broader and disorganized in etv2ci32Gt−/−; UAS:GFP embryos (E). Vascular progenitors fail to coalesce into vascular cords in etv2ci32Gt−/−; UAS:GFP embryos at 25 hpf (arrows, F, compare with C). Intersegmental vessels (ISVs) are absent in etv2ci32Gt−/−; UAS:GFP embryos between 25–48 hpf (F,G). Some ISV sprouts are apparent at 72 hpf but are shorter and mispatterned (H, arrows).
Figure 9.
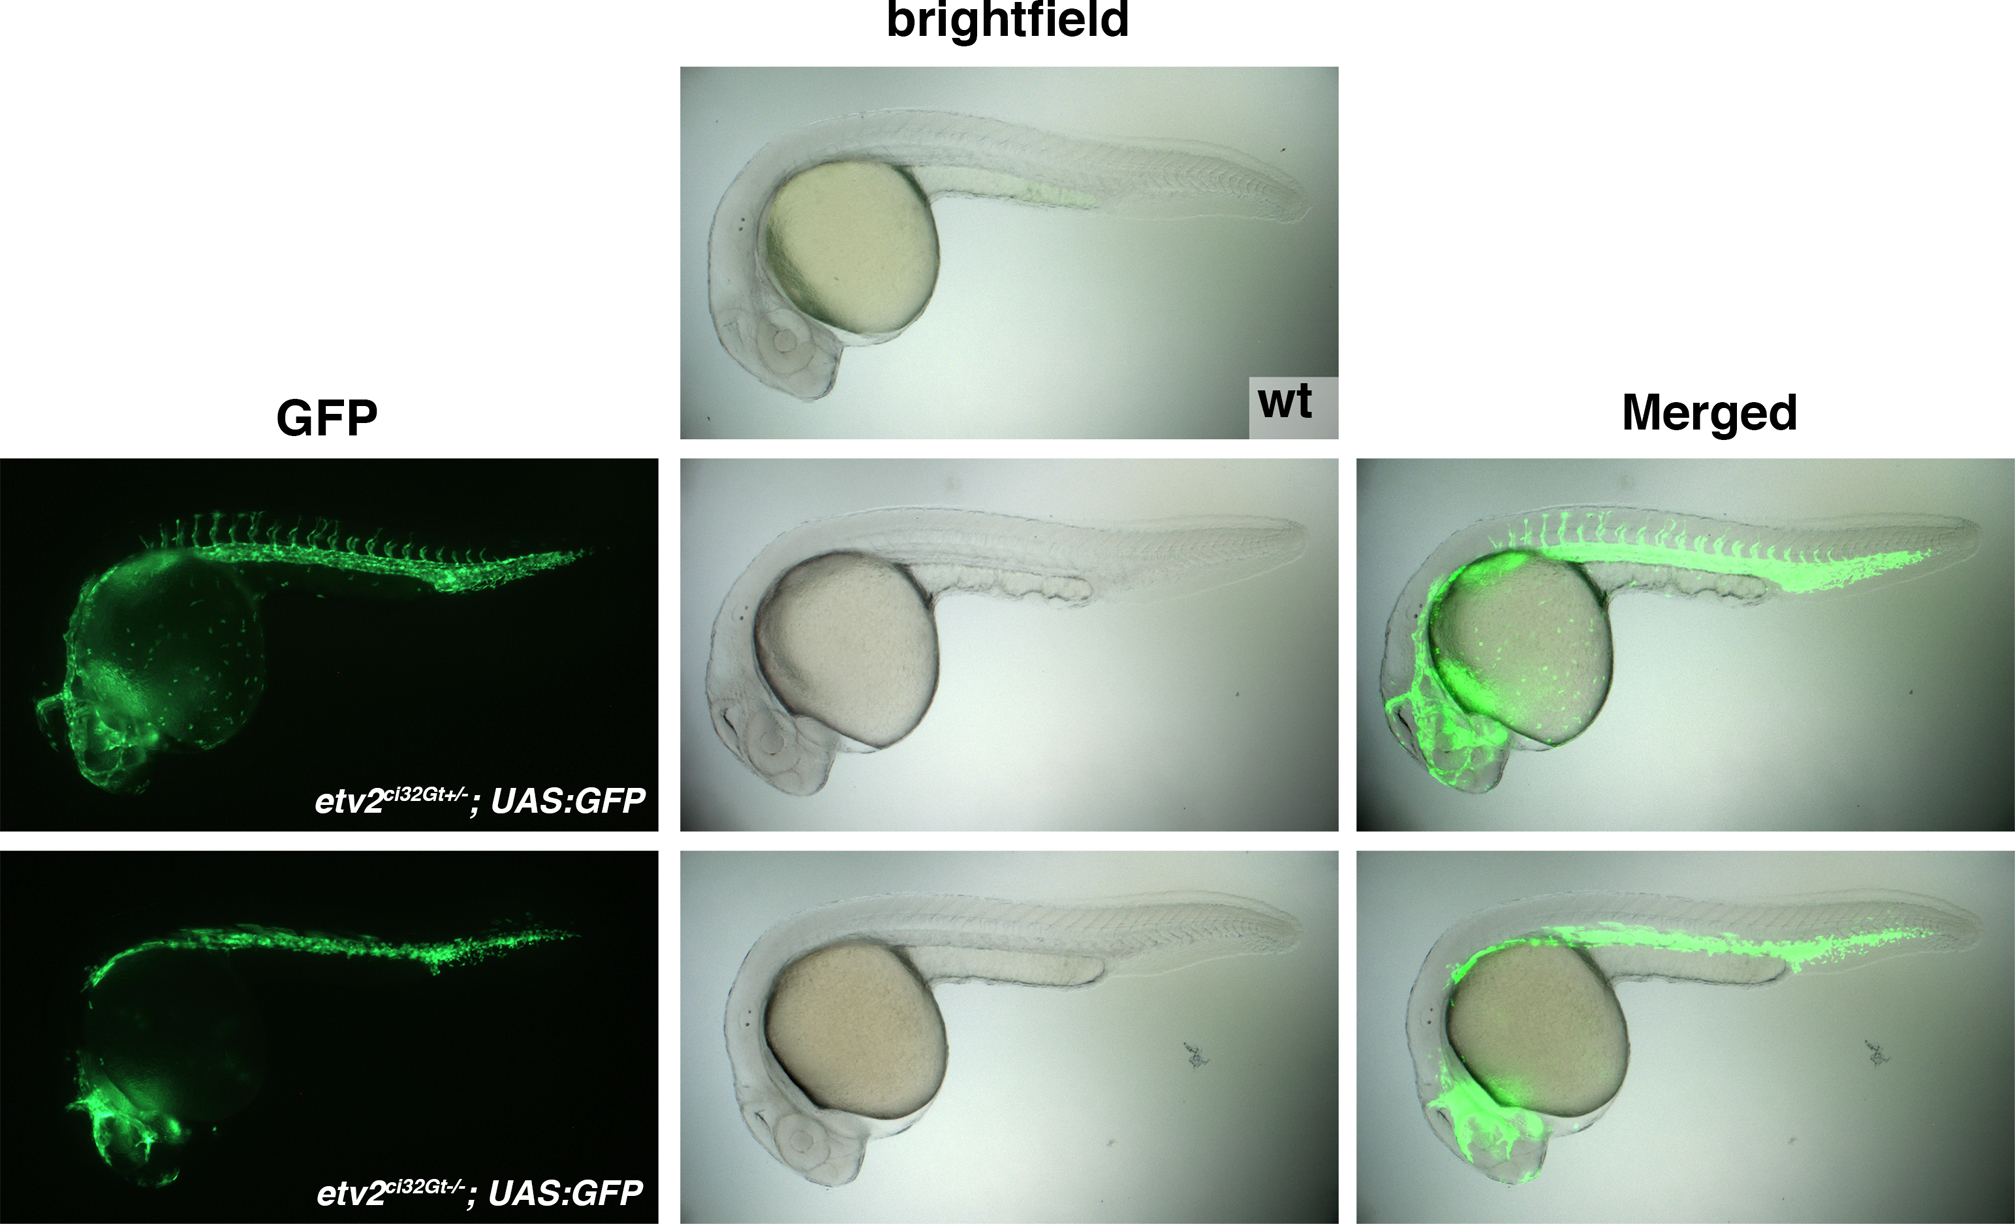
Brightfield and fluorescent images of etv2ci32Gt+/− and etv2ci32Gt−/− embryos and their non-fluorescent wild-type siblings at 24 hpf. No morphological defects are apparent in the brightfield images of etv2ci32Gt+/− and etv2ci32Gt−/− embryos.
In addition to GFP expression in vascular progenitors, GFP expression in multiple skeletal muscle cells was observed in etv2ci32Gt homozygous embryos at the 20-somite and later stages (Fig. 8F,G, and data not shown). A few cells positive for muscle-specific GFP expression were also observed in etv2ci32Gt heterozygous embryos. This expression may be caused by the transdifferentiation of multipotent vascular progenitors into skeletal muscle in the absence of etv2 function, and will be explored in detail in a separate study (Chestnut et al, in review).
Transcriptome analysis in etv2ci32Gt embryos.
To characterize changes in RNA transcriptome observed in etv2ci32Gt homozygous embryos, we performed bulk RNA-seq analysis of etv2ci32Gt heterozygous and homozygous embryos at the 15-somite and 24 hpf stages. Differential expression analysis detected 489 genes downregulated greater than two-fold in etv2ci32Gt homozygous embryos at the 15-somite stage, and 170 genes downregulated greater than two-fold at 24 hpf (Table 1,2). This included many known vascular endothelial specific genes such as gpr182, mrc1a, atgr2, aqp8a.1, lyve1b, stab2 and others, which have been previously shown to be regulated by etv2 expression (Gomez et al., 2009; Wong et al., 2009). In addition, multiple myeloid specific markers including ncf1, mmp13a, sla1a, srgn, mpx and mfap4 were greatly downregulated in etv2ci32Gt homozygous embryos (Table 1,2). Downregulated vascular endothelial and myeloid markers were identified at both 15-somite and 24 hpf stages, and there was a significant overlap between affected genes at both stages. Overall, vascular endothelial genes showed greater downregulation at the 15-somite change, compared to 24 hpf. For example, cdh5 expression in etv2ci32Gt embryos was downregulated 27.1-fold at the 15-somite stage, and 2.4-fold at 24 hpf, while kdr was down 7.2 and 4.4-fold, and fli1a was down 2.1 and 1.3-fold, respectively. Downregulation of vascular endothelial and myeloid markers is consistent with the previously established etv2 roles in vasculogenesis and myelopoiesis (Sumanas and Lin, 2006; Sumanas et al., 2008). etv2 mutants undergo partial recovery of vascular development at 24 hpf and later stages (Craig et al., 2015), therefore changes in gene expression are less pronounced at 24 hpf compared to the 15-somite stage. In addition to these established markers, multiple previously uncharacterized genes were downregulated in etv2ci32Gt heterozygous embryos, suggesting that they may also exhibit vascular endothelial or myeloid expression. A complete list of downregulated and upregulated genes is provided in Suppl. Tables S1 and S2. Further experiments will be required to analyze their expression patterns and functional roles.
Table 1.
Top 50 downregulated genes in etv2ci32Gt homozygous embryos compared to etv2ci32Gt heterozygous embryos at the 15-somite stage and their reported expression patterns.
| Gene Symbol | Fold change | p | Expression pattern |
|---|---|---|---|
| gpr182 | −82.52 | 4.95E-04 | endothelial |
| mrc1a | −62.69 | 1.36E-03 | endothelial |
| agtr2 | −62.49 | 2.23E-05 | endothelial |
| ncf1 | −47.43 | 5.26E-06 | macrophage, neutrophil |
| mmp13a | −40.14 | 2.13E-04 | macrophage |
| flt1 | −37.79 | 2.36E-03 | endothelial |
| zgc:66382 | −34.46 | 4.76E-03 | exocrine pancreas |
| CABZ01018247.1 (pecam1) | −27.82 | 2.65E-06 | endothelial |
| cdh5 | −27.12 | 2.20E-03 | endothelial |
| clec14a | −26.57 | 1.87E-05 | endothelial |
| scarf1 | −21.96 | 1.49E-05 | endothelial |
| tie1 | −21.80 | 5.42E-05 | endothelial |
| si:zfos-1697h8.1 | −19.97 | 8.50E-05 | unknown |
| RASIP1 | −18.60 | 2.94E-05 | endothelial |
| CD93 | −17.85 | 2.91E-04 | endothelial |
| sla1a | −14.36 | 1.12E-03 | macrophage |
| myct1a | −13.88 | 1.33E-02 | endothelial |
| shank3b | −13.41 | 1.67E-04 | brain |
| cldn5b | −12.99 | 6.83E-04 | endothelial |
| INPP5D | −11.35 | 9.24E-03 | neutrophil |
| sox7 | −9.97 | 2.45E-05 | endothelial |
| erg | −9.92 | 1.13E-04 | endothelial |
| zgc:171534 | −9.82 | 1.39E-02 | unknown |
| si:dkey-80c24.1 | −9.63 | 1.87E-03 | unknown |
| samsn1a | −9.48 | 7.95E-03 | blood, macrophage |
| epdl2 | −9.02 | 3.64E-02 | unknown |
| dusp5 | −8.63 | 4.65E-04 | endothelial |
| tagap | −8.57 | 2.64E-02 | endothelial |
| KLHL4 | −8.49 | 1.28E-02 | endothelial |
| pde6c | −8.47 | 1.96E-02 | retina |
| PTPN6 | −7.90 | 5.62E-03 | macrophage |
| timd4 | −7.54 | 1.01E-02 | unknown |
| sod3a | −7.46 | 3.96E-03 | ubiquitous |
| CABZ01086927.1 | −7.36 | 5.41E-04 | unknown |
| kdr | −7.18 | 1.56E-03 | endothelial |
| etv2 | −7.09 | 5.65E-06 | endothelial |
| ARHGEF9 (1 of 3) | −7.09 | 2.15E-02 | endothelial |
| comtd1 | −6.85 | 1.08E-02 | liver, oligodendrocyte |
| CABZ01007930.1 (cldn34a) | −6.85 | 4.85E-02 | unknown |
| sele | −6.84 | 6.76E-04 | endothelial |
| GOLT1A | −6.63 | 1.49E-02 | unknown |
| si:ch73–248e21.5 | −6.56 | 4.29E-02 | unknown |
| arhgef9b | −6.16 | 2.25E-04 | endothelial |
| plbd1 | −6.15 | 2.37E-03 | yolk syncytial layer |
| si:dkey-241l7.2 (REG4) | −5.99 | 4.01E-02 | unknown |
| akr1a1a | −5.91 | 4.86E-03 | ubiquitous |
| ITGB2 | −5.79 | 8.11E-03 | unknown |
| pcxb | −5.79 | 4.43E-03 | ubiquitous |
| aqp8a.1 | −5.66 | 1.00E-04 | endothelial |
| cxcr3.2 | −5.51 | 2.69E-03 | macrophage |
Table 2.
Top 50 downregulated genes in etv2ci32Gt homozygous embryos compared to etv2ci32Gt heterozygous embryos at 24 hpf stage and their reported expression patterns.
| Gene Symbol | FC | p | Expression pattern |
|---|---|---|---|
| aqp8a.1 | −83.83 | 2.39E-04 | endothelial |
| mfap4 | −31.63 | 1.78E-03 | macrophage |
| samsn1a | −24.75 | 3.67E-04 | blood / macrophage |
| lyve1b | −21.35 | 1.55E-02 | endothelial |
| il13ra2 | −20.19 | 1.20E-03 | endothelial |
| srgn | −19.58 | 1.09E-03 | neutrophil |
| MFAP4 (13 of 13) | −16.22 | 4.61E-03 | macrophage |
| slc22a7b | −14.61 | 2.53E-03 | unknown |
| MFAP4 (4 of 13) | −14.48 | 5.21E-03 | macrophage |
| mpx | −12.55 | 2.01E-02 | neutrophil |
| ITGAE | −11.78 | 4.21E-03 | unknown |
| havcr1 | −9.40 | 5.90E-03 | macrophage |
| mrc1a | −9.28 | 2.14E-04 | endothelial |
| grap2b | −9.22 | 2.47E-02 | macrophage (likely) |
| spi1l | −9.11 | 3.91E-03 | macrophage, neutrophil |
| etv2 | −8.88 | 2.39E-04 | endothelial |
| stab2 | −8.63 | 1.97E-06 | endothelial |
| notchl | −8.61 | 2.73E-02 | unknown |
| si:dkey-207j16.5 | −8.40 | 1.66E-02 | unknown |
| ncf1 | −8.35 | 1.06E-02 | macrophage, neutrophil |
| gpr182 | −8.08 | 7.88E-05 | endothelial |
| ppp1r18 | −7.91 | 2.15E-02 | unknown |
| cxcr3.2 | −7.80 | 9.22E-04 | macrophage |
| vsg1 | −7.63 | 4.94E-06 | endothelial |
| tie1 | −7.51 | 4.01E-04 | endothelial |
| lyz | −7.48 | 1.26E-04 | macrophage, neutrophil |
| CR384059.1 | −7.28 | 9.30E-03 | unknown |
| flt1 | −6.94 | 2.75E-04 | endothelial |
| fgd5b | −6.46 | 1.93E-02 | unknown |
| cldn5b | −6.34 | 5.42E-05 | endothelial |
| ANPEP (5 of 5) | −6.32 | 1.40E-02 | unknown |
| csf1rb | −6.15 | 1.72E-02 | microglial |
| CABZ01018247.1 (pecam1) | −5.99 | 1.38E-03 | endothelial |
| dennd2db | −5.91 | 4.83E-02 | ubiquitous |
| CD93 | −5.79 | 1.19E-03 | endothelial |
| erg | −5.61 | 3.07E-04 | endothelial |
| si:ch211–145b13.6 | −5.47 | 3.38E-02 | unknown |
| si:ch211–13o20.1 | −5.31 | 4.54E-03 | unknown |
| irf8 | −5.31 | 7.25E-03 | macrophage |
| tie2 | −5.14 | 1.13E-06 | endothelial |
| vtg3 | −4.97 | 1.62E-03 | multiple tissues |
| CU463231.1 | −4.77 | 2.87E-02 | unknown |
| zgc:66382 | −4.67 | 2.55E-02 | exocrine pancreas |
| si:ch211–149k23.9 | −4.51 | 1.74E-02 | unknown |
| kdr | −4.45 | 2.23E-04 | endothelial |
| si:ch211–278p9.4 | −4.09 | 1.65E-02 | unknown |
| zp2l1 | −3.93 | 4.37E-02 | unknown |
| CCM2L | −3.81 | 2.10E-02 | endothelial |
| cybb | −3.77 | 2.29E-03 | neutrophil |
| micall2a | −3.74 | 1.33E-03 | endothelial |
We then performed gene enrichment ontology (GO) analysis on downregulated and upregulated genes in etv2ci32Gt−/− embryos. Significantly changed GO terms of downregulated genes at both 15-somite stages and 24 hpf included ‘blood vessel development’, ‘blood vessel morphogenesis’ and ‘vasculature development’ (Tables 3 and 4). Several additional GO terms associated with hematopoietic and vascular development, such as ‘angiogenesis’, ‘hemangioblast cell differentiation’, ‘wound healing’ and ‘vasculogenesis’ were enriched in the dataset from the 15-somite stage embryos. In addition, GO terms commonly associated with the functions of vascular endothelial cells, including ‘blood coagulation’, ‘hemostasis’, ‘platelet activation’ were apparent from GO analysis at the 15-somite stage. Additional terms associated with vascular endothelial signaling or immunity including ‘angiotensin type II receptor pathway, ‘G-protein coupled peptide receptor pathway’, ‘leukocyte migration’ were associated with the genes downregulated at 24 hpf. In contrast, no GO terms were significantly enriched in upregulated genes at either 15-somite or 24 hpf stages in etv2ci32Gt embryos. In addition, there was little overlap between upregulated genes at both stages (Suppl. Table S1 and S2), therefore the significance of upregulated genes is currently unclear.
Table 3.
Gene ontology (GO) term enrichment analysis using downregulated genes in etv2ci32Gt−/− embryos at the 15-somite stage.
| GO ACCESSION | GO Term | corrected p-value |
|---|---|---|
| GO:0008150|GO:0000004|GO:0007582 | biological_process | 8.26E-14 |
| GO:0055114 | oxidation-reduction process | 2.20E-07 |
| GO:0044699 | single-organism process | 1.12E-06 |
| GO:0050817 | coagulation | 1.12E-06 |
| GO:0070011 | peptidase activity, acting on L-amino acid peptides | 1.12E-06 |
| GO:0007596 | blood coagulation | 1.12E-06 |
| GO:0016491 | oxidoreductase activity | 1.12E-06 |
| GO:0008233 | peptidase activity | 1.23E-06 |
| GO:0007599 | hemostasis | 1.34E-06 |
| GO:0003824 | catalytic activity | 2.50E-06 |
| GO:0050878 | regulation of body fluid levels | 2.50E-06 |
| GO:0008234|GO:0004220 | cysteine-type peptidase activity | 3.55E-06 |
| GO:0005576 | extracellular region | 5.13E-06 |
| GO:0006869 | lipid transport | 6.36E-06 |
| GO:0010876 | lipid localization | 7.11E-06 |
| GO:0044710 | single-organism metabolic process | 1.47E-05 |
| GO:0004866 | endopeptidase inhibitor activity | 2.03E-05 |
| GO:0061135 | endopeptidase regulator activity | 2.19E-05 |
| GO:0006508 | proteolysis | 2.56E-05 |
| GO:0010951 | negative regulation of endopeptidase activity | 3.36E-05 |
| GO:0051604 | protein maturation | 3.57E-05 |
| GO:0016485|GO:0051605 | protein processing | 3.57E-05 |
| GO:0052548 | regulation of endopeptidase activity | 4.90E-05 |
| GO:0004857 | enzyme inhibitor activity | 8.22E-05 |
| GO:0030414 | peptidase inhibitor activity | 8.22E-05 |
| GO:0061134 | peptidase regulator activity | 8.87E-05 |
| GO:0005579 | membrane attack complex | 9.72E-05 |
| GO:0010466 | negative regulation of peptidase activity | 1.26E-04 |
| GO:0008152 | metabolic process | 1.26E-04 |
| GO:0051346 | negative regulation of hydrolase activity | 1.67E-04 |
| GO:0052547 | regulation of peptidase activity | 1.67E-04 |
| GO:0016787 | hydrolase activity | 1.76E-04 |
| GO:0030168 | platelet activation | 2.71E-04 |
| GO:0043086 | negative regulation of catalytic activity | 2.87E-04 |
| GO:0044092 | negative regulation of molecular function | 3.92E-04 |
| GO:0001944 | vasculature development | 7.73E-04 |
| GO:0048514 | blood vessel morphogenesis | 8.85E-04 |
| GO:0001568 | blood vessel development | 0.00118 |
| GO:0042060 | wound healing | 0.00226 |
| GO:0016861 | intramolecular oxidoreductase activity, interconverting aldoses and ketoses | 0.00444 |
| GO:0042157 | lipoprotein metabolic process | 0.00448 |
| GO:0044765 | single-organism transport | 0.00553 |
| GO:0005996 | monosaccharide metabolic process | 0.00803 |
| GO:0006044 | N-acetylglucosamine metabolic process | 0.0104 |
| GO:0005577 | fibrinogen complex | 0.0104 |
| GO:0016860 | intramolecular oxidoreductase activity | 0.011 |
| GO:0006810|GO:0015457|GO:0015460 | transport | 0.0111 |
| GO:0051234 | establishment of localization | 0.0143 |
| GO:0005215|GO:0005478 | transporter activity | 0.02478 |
| GO:0019318 | hexose metabolic process | 0.0248 |
| GO:1901605 | alpha-amino acid metabolic process | 0.0262 |
| GO:0006006 | glucose metabolic process | 0.0317 |
| GO:0016853 | isomerase activity | 0.0327 |
| GO:0051179 | localization | 0.0329 |
| GO:0060217 | hemangioblast cell differentiation | 0.0333 |
| GO:0001570 | vasculogenesis | 0.0394 |
| GO:0009611|GO:0002245 | response to wounding | 0.0394 |
| GO:0017171 | serine hydrolase activity | 0.0394 |
| GO:0008236 | serine-type peptidase activity | 0.0394 |
| GO:0030234 | enzyme regulator activity | 0.0424 |
| GO:0005975 | carbohydrate metabolic process | 0.0424 |
| GO:0001525 | angiogenesis | 0.0446 |
| GO:0016638 | oxidoreductase activity, acting on the CH-NH2 group of donors | 0.0461 |
Table 4.
Gene ontology (GO) term enrichment analysis using downregulated genes in etv2ci32Gt−/− embryos at 24 hpf stage.
| GO ACCESSION | GO Term | corrected p-value |
|---|---|---|
| GO:0001568 | blood vessel development | 0.00512 |
| GO:0001944 | vasculature development | 0.00697 |
| GO:0048514 | blood vessel morphogenesis | 0.00697 |
| GO:0004945 | angiotensin type II receptor activity | 0.0118 |
| GO:0001595 | angiotensin receptor activity | 0.0118 |
| GO:0038166 | angiotensin-activated signaling pathway | 0.0118 |
| GO:0050900 | leukocyte migration | 0.028 |
| GO:0005515|GO:0045308 | protein binding | 0.0287 |
| GO:0004872|GO:0019041 | receptor activity | 0.0333 |
| GO:0001653 | peptide receptor activity | 0.0333 |
| GO:0008528 | G-protein coupled peptide receptor activity | 0.0333 |
| GO:0004415 | hyalurononglucosaminidase activity | 0.0346 |
| GO:0004714 | transmembrane receptor protein tyrosine kinase activity | 0.0474 |
| GO:0004553|GO:0016800 | hydrolase activity, hydrolyzing O-glycosyl compounds | 0.0474 |
DISCUSSION
In this study, we have established a novel etv2ci32Gt knock-in reporter line which recapitulates well the endogenous etv2 expression in vascular and hematopoietic progenitor cells. In addition, it enables visualization and study of etv2-deficient cells that would ordinarily express etv2. We demonstrate the utility of this line by performing differential transcriptomic analysis in etv2ci32Gt heterozygous and homozygous embryos, which resulted in identification of multiple novel candidate genes that may function downstream of etv2 during vasculogenesis and myelopoiesis.
Similar to the previously established TgBAC(etv2:GFP) and Tg (−2.3 etv2:GFP) lines (Proulx et al., 2010; Veldman and Lin, 2012), etv2ci32Gt; UAS:GFP line shows GFP expression in vascular endothelial and hematopoietic progenitors. However, it does not show the neural tube expression which was observed in the TgBAC(etv2:GFP) line or the epithelial and neuronal expression observed in Tg(−2.3etv2:GFP) lines suggesting that these expression patterns were caused by either the absence, interruption or gain of certain regulatory enhancer elements in the previous lines. UAS:GFP expression was also significantly brighter compared to the GFP fluorescence in the Tg(−2.3 etv2:GFP) line which was generated by Tol2-mediated transgenesis, suggesting that GFP expression was amplified by the potent transcriptional activator Gal4 binding to multiple UAS sites. While etv2 transcript is known to be downregulated in the vasculature by 24 hpf (Moore et al., 2013; Craig et al., 2015), etv2ci32Gt; UAS:GFP expression was bright and apparent throughout adulthood. Continued GFP fluorescence at 1–2 dpf could be explained by the perdurance of GFP, but this would not explain its persistence at later stages. We have previously reported that continued vascular endothelial etv2 expression at lower levels is still apparent between 1.5–2.5 dpf (Davis et al., 2018). Whole mount in situ hybridization at later stages is typically challenging in zebrafish embryos due to poor probe penetration, therefore it is possible that etv2 continues to be expressed at low levels in the vasculature throughout adulthood, and this low level expression is amplified in etv2ci32Gt; UAS:GFP line. Alternatively, it is possible that the knock-in of this Gal4 construct has interrupted a regulatory element responsible for the downregulation of etv2 at later stages.
Intriguingly, etv2ci32Gt homozygous embryos show more severe vascular defects compared to the previously reported etv2y11 mutants and etv2 MO embryos (Sumanas and Lin, 2006; Pham et al., 2007). Both etv2y11 and MO knockdown embryos show partial recovery of vascular defects between 1–3 dpf stages, due to the functional redundancy with fli1b gene, positioned adjacent to etv2 on the same chromosome (Craig et al., 2015). This recovery is greatly compromised in etv2ci32Gt homozygous embryos, resulting in a more severe phenotype. etv2y11 mutants are predicted to be null, which is supported by the loss of etv2 mRNA expression due to nonsense-mediated RNA decay (NMRD) (Pham et al., 2007). NMRD is likely to trigger a compensatory response (El-Brolosy et al., 2019) in etv2 mutants, which may not be observed in etv2ci32Gt homozygous embryos, thus explaining the difference between these phenotypes. However, etv2 MO embryos recapitulate etv2y11 phenotype very closely, and also show a similar recovery (Craig et al., 2015). An alternative possibility is that Gal4 insertion into the etv2 locus has interrupted expression of a related fli1b gene which is positioned next to etv2 on the same chromosome. Due to the vicinity of etv2 and fli1b in the genome, the two genes are likely to share some regulatory elements. Indeed, fli1b expression is greatly downregulated in etv2ci32Gt−/− embryos based on our RNA-seq analysis (Suppl. Table S1, S2).
RNA-seq analysis confirmed the previously established role of etv2 in vasculogenesis and myelopoiesis. In addition, it identified other novel genes, some of which may function as novel regulators of vascular development or myelopoiesis. Etv2 function is known to be evolutionarily conserved, and mouse Etv2 mutants show loss of endothelial and hematopoietic differentiation (Lee et al., 2008; Ferdous et al., 2009). Whole transcriptome analysis using microarrays has been previously performed in murine Flk1+ cells sorted from Etv2-deficient embryoid bodies (Liu et al., 2012). Most vascular endothelial-specific genes identified in this study, including Cdh5, Esam, Flt1, Tie1, Fli1, Erg, Lmo2 and others were also downregulated in zebrafish mutant embryos. In addition to endothelial defects, mouse Etv2 mutants show loss red blood cell (RBC) differentiation (Lee et al., 2008), and loss of erythroid-specific gene expression was observed in Etv2-deficient embryoid bodies (Liu et al., 2012). In contrast, RBCs are still present in zebrafish etv2-deficient embryos (Sumanas and Lin, 2006), and there was no reduction observed in RBC gene expression based on our RNA-seq analysis. This could reflect differences in the regulation of erythropoiesis between zebrafish and murine embryos, or there may be additional redundancy between different Ets factors during zebrafish erythropoiesis. Upregulation of myocardial genes has been previously observed in etv2-deficient mouse embryoid bodies (Rasmussen et al., 2011; Liu et al., 2012). Although we have previously shown that etv2-deficient cells can differentiate into cardiomyocytes in zebrafish embryos (Palencia-Desai et al., 2011), we did not see significant upregulation of myocardial genes in bulk RNA-seq analysis. It is possible that changes in myocardial expression are relatively small and difficult to detect using bulk RNA-seq analysis.
In summary, the etv2ci32Gt line recapitulates the endogenous etv2 expression during embryogenesis more accurately than previously generated reporter lines and will be a useful tool to study the mechanisms of vasculogenesis. Furthermore, transcriptomic analysis of etv2ci32Gt embryos resulted in a comprehensive list of genes, expressed in vascular endothelial and myeloid cells, a function of which can be further interrogated in the future studies.
EXPERIMENTAL PROCEDURES
Zebrafish lines.
The following zebrafish lines were used in the study: Tg(5xUAS:EGFP) (Asakawa et al., 2008), Tg(−2.3 etv2:GFP)zf372 (Veldman and Lin, 2012), TgBAC(etv2:GFP)ci1 (Proulx et al., 2010), Tg(kdrl:mCherry)ci5 (Proulx et al., 2010). To generate etv2Gt(2A-Gal4)ci32 knock-in line, a targeting construct was made by subcloning the etv2 gRNA-P2A fragment (sequence: gggaaaggcccaagtcacagaggGGAAGCGGAGCTACTAACTTCAGCCTGCTGAAGCAGGCTGGAGACGTGGAGGAGAACCCTGGACCTgtcgacacc, etv2 gRNA sequence is underlined, P2A sequence is in the upper case) into SalI-HindIII sites of the flk1:Gal4VP16–2A-mCherry-pA-Tol2 construct (kindly donated by Drs. Naoki Mochizuki and Chunyue Yin; SalI-HindIII digest excised flk1 promoter which was then replaced by the etv2–2A sequence). DNA fragment corresponding to etv2 sgRNA was subcloned into the T7gRNA expression vector (Jao et al., 2013), which was linearized with BamHI and transcribed with T7 RNA polymerase (Promega). Cas9 mRNA was synthesized from pT3TS-nCas9n vector (Jao et al., 2013) using T3 mMessage mMachine kit (ThermoFisher). A mixture of Cas9 mRNA, etv2 sgRNA and the etv2-Gal4 targeting plasmid was injected into the Tg(5xUAS:GFP) zebrafish embryos at the 1-cell stage. Embryos showing any specific GFP expression were raised through adulthood. Approximately 50–100 adult fish were screened to identify a founder which produced progeny with a specific expression.
Throughout the study, embryos were typically incubated at 28.5 °C, except for the embryonic stages prior to 24 hpf, where embryos were incubated for part of the time at 23.5–24 °C to slow down their development. Embryos were staged using previously established criteria (Kimmel et al., 1995).
Genotyping primers.
Etv2-Gal4 insertion site was confirmed by PCR amplification and Sanger sequencing with the following primers: Etsrp-20-F: CCCCCTTAAGTTCCAGAAGG and
Gal4–1R: TCTTCAGACACTTGGCGCAC (see Fig. 1).
In situ hybridization.
In situ hybridization expression was performed as previously described (Jowett, 1999). Full-length etv2 antisense probe was synthesized as previously described (Sumanas et al., 2005). To synthesize etv2 probe which corresponds to the 3’ portion of etv2 gene (downstream of the Gal4 integration site), a construct containing full-length etv2 cDNA in pSPORT1 was linearized with EciI. Antisense RNA was synthesized using SP6 RNA polymerase (Promega) and digoxygenin (DIG) labeling mix (Roche).
Reporter constructs and GFP fluorescence analysis.
Wild-type etv2–2A-eGFP-pA reporter construct was designed by fusing N-terminal portion of etv2 and 2A-eGFP-pA sequence to recapitulate the insertion site of 2A-Gal4. The sequence was synthesized by Genscript (Piscataway, NJ, USA) and subcloned into the NotI site of pDB739 vector (Balciunas et al., 2006). Mutant variants of this sequence were produced by site-directed mutagenesis performed by Genscript. Wild-type and mutant variant constructs in pDB739 vector were linearized with XbaI, and mRNA was synthesized using SP6 mMessage mMachine Kit (ThermoFisher). 100 pg mRNA was injected at 1-cell stage, and embryos were kept at 23.5 °C overnight. Individual embryos were imaged in GFP channel at the 20-somite stage using AxioCam MRm grayscale camera (Zeiss), 10x objective (NA=0.3) and Axioimager compound fluorescent microscope (Zeiss). All embryos were imaged under the same exposure settings. Fluorescence intensity analysis was performed using Fiji / ImageJ software by choosing three different areas in each embryo along the trunk/tail outside of the yolk region and calculating integrated density. Background fluorescence was subtracted from each measurement. Average fluorescence values for each embryo were then calculated.
Confocal microscopy and image processing.
Embryos were mounted in 0.6% low melting point agarose and imaged using a Nikon A1 confocal microscope at the CCHMC Confocal Imaging Core. Images of embryos older than 1 dpf were obtained by imaging 2–3 embryonic regions separately and stitching individual images with Nikon Elements software. Image levels were adjusted using Adobe Photoshop CS6 to increase the contrast. Acquisition gain and laser intensity settings were adjusted based on the fluorescence intensity of individual embryos, therefore embryos from different reporter lines were not imaged under the same settings.
RNA-seq analysis.
etv2ci32Gt heterozygous and homozygous embryos were obtained from the incross of etv2ci32Gt+/−; UAS:GFP carriers and sorted based on GFP expression pattern. Criteria for selecting etv2ci32Gt−/− embryos included disorganized GFP expression in the trunk region and ectopically located GFP-positive cells positioned within the somites at the 15-somite stage, and the absence of intersegmental vessels at 24 hpf. Genotype of sorted embryos was confirmed by either in situ hybridization analysis for etv2 expression in selected embryos (Fig. 7) or subsequent analysis of RNA-seq results, which showed absence of C-terminal etv2 sequence reads in etv2ci32Gt−/− embryos (data not shown). 3 batches of 15–20 heterozygous and homozygous embryos were frozen at the 15-somite and 24 hpf stages. Bulk RNA was purified using RNA-quous 4-PCR kit (ThermoFisher). Library synthesis and next generation RNA sequencing (20M PE-150 reads) was performed by Novogene, Inc; each stage contained triplicate samples. Sequences were aligned to the Zv9 zebrafish genome, and RNA-seq analysis was performed using Strand 3.0 software package. Gene list was filtered to retain genes which have >10 total reads in all samples in any of the genotypes (heterozygous or homozygous). Additional filtering for p<0.05 was performed for the gene list shown in Tables 1 and 2. GO term analysis was performed using Strand 3.0 with the significance cut off p (adjusted)<0.05.
To analyze Gal4 insertion sites, Next Gen sequence files were opened with Mac TextEdit software, and 2A-Gal4 sequences were identified using the search function. Adjacent upstream sequence was then manually inspected. In all 50 cases analyzed, it perfectly matched the same upstream sequence within the etv2 gene.
RNA-seq files have been uploaded to the NCBI Gene Expression Omnibus (GEO) database and can be located under the accession number GSE139108.
Supplementary Material
Acknowledgements.
This research was supported by the NIH R21 AI128445 and RIP award from Cincinnati Children’s Research Foundation to S.S. We thank Tiffany Duong who was involved in making Etv2-Gal4 targeting construct and Matt Kofron for help with imaging at the CCHMC Confocal Microscopy Core.
REFERENCES
- Asakawa K, Suster ML, Mizusawa K, Nagayoshi S, Kotani T, Urasaki A, Kishimoto Y, Hibi M, Kawakami K. 2008. Genetic dissection of neural circuits by Tol2 transposon-mediated Gal4 gene and enhancer trapping in zebrafish. Proc Natl Acad Sci U S A 105:1255–1260. [DOI] [PMC free article] [PubMed] [Google Scholar]
- Auer TO, Duroure K, De Cian A, Concordet JP, Del Bene F. 2014. Highly efficient CRISPR/Cas9-mediated knock-in in zebrafish by homology-independent DNA repair. Genome Res 24:142–153. [DOI] [PMC free article] [PubMed] [Google Scholar]
- Balciunas D, Wangensteen KJ, Wilber A, Bell J, Geurts A, Sivasubbu S, Wang X, Hackett PB, Largaespada DA, McIvor RS, Ekker SC. 2006. Harnessing a high cargo-capacity transposon for genetic applications in vertebrates. PLoS Genet 2:e169. [DOI] [PMC free article] [PubMed] [Google Scholar]
- Craig MP, Grajevskaja V, Liao HK, Balciuniene J, Ekker SC, Park JS, Essner JJ, Balciunas D, Sumanas S. 2015. Etv2 and fli1b function together as key regulators of vasculogenesis and angiogenesis. Arterioscler Thromb Vasc Biol 35:865–876. [DOI] [PMC free article] [PubMed] [Google Scholar]
- Davis JA, Koenig AL, Lubert A, Chestnut B, Liu F, Palencia Desai S, Winkler T, Pociute K, Choi K, Sumanas S. 2018. ETS transcription factor Etsrp / Etv2 is required for lymphangiogenesis and directly regulates vegfr3 / flt4 expression. Dev Biol 440:40–52. [DOI] [PMC free article] [PubMed] [Google Scholar]
- El-Brolosy MA, Kontarakis Z, Rossi A, Kuenne C, Gunther S, Fukuda N, Kikhi K, Boezio GLM, Takacs CM, Lai SL, Fukuda R, Gerri C, Giraldez AJ, Stainier DYR. 2019. Genetic compensation triggered by mutant mRNA degradation. Nature 568:193–197. [DOI] [PMC free article] [PubMed] [Google Scholar]
- Ferdous A, Caprioli A, Iacovino M, Martin CM, Morris J, Richardson JA, Latif S, Hammer RE, Harvey RP, Olson EN, Kyba M, Garry DJ. 2009. Nkx2–5 transactivates the Ets-related protein 71 gene and specifies an endothelial/endocardial fate in the developing embryo. Proc Natl Acad Sci U S A 106:814–819. [DOI] [PMC free article] [PubMed] [Google Scholar]
- Gomez GA, Veldman MB, Zhao Y, Burgess S, Lin S. 2009. Discovery and characterization of novel vascular and hematopoietic genes downstream of etsrp in zebrafish. PLoS One 4:e4994. [DOI] [PMC free article] [PubMed] [Google Scholar]
- Hoshijima K, Jurynec MJ, Grunwald DJ. 2016. Precise Editing of the Zebrafish Genome Made Simple and Efficient. Dev Cell 36:654–667. [DOI] [PMC free article] [PubMed] [Google Scholar]
- Jao LE, Wente SR, Chen W. 2013. Efficient multiplex biallelic zebrafish genome editing using a CRISPR nuclease system. Proc Natl Acad Sci U S A 110:13904–13909. [DOI] [PMC free article] [PubMed] [Google Scholar]
- Jowett T. 1999. Analysis of protein and gene expression. Methods Cell Biol 59:63–85. [DOI] [PubMed] [Google Scholar]
- Kimmel CB, Ballard WW, Kimmel SR, Ullmann B, Schilling TF. 1995. Stages of embryonic development of the zebrafish. Dev Dyn 203:253–310. [DOI] [PubMed] [Google Scholar]
- Lee D, Park C, Lee H, Lugus JJ, Kim SH, Arentson E, Chung YS, Gomez G, Kyba M, Lin S, Janknecht R, Lim DS, Choi K. 2008. ER71 acts downstream of BMP, Notch, and Wnt signaling in blood and vessel progenitor specification. Cell Stem Cell 2:497–507. [DOI] [PMC free article] [PubMed] [Google Scholar]
- Liu F, Kang I, Park C, Chang LW, Wang W, Lee D, Lim DS, Vittet D, Nerbonne JM, Choi K. 2012. ER71 specifies Flk-1+ hemangiogenic mesoderm by inhibiting cardiac mesoderm and Wnt signaling. Blood 119:3295–3305. [DOI] [PMC free article] [PubMed] [Google Scholar]
- Moore JC, Sheppard-Tindell S, Shestopalov IA, Yamazoe S, Chen JK, Lawson ND. 2013. Post-transcriptional mechanisms contribute to Etv2 repression during vascular development. Dev Biol 384:128–140. [DOI] [PMC free article] [PubMed] [Google Scholar]
- Palencia-Desai S, Kohli V, Kang J, Chi NC, Black BL, Sumanas S. 2011. Vascular endothelial and endocardial progenitors differentiate as cardiomyocytes in the absence of Etsrp/Etv2 function. Development 138:4721–4732. [DOI] [PMC free article] [PubMed] [Google Scholar]
- Pham VN, Lawson ND, Mugford JW, Dye L, Castranova D, Lo B, Weinstein BM. 2007. Combinatorial function of ETS transcription factors in the developing vasculature. Dev Biol 303:772–783. [DOI] [PMC free article] [PubMed] [Google Scholar]
- Proulx K, Lu A, Sumanas S. 2010. Cranial vasculature in zebrafish forms by angioblast cluster-derived angiogenesis. Dev Biol. [DOI] [PubMed] [Google Scholar]
- Rasmussen TL, Kweon J, Diekmann MA, Belema-Bedada F, Song Q, Bowlin K, Shi X, Ferdous A, Li T, Kyba M, Metzger JM, Koyano-Nakagawa N, Garry DJ. 2011. ER71 directs mesodermal fate decisions during embryogenesis. Development 138:4801–4812. [DOI] [PMC free article] [PubMed] [Google Scholar]
- Sumanas S, Gomez G, Zhao Y, Park C, Choi K, Lin S. 2008. Interplay among Etsrp/ER71, Scl, and Alk8 signaling controls endothelial and myeloid cell formation. Blood 111:4500–4510. [DOI] [PMC free article] [PubMed] [Google Scholar]
- Sumanas S, Jorniak T, Lin S. 2005. Identification of novel vascular endothelial-specific genes by the microarray analysis of the zebrafish cloche mutants. Blood 106:534–541. [DOI] [PMC free article] [PubMed] [Google Scholar]
- Sumanas S, Lin S. 2006. Ets1-related protein is a key regulator of vasculogenesis in zebrafish. PLoS Biol 4:e10. [DOI] [PMC free article] [PubMed] [Google Scholar]
- Veldman MB, Lin S. 2012. Etsrp/Etv2 is directly regulated by Foxc1a/b in the zebrafish angioblast. Circ Res 110:220–229. [DOI] [PMC free article] [PubMed] [Google Scholar]
- Wong KS, Proulx K, Rost MS, Sumanas S. 2009. Identification of vasculature-specific genes by microarray analysis of Etsrp/Etv2 overexpressing zebrafish embryos. Dev Dyn 238:1836–1850. [DOI] [PubMed] [Google Scholar]
Associated Data
This section collects any data citations, data availability statements, or supplementary materials included in this article.


