Abstract
Lizards are the closest relatives of mammals capable of tail regeneration, but the specific determinants of amniote regenerative capabilities are currently unknown. Macrophages are phagocytic immune cells that play a critical role in wound healing and tissue regeneration in a wide range of species. We hypothesize that macrophages regulate the process of lizard tail regeneration, and that comparisons with mammalian cell populations will yield insight into the role phagocytes play in determining an organism’s regenerative potential. Single cell RNA sequencing (scRNAseq) was used to profile lizard immune cells and compare with mouse counterparts to contrast cell types between the two species. Treatment with clodronate liposomes effectively inhibited lizard tail stump tissue ablation and subsequent regeneration, and scRNAseq was used to profile changes in lizard immune cell populations resulting from tail amputation as well as identifying specific cell types affected by clodronate treatment. ScRNAseq analysis of lizard bone marrow, peripheral blood, and tissue-resident phagocyte cell populations was used to trace marker progression during macrophage differentiation and activation. These results indicated that lizard macrophages are recruited to tail amputation injuries faster than mouse populations and express high levels of matrix metalloproteinases (MMPs). In turn, treatment with MMP inhibitors inhibited lizard tail regeneration. These results provide single cell sequencing data sets for evaluating and comparing lizard and mammalian immune cell populations, and identifying macrophage populations that are critical regulators of lizard tail regrowth.
Keywords: lizard, regeneration, macrophages, single cell sequencing, white blood cells, clodronate, matrix metalloproteinases
Graphical Abstract
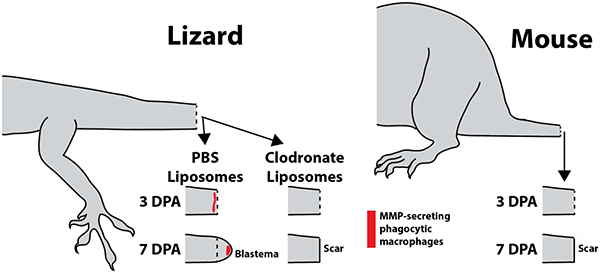
Lizard macrophages support tail regeneration, while the mouse immune system does not. Untreated lizards, or lizards treated with PBS liposomes, exhibit recruitment of MMP-producing phagocytic macrophages three days after tail amputation and develop regenerative blastemas by 7 days. Treatment with clodronate liposomes, which deplete macrophage populations, leads to scar rather than blastema formation. Similarly, mice do not exhibit increases in phagocytic cell populations following tail amputation, and form scars rather than regenerating.
INTRODUCTION
In contrast to humans and most mammals, a number of lower order species including salamanders1, zebrafish2, and lizards3 among others4 display a wide range of regenerative capabilities that allow them overcome the burden of tissue loss4. Of these, lizards are the only species classified as amniotes and therefore are the closest relatives to mammals capable of composite tissue regeneration. As such, lizards are uniquely positioned within the evolutionary tree as valuable species for the study and development of tissue engineering and regenerative medicine strategies for tissue repair5.
Lizard tail regeneration is thought to have evolved as an epiphenomenon of embryonic development6, but despite decades of research, multiple technical obstacles remain and the process is only partially understood. It is well established that after tail amputation or autotomy, hemostasis and re-epithelialization rapidly occur. These two stages are similar to the early steps of the mammalian wound healing response4. However, lizards possess unique adaptations such as fracture planes and vascular sphincters that allow them to expedite the early stages of the wound healing response and quickly proceed with the tissue repair process7.
Compared to lizards, the wound healing response in mammals has been extensively studied and the cellular and molecular mechanisms of its multiple phases have been described in greater detail. The mammalian immune system is known to play an important role in orchestrating key steps in each of these phases8–10. In fact, a widespread hypothesis states that higher order species have evolved the ability to mount strong inflammatory responses to facilitate pathogen clearance at the expense of losing regenerative capabilities. This hypothesis is partially based on the observation that stronger inflammatory and adaptive immune responses correlate with fibrotic tissue deposition, while regeneration capable species tend to more heavily rely on non-immune mechanisms to avoid infection11.
A complete description of the regenerative process in lizards has proven to be a challenging task because the role of the immune system in epimorphic regeneration has not been established. Part of the main obstacles preventing advances on this front result from lack of understanding of lizard immunology at a cellular and molecular level- an important prerequisite to carry out adequately designed comparative studies between mammalian and reptilian wound healing immunology.
For example, in the case of other regenerative and non-regenerative species, macrophages have been shown to play a crucial role in wound healing, and macrophage depletion or ablation in the African Spiny Mouse12, salamander1, and zebrafish2 animal models have been shown to result in delayed or halted regeneration. But while lizards are known to possess both innate and adaptive immune systems, specific cell types are not well described, and their role in the regenerative process has not been identified. The lizard innate immune system is known to include non-specific leukocytes, antimicrobial molecules and a complement system13. But the extent to which these molecules and cell types are conserved across species and participate in lizard regeneration is currently unknown. We hypothesize that macrophages regulate the process of lizard tail regeneration, and that comparisons with mammalian cell populations will yield insight into the role phagocytes play in determining an organism’s regenerative potential.
MATERIALS AND METHODS
All procedures were approved by and performed according to the guidelines of the Institutional Animal Care and Use Committee at the University of Pittsburgh (Protocol Numbers IS00008889 and IS00012375) and at the University of Southern California (Protocol Number 20992). Adult male wild type lizards (Anolis carolinensis) and mice (strain BALB/c) were used. All reagents/chemicals were purchased from Sigma Aldrich (St. Louis, MO, USA) unless otherwise specified.
Peripheral blood- and bone marrow-derived white blood cell isolation
Peripheral blood and bone marrow macrophages were isolated from the green anole lizard (Anolis carolinensis) and the house mouse (Mus musculus). Peripheral blood was collected via cardiac puncture and centrifuged at 400xg for 1 min to pellet cells followed by treatment with red blood cell lysis buffer (ThermoFisher Scientific) to yield white blood cell suspensions. Bone marrow was collected by extrusion via crushing femur bones with a mortar and pestle. Bone marrow cells were passed through a 70 μm filter and treated with red blood cell lysis buffer. For bone marrow-derived macrophage differentiation, bone marrow cells were cultured for 1 week in macrophage selection medium as previously described14 - DMEM (Gibco, Grand Island, NY), 10% fetal bovine serum (FBS) (Invitrogen, Carlsbad, CA), 10% L929 supernatant, 0.1% beta-mercaptoethanol (Gibco), 100 U/ml penicillin, 100 ug/ml streptomyocin, 10 mM non-essential amino acids (Gibco), and 10 mm hepes buffer.at 37°C (mouse) or 30°C (lizard).
Phagocytosis assays
Lizard and mouse white blood cells were incubated with pHrodo™ green E. coli bioparticles (ThermoFisher Scientific) for 2 hours at 30°C (lizard) or 37°C (mouse) before analysis with a BD FACS Aria II flow cytometer. PHrodo bioparticles exhibit pH-sensitive fluorogenic signals that substantially increase upon ingestion into acidic phagosomes. Forward scatter, side scatter, and green fluorescence were analyzed.
In-vivo Macrophage Depletion
To systemically deplete phagocyte populations during tail regeneration, lizards received intraperitoneal (IP) injections of L-α-phoshatidylcholine/cholesterol liposomes containing clodronate (0.125 mg/g) 96, 48, and 24 hours before tail amputation and every 72 hours thereafter. Control animals were treated with liposomes containing PBS instead of clodronate. To fluorescently label phagocytic cell populations, lizards were IP injected with L-α-phoshatidylcholine/cholesterol/DiI liposomes simultaneously with every treatment injection. For isolation of blastema derived phagocytes/macrophages, blastemas were collected from DiI liposome-treated animals, dissociated using a gentle MACS Dissociator (Miltenyi), and fluorescence-activated cell sorted with a BD FACS Aria II flow cytometer.
Histology
Lizards tail samples were collected after 0, 3, 7, 14, or 21 days following original tail amputation. Samples were fixed overnight in 4% paraformaldehyde, decalcified for 1 week in 10% EDTA (pH 7.4), equilibrated to 30% sucrose, embedded in optimal cutting temperature compound (OCT, Tissue-Tek), sectioned at 7 or 20 μm thickness, mounted on glass slides, and stained with 4′,6-diamidino-2-phenylindole (DAPI). For labeling of proliferating cell populations with 5-ethynyl-2’-deoxyuridine (EdU) (ThermoFisher Scientific), animals received IP injections of EdU (50 mg/kg) four hours prior to sample collection. Samples were cryosectioned and stained according to the manufacturer’s instructions. Images were captured with an Olympus CKX41 microscope outfitted with a Leica DFC 3200 camera. To measure phagocyte levels in vivo, histology samples were collected from lizards treated with DiI liposomes and imaged with a Keyence BZ-X800 microscope as 16 μm-thick Z-stacks, and the areas of DiI signal were quantified.
Micro computed tomography (microCT)
Samples were immersed in PBS and scanned with a vivaCT 40 (Scanco Medical, Switzerland) (Resolution, 19 μm; Energy, 70 kVp; Current, 114 μA). MicroCT scans were converted to 3D reconstructions.
Single cell RNA sequencing (scRNASeq)
ScRNAseq experiments involving lizard blood, bone marrow, and DiI-labeled macrophages were performed using the 10× Genomics. Single animals were used to generate each sample. Cells were loaded onto the 10× cartridge with a target of 10,000 cells per sample. Cell barcoding and library preparation were performed using the Chromium Single Cell 3′ v2 reagent kit according to the manufacturer’s instructions. Each cell was paired-end sequenced on an Illumina NextSeq 550 to a depth of 50,000 reads. Base calling, adaptor trimming, and de-multiplexing of single cells were performed by using 10× Genomics Cell Ranger 2.1 software. Single-cell reads obtained with 10× Genomics were aligned to the Anolis carolinensis genome (AnoCar2.0). Cells with fewer than 1000 detected genes and ribosomal protein genes were excluded. R studio was used for constructing heat maps, pie charts, and histograms. Spring (Klein Tools)15 was used to identify cell clusters and perform differential gene expression analysis on the basis of tSNE. Mouse cell data sets were downloaded from the Mouse Cell Atlas (MCA_BatchRemove_dge.zip)16.
MMP Inhibition
The broad spectrum MMP inhibitor GM6001 was delivered via IP injection (100 mg/kg) every other day for four weeks. A control group of lizards were treated with vehicle control.
In situ zymography
MMP activity in the regenerated lizard tail was revealed using in situ zymography adapted from Hadler-Olsen et al. (2010)17. Briefly, tissue samples were fixed using zinc-based fixative (ZBF) consisting of 36.7 mM ZnCl2, 27.3 mM ZnAc2 X 2H2O, and 0.63 mM CaAc2 in 0.1 M Tris, pH 7.4 for 36–38 hours. After fixing, the samples were rinsed 3 times in PBS, equilibrated to 30% sucrose and embedded in OCT compound (Tissue-Tek). Processed samples were sectioned (8 μm thick), mounted on glass slides, dried for 10 minutes, and washed in PBS (3X 35 min) to remove OCT. Gelatin substrate was prepared by dissolving 1 mg DQ gelatin (ThermoFisher) in 1 mL of Milli-Q water. Reaction buffer containing g 50 mM Tris-HCl, 150 mM NaCl, 5 mM CaCl2, and 0.2 mM sodium azide (pH 7.6) was then used to further dilute the gelatin 1:50. Gelatin Substrate was added to experimental slides and incubated in a dark humidity chamber at 37C. After 2 hours, the slides were rinsed with Milli-Q water, fixed in 4% paraformaldehyde for 10 minutes in the dark, rinsed with PBS (2X 35 mins) and counterstained with DAPI. A subset of sections was also immunostained for MMP2 using Abcam antibody ab97779.
Tail Length Quantification
Collected tail samples were photographed using an Olympus SZX16 stereo microscope. Images were uploaded in ImageJ (NIH, Bethesda MD) and quantified using the measure command.
Statistical Analysis
Statistical analysis was performed using Prism 7 with one or two-way ANOVA with pairwise Tukey’s multiple comparison test for data with multiple groups. A p-value of <0.05 was deemed to be statistically significant. All values and graphs are shown as mean ± SD.
RESULTS
Lizard Tail amputation stimulates phagocytosis in both peripheral blood and regenerating tail cell populations.
Lizard and mouse blood samples were collected 0, 3, 7, 14, and 21 days post-tail amputation (DPA) and analyzed by fluorogenic phagocytosis assays (Fig. 1A, SI Figure 1). These studies involved 3 experimental replicates. Flow cytometric analysis of lizard vs mouse samples revealed that mouse white blood cells exhibited a higher spread in green autofluorescence than lizard cells (SI Figure 1), indicating a higher diversity in cell types. Lizard white blood cells exhibited higher phagocytosis rates than mouse cells for 0–14 DPA (Fig. 1A, SI Figure 1), while mouse cells exhibited higher rates at Day 21. Both lizard and mouse phagocytic cells exhibited similar side scatter profiles (SI Figure 1). Lizard cells exhibited significantly increased phagocytosis rates at 3, 7, and 14 DPA compared to 0 DPA levels, with 3 DPA lizard blood samples exhibiting particularly high levels of phagocytosis (Fig. 1A, SI Figure 1). 3DPA mouse blood samples also exhibited peak phagocytosis rates for this species, but did not approach the magnitude or time-specificity as lizard 3 DPA samples (Fig. 1A, SI Figure 1). These results indicate that lizards, but not mice, exhibit a strong early blood cell phagocytic response in response to tail amputation.
Figure 1: Lizard tail amputation stimulates peripheral blood cell phagocytosis and recruitment of phagocytic cells to regenerating tails.
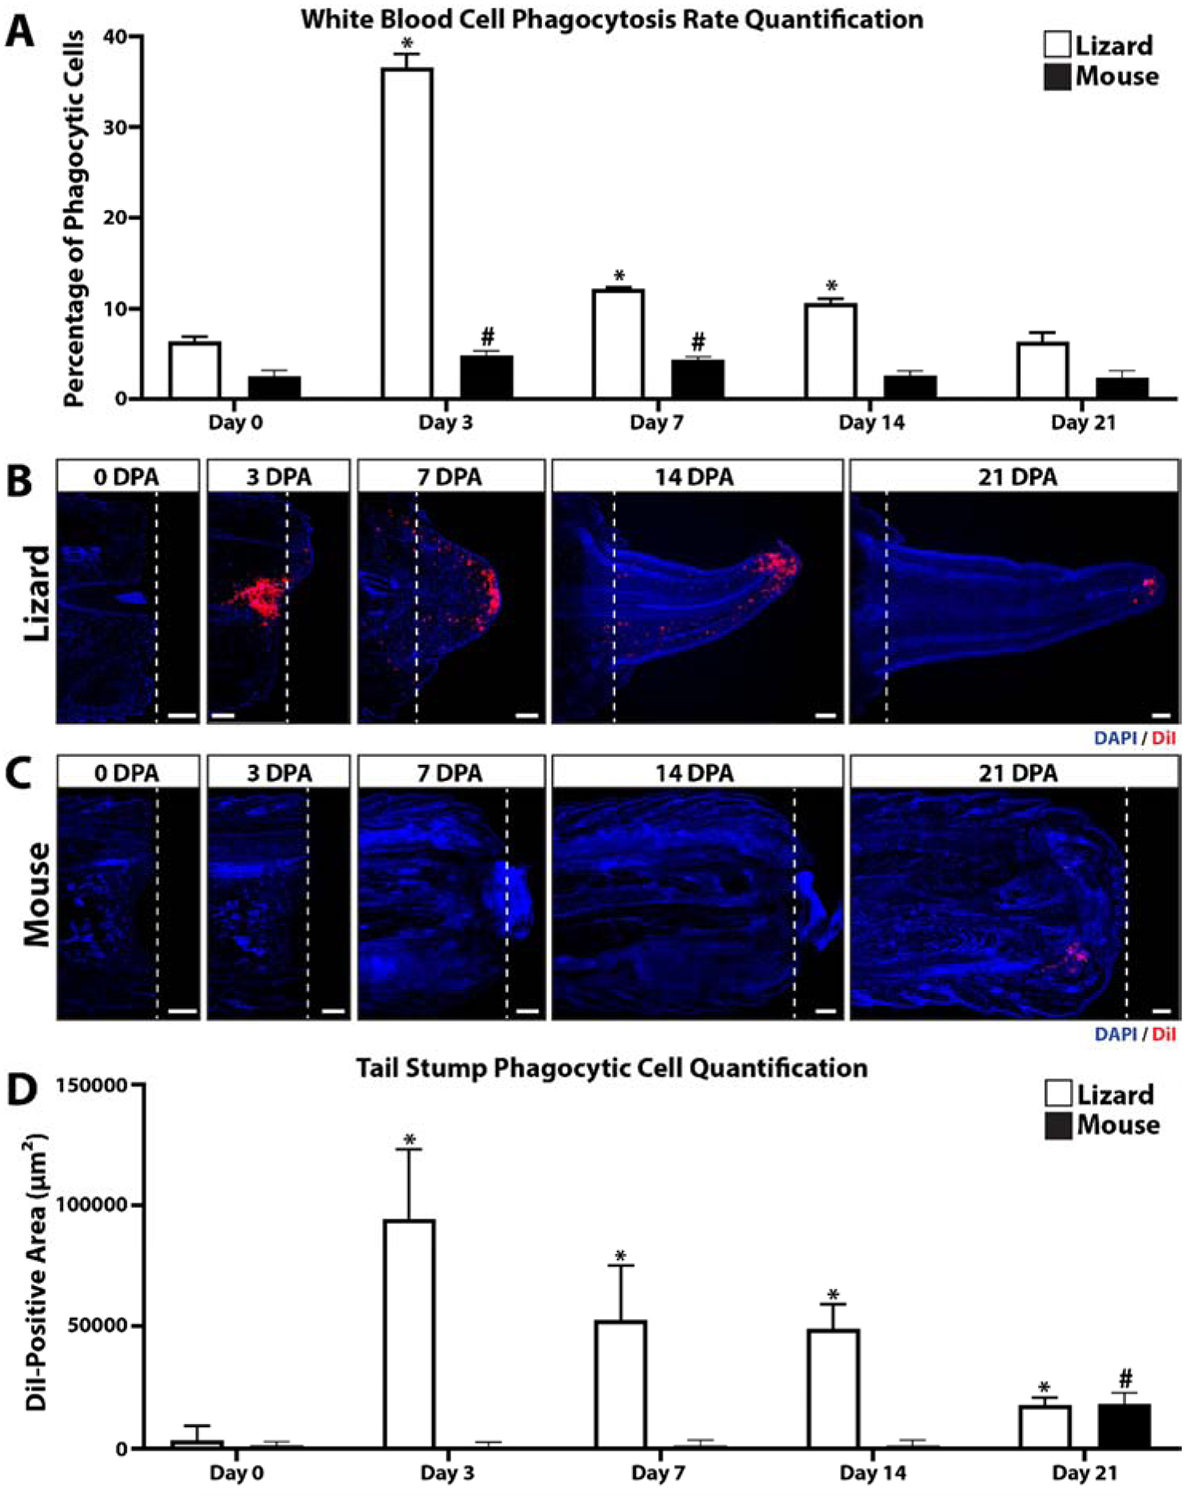
(A) Phagocytosis assay analysis of mouse and lizard blood cells collected 0, 3, 7, 14, and 21 days post-tail amputation (DPA). N= 3. * p<0.05, compared to lizard 0 DPA; # p<0.05, compared to mouse 0 DPA. (B, C) Histological analysis of (B) lizard and (C) mouse tail samples collected 0, 3, 7, 24, and 21 DPA. Phagocytic cells were labeled by uptake of DiI-containing liposomes, and sampled were counterstained with DAPI. Dashed lines denote amputation planes. Bar = 250 μm. (B) Quantification of lizard and mouse phagocytosis levels detected in tail histology samples 0–21 DPA. N= 3. * p<0.05, compared to lizard 0 DPA; # p<0.05, compared to mouse 0 DPA.
The time course of regenerating lizard tails exhibited the following milestones: tail amputation at day 0; re-epithelization of tail stumps at 3 DPA, blastema formation at 7 DPA, and regenerated tail elongation at 14 DPA, and tissue differentiation at day 21. Lizard phagocytic cells recruited to regenerating tail tissues during these stages were tracked with liposomes containing the fluorescent dye DiI (Fig. 1B) followed by histologic analysis. Three tails of each time point (0, 3, 7, 14, and 21 DPA) were analyzed. Immediately after injury (0 DPA), phagocytic cells were largely absent from the amputated tail stump. At 3 DPA, large accumulations of phagocytic cells were detected, particularly beneath re-epithelialized distal regions (Fig. 1B). At 7 DPA, phagocytic cells were found throughout the blastema but accumulated at the apical region under blastema epidermis (Fig. 1B). Phagocytic cell accumulations remained in apical regenerated regions 14 and 21 DPA, but phagocytic cell levels within the rest of the regenerating tail and in original tissue began to fall to pre-injury levels. (Fig. 1B). Phagocytic cell recruitment was also analyzed in mice by histology using the same time points as lizard experiments (Fig. 1C). DiI-labeled phagocytic cells were not detected in amputated mouse tails until 21 DPA (Fig. 1C). DII-labelled phagocytic cells detected in lizard and mouse histological samples collected over 0–21 DPA were quantified and compared (Fig. 1D). Like lizard peripheral blood phagocytosis assay rates, amputated lizard tail phagocyte levels peaked at 3 DPA and decreased during tail regeneration until 21 DPA. Conversely, amputated mouse tail phagocyte levels did not elevate until 21 DPA and did not reach the same magnitudes as lizard 3 DPA levels. Taken together, these results suggest that the early increase in lizard peripheral blood phagocytosis rates is mirrored in amputated stump tail tissue phagocyte levels, while amputated mouse tail phagocyte levels increase comparatively late and without simultaneous increases in blood phagocytosis levels.
Phagocytic cell populations are required for lizard tail regeneration.
Clodronate liposomes have been shown to be an efficient and effective method for systemically depleting phagocytic cell populations18,19. In the present study, we tested the effects of clodronate liposome treatment on lizard blood and tail tissue phagocytic cell populations and tail regrowth. Clodronate efficacy was verified by collecting 3 DPA blood samples from lizards treated with clodronate or PBS (control) liposomes and analyzed by phagocytosis assays. Three experimental replicates were tested. Clodronate treatment was shown to significantly decrease blood cell phagocytosis levels (Fig. 2A). Next, the effects of clodronate liposome treatment on tail phagocytic cells were investigated. 3, 7 and 21 DPA tail samples were collected from lizards treated with clodronate or PBS liposomes and analyzed by microCT and/or histology (Fig. 2B–T). Three tails were analyzed for each time point for each condition. While the external appearance of 3DPA PBS vs clodronate liposome-treated tails were similar, only tails of PBS liposome-treated lizards underwent an internal process known as ablation20 (Fig. 2C), wherein the distal end of the amputated tai stump was degenerated and, eventually, shed. The ablation process involves “cuts” through tail stump vertebrae by CTSK+ cells and is easily observed though microCT analysis20 (Fig. 2C). Two spatially-distinct population of CTSK+ cells were observed in PBS liposome, but not clodronate liposome, tails (Fig. 2D–O). One population associated with ablated vertebrae (Fig. 2 D, E), while the other population associated with the severed spinal cord and accumulated beneath newly-formed wound epithelium (Fig. 2D, F). DiI co-localized with both populations of CTSK immunostained cells in tails of lizards co-treated with DiI and PBS liposomes (Fig. 2G–I), while neither CTSK expression nor DiI labeling was observed in tails of lizards treated with DiI and clodronate liposomes (Fig. 2J–O). Clodronate liposome treatment also appeared to interfere with blood clot clearance from tail stumps as tails from clodronate-treated lizards exhibited more extensive clots than PBS lizard tails at 3 DPA (Fig. 2D, J). Taken together, these results suggest that phagocytic populations recruited to 3 DPA lizard tail stumps includes CTSK+ cells.
Figure 2: Treatment with clodronate liposomes depletes both peripheral blood and regenerating tail phagocytic cells and inhibits tail regeneration.
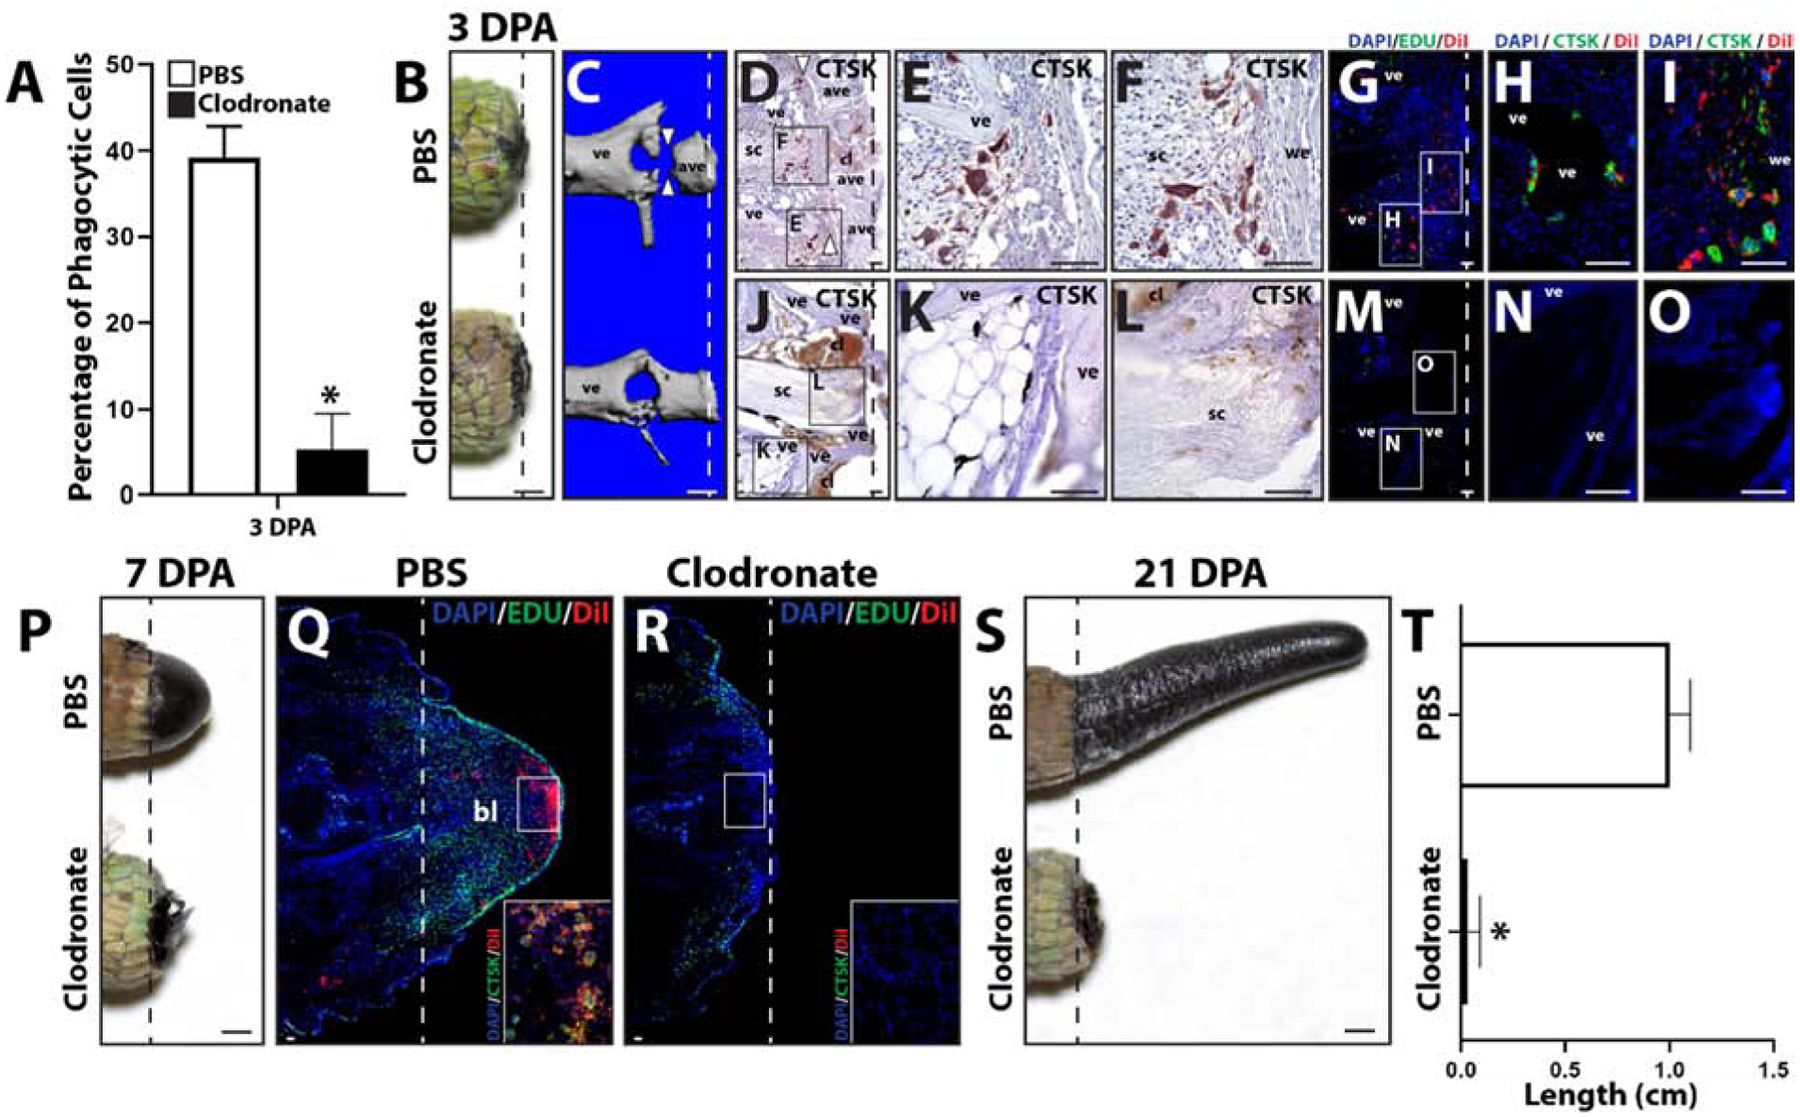
(A) Phagocytosis assay analysis of 3 DPA blood samples collected from lizard treated with clodronate or PBS (control) liposomes. N=3. * p<0.05, compared to PBS liposome condition (t-test). (B, C) Comparison of tails collected from lizards treated with PBS or clodronate liposomes 3 DPA by (B) gross morphology and (C) microCT. White arrow heads denote “cuts” in ablated vertebrae. (D) Brightfield micrograph of a sagittal section from a PBS liposome-treated lizard tail sample (3 DPA) analyzed by CTSK immunohistochemistry (red). White arrow heads mark sites of vertebra ablation. (E, F) Higher magnification views of separate CTSK+ cell populations associated with (E) vertebrae and (F) wound epithelium identified in Panel D. (G) Fluorescence micrograph of a sagittal section from a tail histology sample collected 3 DPA from a lizard co-treated with PBS and DiI liposomes and analyzed by CTSK immunostaining. (H, I) Higher magnification views of CTSK+ populations associated with (H) vertebrae and (I) wound epithelium identified in Panel G. (J) Brightfield micrograph of a sagittal section from a clodronate liposome-treated tail sample (3 DPA) analyzed by CTSK immunohistochemistry. (K, J) Higher magnification views of (K) vertebrae and (L) spinal cord regions identified in Panel J showing lack of CTSK+ cells. (M) Fluorescence micrograph of a sagittal section from a clodronate and DiI liposome-treated lizard tail sample collected 3 DPA and analyzed by CTSK immunostaining. (N, O) Higher magnification views of (H) vertebral and (I) central regions identified in Panel M showing lack of CTSK+ and DiI+ cells. (P) Comparison of tails collected from lizards treated with PBS or clodronate liposomes 7 DPA. (Q, R) Histological analysis of (Q) PBS and (R) clodronate liposome-treated lizard tails 7 DPA, including Edu staining of proliferative cells and DiI-labeling of phagocytic cells. Insets present higher magnification views of regions identified in Panels Q and R analyzed by CTSK immunostaining to highlight the accumulation of CTSK+ DiI+ cells in PBS, but not clodronate, liposome-treated tails. (E) Comparison of tails collected from lizards treated with PBS or clodronate liposomes 21 DPA. (F) Quantification of the effects of treatment with PBS or clodronate liposomes on regenerated lizard tail lengths. N=5. * p<0.05. Dashed lines denote amputation planes. ave, ablated vertebra; bl, blastema; cl, clot; sc, spinal cord; ve, vertebra; we, would epithelium. Bar = 1 mm or 100 μm.
At 7DPA, lizards treated with PBS liposomes developed normal blastemas (Fig. 2P, Q), while treatment with clodronate liposomes completely inhibited blastema formation (Fig. 2P, R). Proliferation was assessed via Edu incorporation, and phagocytic cell recruitment was assessed via DiI liposome labeling and CTSK immunostaining (Fig. 2Q, R). Blastemas generated by control animals exhibited abundant proliferating cells throughout the regenerating structure as well as the distal portion of the tail stump (Fig. 2Q). DiI-labeled phagocytic cells were localized to apical regions of blastemas, and these cells expressed CTSK (Fig. 2Q). Treatment with clodronate liposomes resulted in the complete loss of CTSK+ DiI-labeled phagocytic cells, and significant reduction of proliferating cells (Fig. 2R; SI Figure 2). Inhibition of tail regeneration by clodronate liposomes continued through 21 DPA, during which PBS liposome-treated lizards regrew elongated tails, while lizards treated with clodronate liposomes did not exhibit any new tissue formation (Fig. 2S, T). These results validated clodronate liposome treatment as an effective method of depleting lizard blood and tissue-resident phagocytic cell population, and highlight the critical importance of these phagocytic population in tail regeneration.
Finally, vertebra ablation and infiltration of CTSK+ phagocytic cells to amputated tail stumps was compared in lizards vs mice (SI Figure 3). Mouse tail vertebrae did not exhibit the distinctive “cut” observed in lizard tail vertebrae 3 DPA (SI Figure 3A, B). Similarly, CTSK+ cells were present in amputated lizard tails but absent from 3DPA mouse tail stumps (SI Figure 3C–H). CTSK+ cells were not detected in amputated mouse tail stumps until 21 DPA (SI Figure 3I), and these cells were co-labeled by DiI liposomes (SI Figure 3M). Unlike lizards CTSK+ cells, which accumulated in two distinct locations in association with either vertebra or wound epithelium at 3 DPA (SI Figure 3F–H), mouse tails exhibited only vertebra-associated CTSK+ phagocytic cells at 21 DPA (SI Figure 3I–M). These results support our other findings that recruitment of phagocytic cells to the amputated mouse tail stump is delayed compared to the situation in lizards, and that this delay has the biological consequence of hindering early vertebra ablation in mice.
Comparing lizard and mouse peripheral blood by scRNAseq reveals shared and divergent cell populations.
Having identified blood and tissue-resident phagocytic cell populations that respond to clodronate liposome treatment and regulate tail regeneration, we turned to single cell RNA sequencing (scRNAseq) to profile cell types involved. ScRNAseq allows for transcriptomic analyses at single-cell resolution that, when combined with clustering analysis, identifies groups of cells with similar marker expression profiles. Lizard blood cell markers are almost completely unstudied, therefore we began by comparing lizard vs mouse white blood cells by scRNAseq to determine similarities and differences in population compositions. ScRNAseq revealed 6 main mouse blood clusters and 4 main lizard blood cell clusters (Fig. 3, SI Figure 4). Next, we interrogated mouse data sets looking for expression of established monocyte, basophil/mast cell, T lymphocyte, B lymphocyte, neutrophil and eosinophil markers to identify established cell clusters. Mouse cluster 1 was enriched with the monocyte markers CD68/GP110 and CD11b/ITGAM, suggesting a monocyte identity. Mouse blood cell Cluster 1 was also enriched for CTSS, LY86, and CST3. Lizard data sets were interrogated for expression of these markers to identify clusters exhibiting similar profiles. Like the mouse monocyte group, Cluster 1 of lizard blood samples was enriched for CTSS, LY86 and CST3, suggesting a monocyte identity for this cell group. Unlike mouse monocytes, however, lizard monocytes did not express CD68 or CD11b. Instead, lizard monocytes expressed high levels of CD34, FLT3, LYZ, and CTSK, which were expressed at comparatively low levels in mouse monocytes (Fig. 3D).
Figure 3: Comparisons of uninjured lizard and mouse peripheral blood cells by scRNAseq.
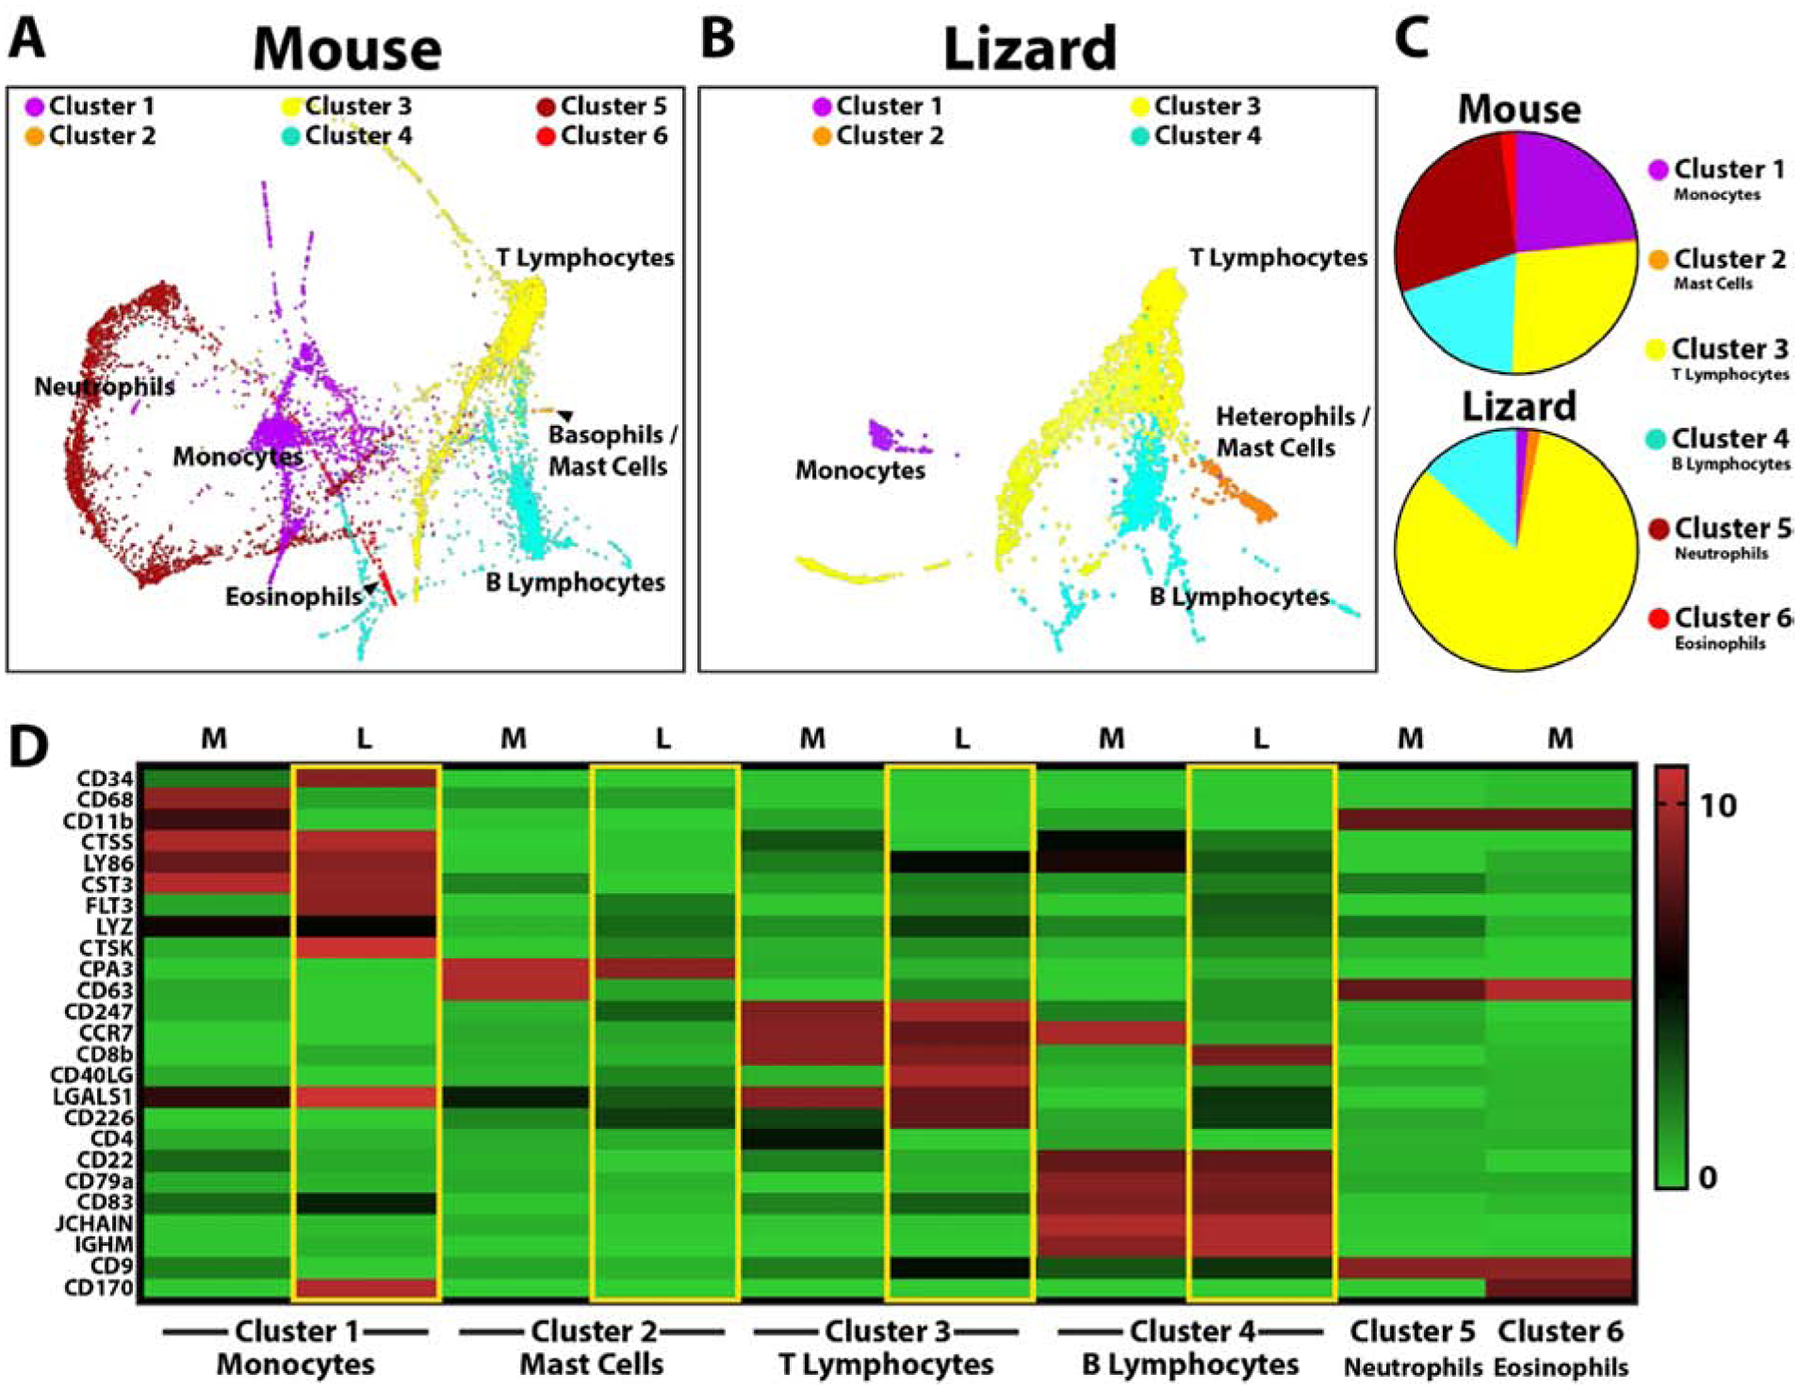
(A, B) TSNE plots of cluster analysis of uninjured (A) mouse and (B) lizard blood cells identifying the 6 main mouse cell clusters and 4 lizard cell clusters. Clustering and visualization of lizard and mouse data sets were performed independently. (C) Pie charts comparing relative cell cluster contributions of lizard and mouse peripheral blood cells. (i.e. From the top pie chart, 23.6% of mouse peripheral white blood cells belong to Cluster 1/monocytes.) (D) Heat map presenting lizard and mouse blood cell markers used to identify clusters: Cluster 1 corresponds to monocytes, Cluster 2 - basophils/mast cells, Cluster 3 – T lymphocytes, Cluster 4 – B lymphocytes, Cluster 5 – neutrophils, Cluster 6 – eosinophils.
Similar analysis strategies were applied to the remaining blood cell types (Fig. 3D). Cluster 2 in mouse samples expressed the basophil/mast cell markers CPA3 and CD63. Lizard blood cell cluster 2 was enriched for CPA3, but not CD63. Cluster 3 in mouse samples expressed the T lymphocyte markers CD247, CD8b, CD4, and CD226. These corresponded to lizard T lymphocytes in cluster 3, which expressed CD247 and CD226, but not CD8b or CD4. Lizard T lymphocytes were also enriched for CCR7, CD40LG, and LGALS1. Cluster 4 in mouse samples expressed the B lymphocyte markers CD22, CD79a, CD83, JCHAIN, and IGHM. These corresponded very well to lizard blood sample cluster 4, which was also enriched for CD22, CD79a, CD83, JCHAIN, and IGHM. Interestingly, lizard B lymphocytes also expressed CD8b, a T lymphocyte marker in mouse samples. Mouse cluster 5 expressed the neutrophil marker CD9, while Lizard samples did not exhibit a corresponding CD9+ cluster; instead, CD9 was expressed by lizard T lymphocytes (cluster 3) and B lymphocytes (cluster 4). Mouse cluster 6 expressed the eosinophil marker CD170. However, lizard monocytes (cluster 1) expressed high levels of CD170, and a lizard eosinophil cluster could not be identified.
Having identified the cell types corresponding to the mouse and lizard blood cell clusters, we compared the contributions and marker expression of each cell group (Fig. 3C, D). Proportionally, lizard lymphocytes constituted larger portions of total blood cells. Lizard blood also contained higher proportions of basophils/mast cells and lower levels of monocytes than mouse samples. Furthermore, important marker differences were detected for all clusters when compared to mouse samples. For example, lizard monocytes did not express CD68 or CD11b/ITGAM. Lizard monocytes expressed CD170, which is a marker for mouse eosinophils, and CD34, which is a hematopoietic stem cell marker. Furthermore, CD8 was expressed by lizard B lymphocytes over T lymphocytes. The cathepsin family of proteases was shown to be particularly useful markers in terms of defining lizard blood cell populations. For example, lizard monocytes expressed CTSK and CTSS expression localized almost exclusively to lizard monocyte populations; CTSZ and CTSD expression marked lizard basophil/mast cell populations; and lizard lymphocytes expressed higher levels of CTSA and CTSB than monocytes and basophils/mast cells. Overall, these studies identified relevant markers for subsequent analysis of scRNAseq analysis of lizard blood cell types and lineages: monocytes (CD34, CTSS, LY86, CST3, FLT3, CTSK, and CD170); basophils/mast cells (CMA1, CPA3, CTSZ, CTSD); T lymphocytes (CD247, CCR7, CD40LG, and CD226); and B lymphocytes (CD22, CD8b, CD79a, CD83, JCHAIN, and IGHM).
Lizard peripheral blood monocytes and mast cells/heterophils exhibit higher phagocytosis rates than their mouse counterparts.
Validation of scRNAseq-identified lizard and mouse immune cells markers by immunostaining was coupled with phagocytosis assays to compare phagocytosis rates among cell types of different species (Fig. 4). Lizard and mouse white blood cells were incubated with pHrodo E. coli bioparticles before immunostaining for CD34, CD68, CTSK, CPA3, CD63, CD8b, CD247, CD83, CD11b, CD9, and CD170 expression (Fig. 4A). Ten separate blood cell preparations were prepared for each marker, and 100 cells were imaged per preparation. Immune cell types were identifiable based on their marker expression profiles: CD68+, CD34-, CTSK-mouse monocytes; CD34+, CTSK+, CD170+, CD68-, CD11b-lizard monocytes; CPA3+, CD63+ mouse mast cells/Basophils; CPA3+, CD63-lizard mast cells/heterophils; CD8b+, CD247+ mouse T-lymphocytes; CD8b+, CD247+, CD9+, CD11b-lizard T-lymphocytes; CD83+, CD8b- mouse B-lymphocytes; CD83+, CD8b+ lizard B-lymphocytes; CD11b+, CD9+ mouse neutrophils; CD11b+, CD170+ mouse eosinophils (Fig. 4B). Immunostaining results validated scRNAseq findings, including differences in marker expression between mouse vs lizard immune cells. For example, lizard monocytes expressed CD34 and CTSK but not CD68 or CD11b, while mouse monocytes expressed CD68 but not CD34 or CTSK (Fig. 4B). Greater than 90% of lizard cells positive for CD34, CTSK, or CD170 phagocytosed pHrodo bioparticles; greater than 85% of lizard cells positive for CPA3 were phagocytic; and greater than 92% of mouse cells positive for CD11b and CD170 were phagocytes (Fig. 4C). Cells positive for all other markers exhibited phagocytosis rates less than 5%. Classifying immune cell types by marker expression, the most phagocytic mouse cells were neutrophils, while the most phagocytic lizard cells were monocytes and mast cells/heterophils (Fig. 4C). These results suggest that lizard monocytes and mast cells are significantly more phagocytic than their mouse counterparts. Quantifying the contribution of each cell type as percentages of total phagocytes with rates above 75% revealed that neutrophils represent the vast majority of mouse peripheral blood phagocytes, while the majority of lizard phagocytes are monocytes and, secondarily, mast cells/heterophils.
Figure 4: Comparisons of lizard and mouse immune cell markers and phagocytosis rates.
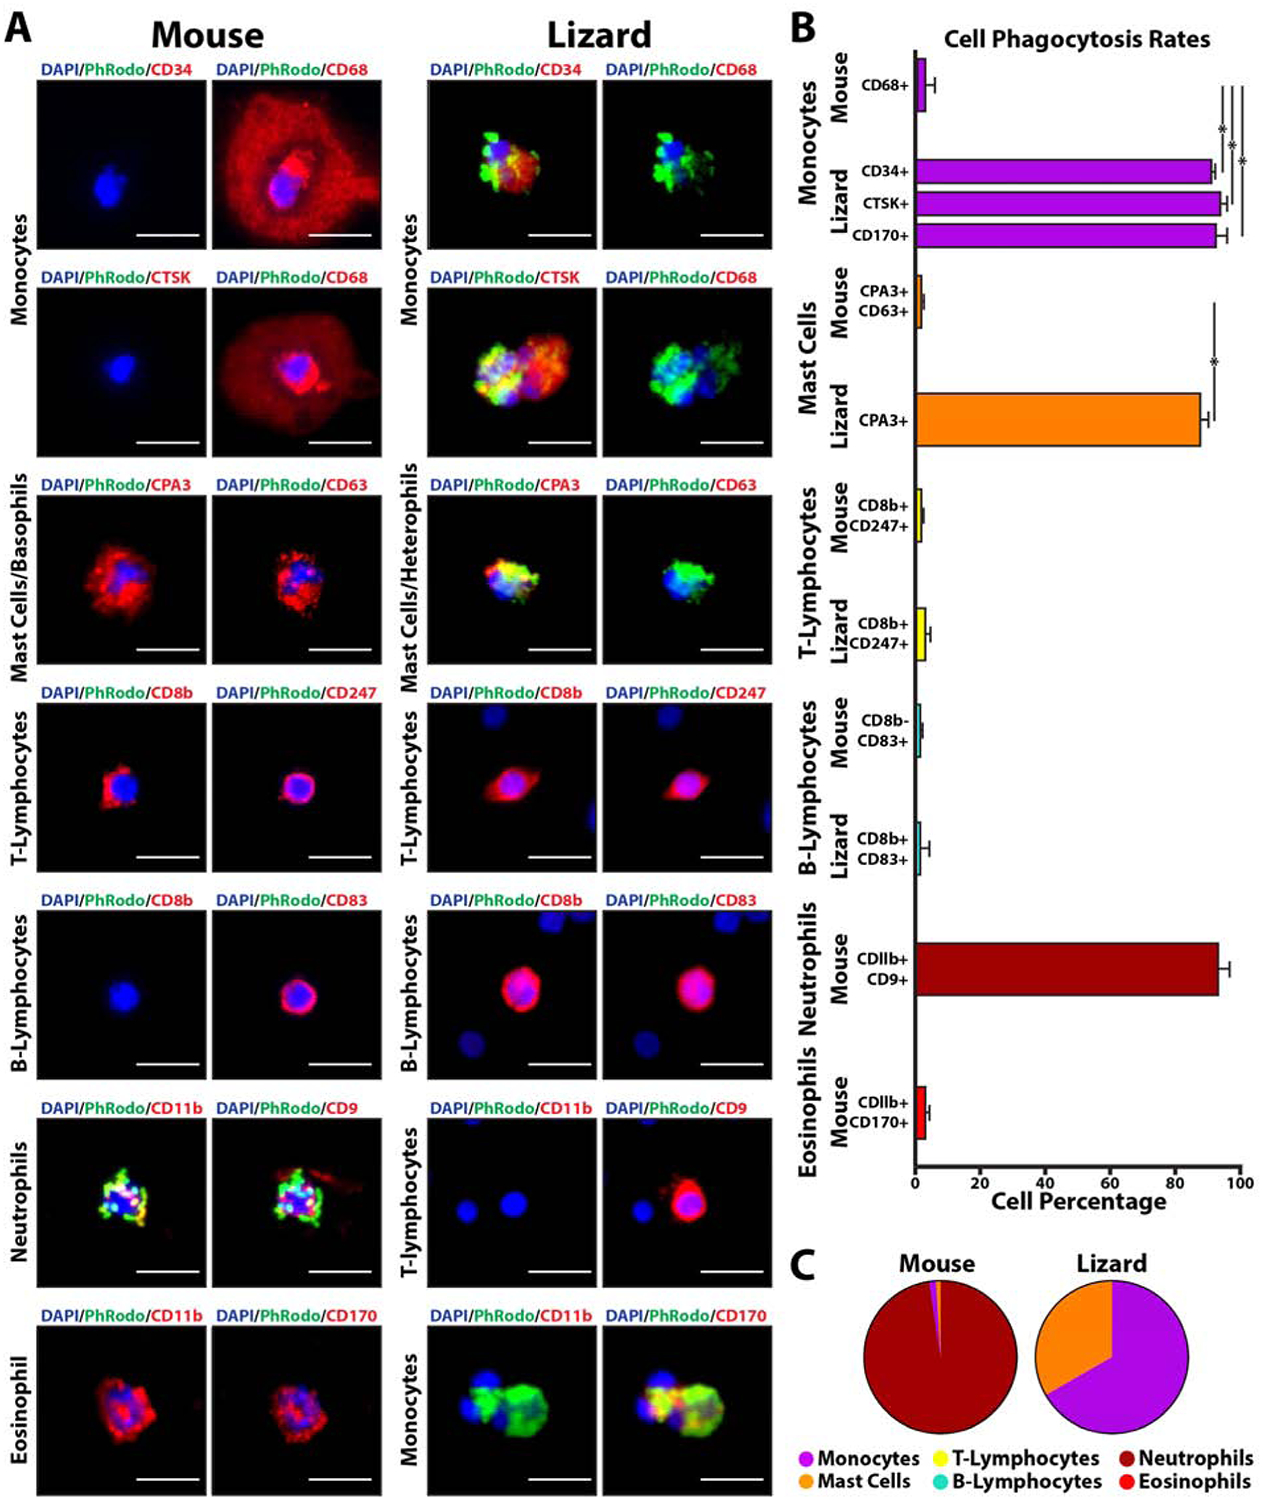
(A) Lizard and mouse peripheral blood cells co-analyzed by pHrodo phagocytosis assays and immunostaining. Signal from pHrodo bioparticles are presented in green, while immunostaining utilizing antibodies to various immune cell markers are shown in red. Cell classifications as monocytes, mast cells, T-lymphocytes, B-lymphocytes, neutrophils, and eosinophils are based on marker expression results (see text). Bar = 25 μm. (B) Histogram depicting quantification of phagocytosis rates of lizard and mouse immune cells separated by marker expression/cell type. Percentages for each cell type are presented (i.e. From the lizard monocyte section, ~92% of CD34+ cells are phagocytic). N=10. * p<0.001 (C) Pie charts presenting contribution percentages of each cell type to total number of mouse and lizard phagocytic cells (i.e. From the right pie chart, 68.2% of total lizard phagocytic cells are identifiable as monocytes). N=10.
Lizard peripheral blood cell population dynamics are altered in response to tail amputation.
Having established the tools for analyzing lizard blood cells populations by scRNAseq and immunostaining, we next investigated whether these populations were altered in response to tail amputation. Peripheral blood was collected before injury (0 DPA) and 3 days following tail amputation (3 DPA). This time point was chosen based on phagocytosis assays for peak activation of phagocytic cell populations. Tail amputation caused increases in monocytes (Cluster 1), basophils/mast cells (Cluster 2), and T lymphocytes (Cluster 3) (Fig. 5, SI Material Figure 5). B lymphocytes (Cluster 4) were not altered in response to tail amputation (Fig. 5, SI Material Figure 5). These results were validated with the lizard immune cell markers presented in Figure 4. Peripheral blood was collected from uninjured or 3 DPA lizards, immunostained for monocyte (CD34, CTSK, CD170), mast cell (CPA3), T lymphocyte (CD8b and CD247), and B lymphocyte (CD8b and CD83) markers, and positive cell numbers were quantified and compared between conditions (Fig. 5E). These experiments were repeated 5 times. The same trends observed in scRNAseq analyses were reflected in staining results. Tail amputation injury significantly increased peripheral blood monocytes, mast cells, and B-lymphocytes, while T lymphocyte levels were not significantly affected.
Figure 5: scRNAseq analysis of lizard peripheral blood cell samples before and after tail amputation.
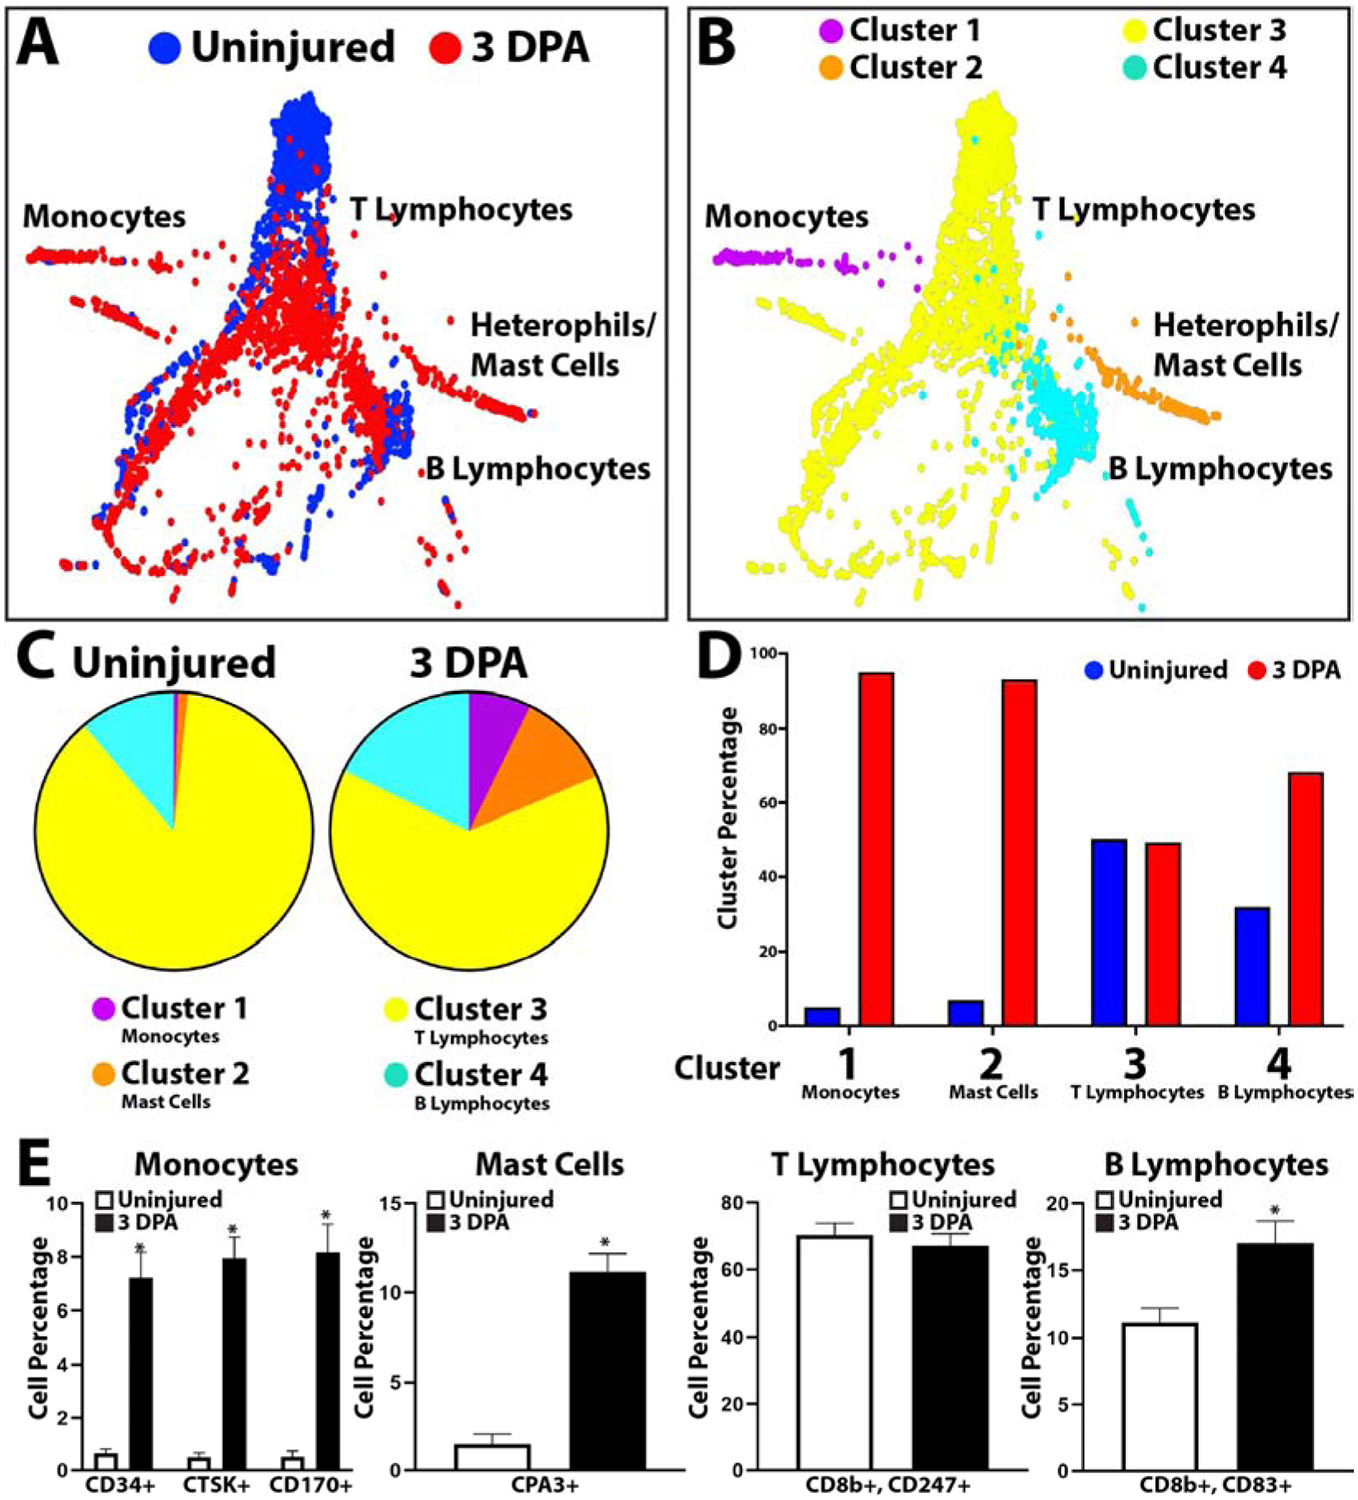
(A, B) TSNE plots of lizard blood cells collected at 0 and 3 DPA labelled according to (A) sample and (B) cluster. (C) Pie charts comparing relative cell cluster contributions of 0 and 3 DPA lizard blood samples. (i.e. From the left pie chart, 17.86% of peripheral blood cells collected from uninjured lizards belong to Cluster 4/B lymphocytes. (D) Histogram comparing cluster sizes between 0 and 3 DPA blood cell samples. Contribution percentages of uninjured and 3 DPA samples to each cluster are presented separately (i.e. From the Cluster 1/monocytes region, 6% of Cluster 1 cells/monocytes belong to the Uninjured samples set, while 94% belong to the 3 DPA sample set.) (E) Histograms depicting the effects of tail amputation injury on cell levels that immunostained positive for monocyte, mast cell, T lymphocyte, and B lymphocyte markers. Contribution percentages of each immunostained population to the total number or peripheral blood cells are presented separately for Uninjured and 3DPA samples (i.e. From the monocyte histogram, ~0.5% of blood cells immunostained positive for CD34 in uninjured blood samples, while ~7% of blood cells are positive for CD34 expression in 3 DPA samples.) N=5. * p<0.01, compared to Uninjured condition.
Treatment with clodronate liposomes alters lizard blood cell compositions.
Having shown that treatment with clodronate liposomes affects both blood cell phagocytosis and overall tail regeneration, we next applied scRNAseq analysis to blood collected from clodronate liposome-treated lizards towards identifying affected cell types. Peripheral blood was collected 3 DPA from lizards pre-treated with clodronate or PBS liposomes and compared by scRNAseq (Fig. 6, SI Material Figure 6). Treatment with clodronate caused reductions in monocytes (Cluster 1), heterophils/mast cells (Cluster 2) and increases in T lymphocyte (Cluster 3) and B lymphocyte (Cluster 4) populations (Fig. 6, SI Material Figure 6). These results were validated with quantifications of immunostained peripheral blood cells. Peripheral blood was collected from PBS and clodronate liposome treated lizard 3 DPA, immunostained for monocyte (CD34, CTSK, CD170), mast cell (CPA3), T lymphocyte (CD8b and CD247), and B lymphocyte (CD8b and CD83) markers, and positive cells were quantified and compared between conditions (Fig. 6E). These experiments involved 5 experimental replicates and supported the trends observed in scRNAseq analyses. Clodronate liposome treatment significantly decreased lizard peripheral blood monocyte and mast cell levels, increased B lymphocyte levels, and did not affect T lymphocyte levels.
Figure 6: scRNAseq analysis of the effects of clodronate liposome treatment on lizard blood cell populations.
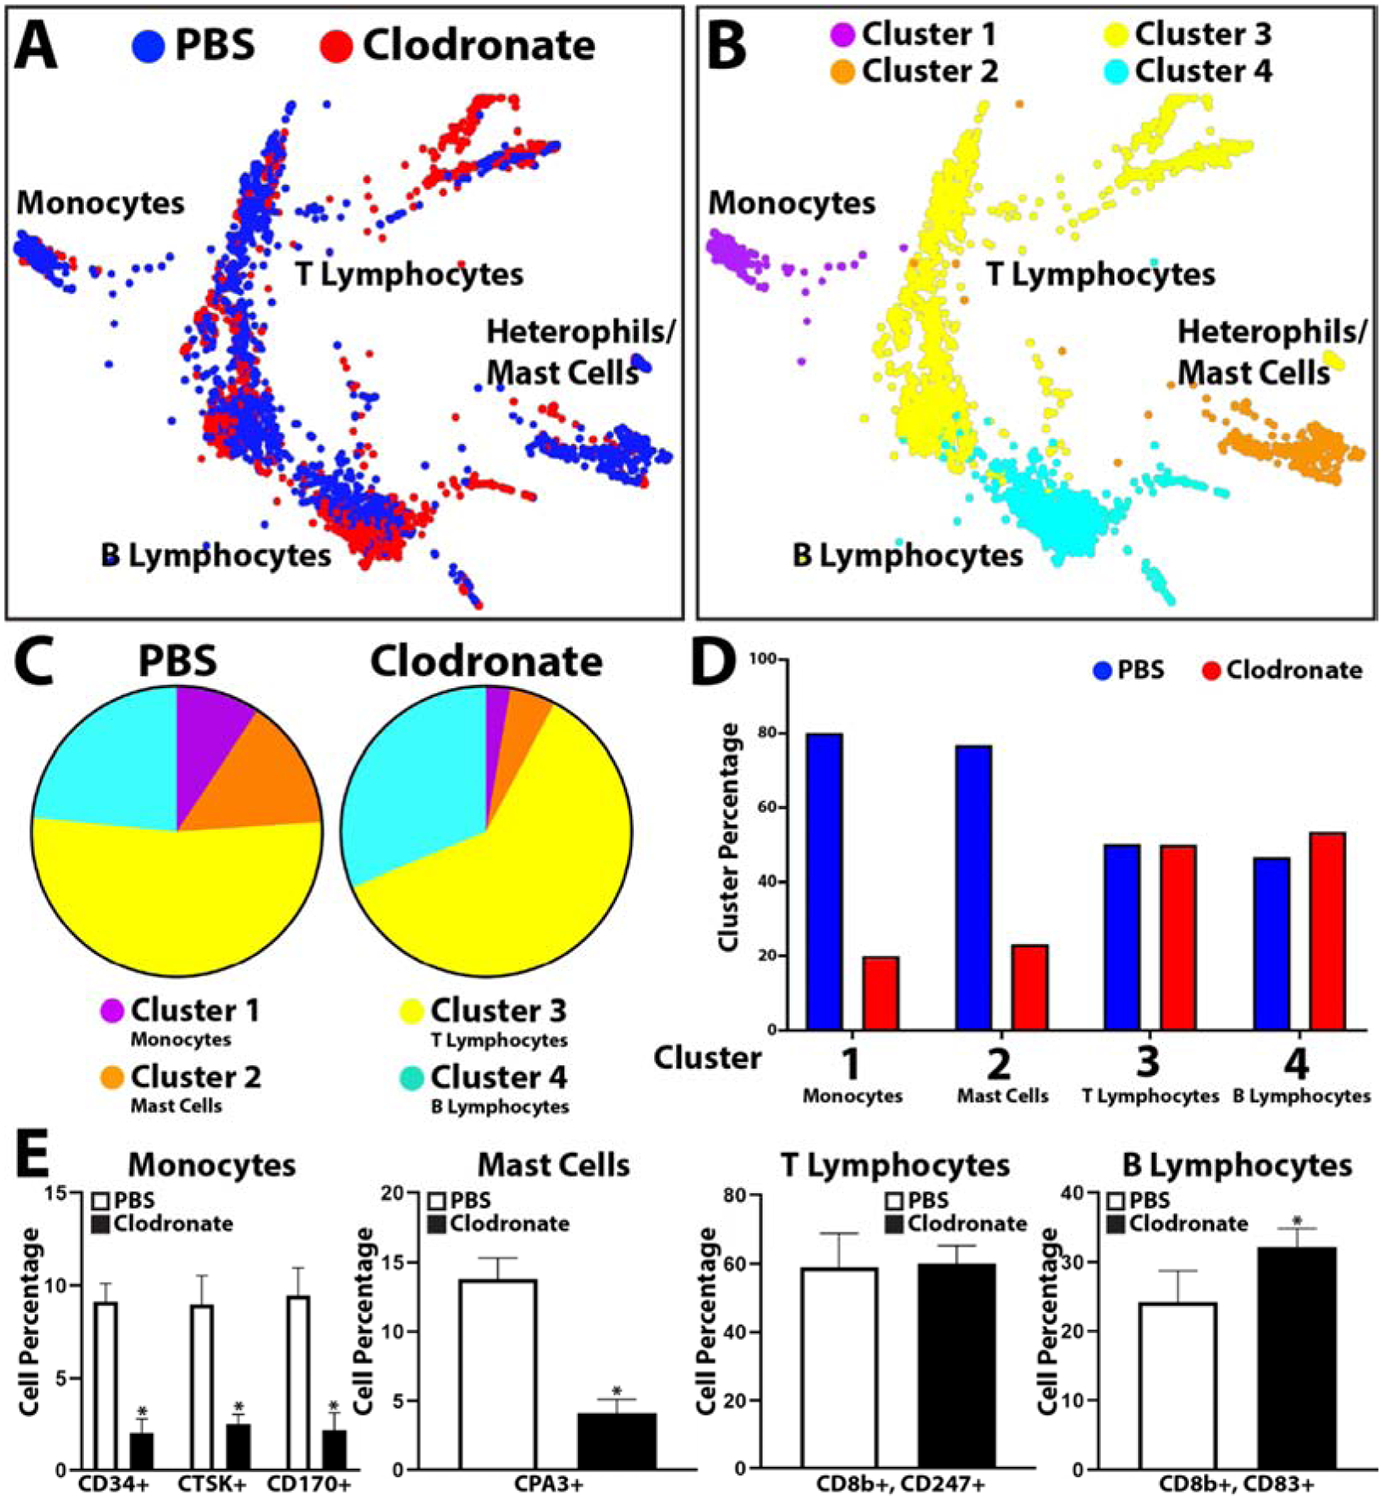
(A, B) TSNE plots of peripheral blood cells collected 3 DPA from lizards treated with PBS or clodronate liposomes labeled by (A) sample and (B) cluster. (C) Pie charts comparing relative cell cluster contributions of lizard PBS and clodronate liposome blood cell samples. (D) Histogram comparing cluster sizes between PBS and clodronate blood samples. (E) Histograms depicting the effects of tail amputation injury on cell levels that immunostained positive for monocyte, mast cell, T lymphocyte, and B lymphocyte markers. Contribution percentages of each immunostained population to the total number or peripheral blood cells are presented separately for PBS liposome and clodronate liposome samples (i.e. From the monocyte histogram, ~8.8% of blood cells immunostained positive for CD34 in PBS liposome blood samples, while ~1.8% of blood cells are positive for CD34 expression in clodronate liposome samples.) N=5. * p<0.01, compared to Uninjured condition.
Analysis of lizard bone marrow, peripheral blood, and regenerating tail tissue cells suggest a macrophage lineage of phagocytic blastema cells.
Having shown that phagocytic cells infiltrate the regenerating lizard tail (Fig. 1B) and are critical for tail regeneration (Fig. 2), we focused on identifying these tissue-resident phagocytic cells with the purpose of determining their contributions to tail regrowth. We began by verifying that lizard bone marrow precursors are capable of differentiating into phagocytic cells. We used mammalian macrophage isolation protocols to propagate macrophages in vitro. Following one week in macrophage selection medium, lizard bone marrow-derived macrophages were tested with phagocytosis assays and CD68 immunostaining and analyzed by microscopy and flow cytometry (SI Figure 7). Mouse bone marrow-derived macrophages were included as positive controls. Lizard macrophages isolated from bone marrow preparations cultured in selection medium exhibited morphologies similar to mouse macrophages and phagocytosed bioparticles. Comparisons via phagocytosis assays indicated similar phagocytosis rates between lizard and mouse bone marrow-derived macrophages, and both lizard and mouse macrophage preparations exhibited high CD68 expression. These results indicated bone marrow as a viable source of both lizard and mouse macrophage/progenitors in vitro and support similar differentiation and selection mechanisms for bone marrow-derived macrophages isolated from both species.
Bone marrow HSCs and blood monocyte scRNAseq data was isolated from 3DPA data sets via cell selection for CD34+ cells. (CD34 was shown to be a marker of lizard blood monocytes based on comparisons between lizard and mouse blood cell populations (Fig. 3)). Tissue-derived phagocytic cells were isolated from blastemas collected 7 DPA using fluorescence activated cell sorting (FACS) to select for cells labeled with DiI liposomes. ScRNAseq comparisons of bone marrow, peripheral blood, and blastema phagocytes revealed a linear progression from HSCs, through monocytes, to tissue macrophages (Fig. 7). HSCs expressed the markers CD34, GATA2, KIT, GFI1, MYB, and CXCR4. Monocytes expressed the markers CD34, FLT3, CTSK, CD170, CTSS, LY86, and LGALS1. Macrophages expressed CD68, CD9, MME, and PTEN and grouped into 3 main clusters. Cluster 1 expressed LGALS1, CD81, RANKL; Cluster 2 expressed LGALS1, SPI1, and IL10; Cluster 3 expressed CCR7, IL6, and TGFB1. These results illustrate HSCs, monocytes, and macrophages progression within the lizard myeloid lineage, suggesting a similar recruitment progression of lizard and mammalian macrophages beginning with bone marrow stem cells that differentiate into blood monocytes and, ultimately, contribute to diverse populations of tissue macrophages.
Figure 7: scRNASeq analysis of lizard HSCs, monocytes, and regenerating tail macrophages.
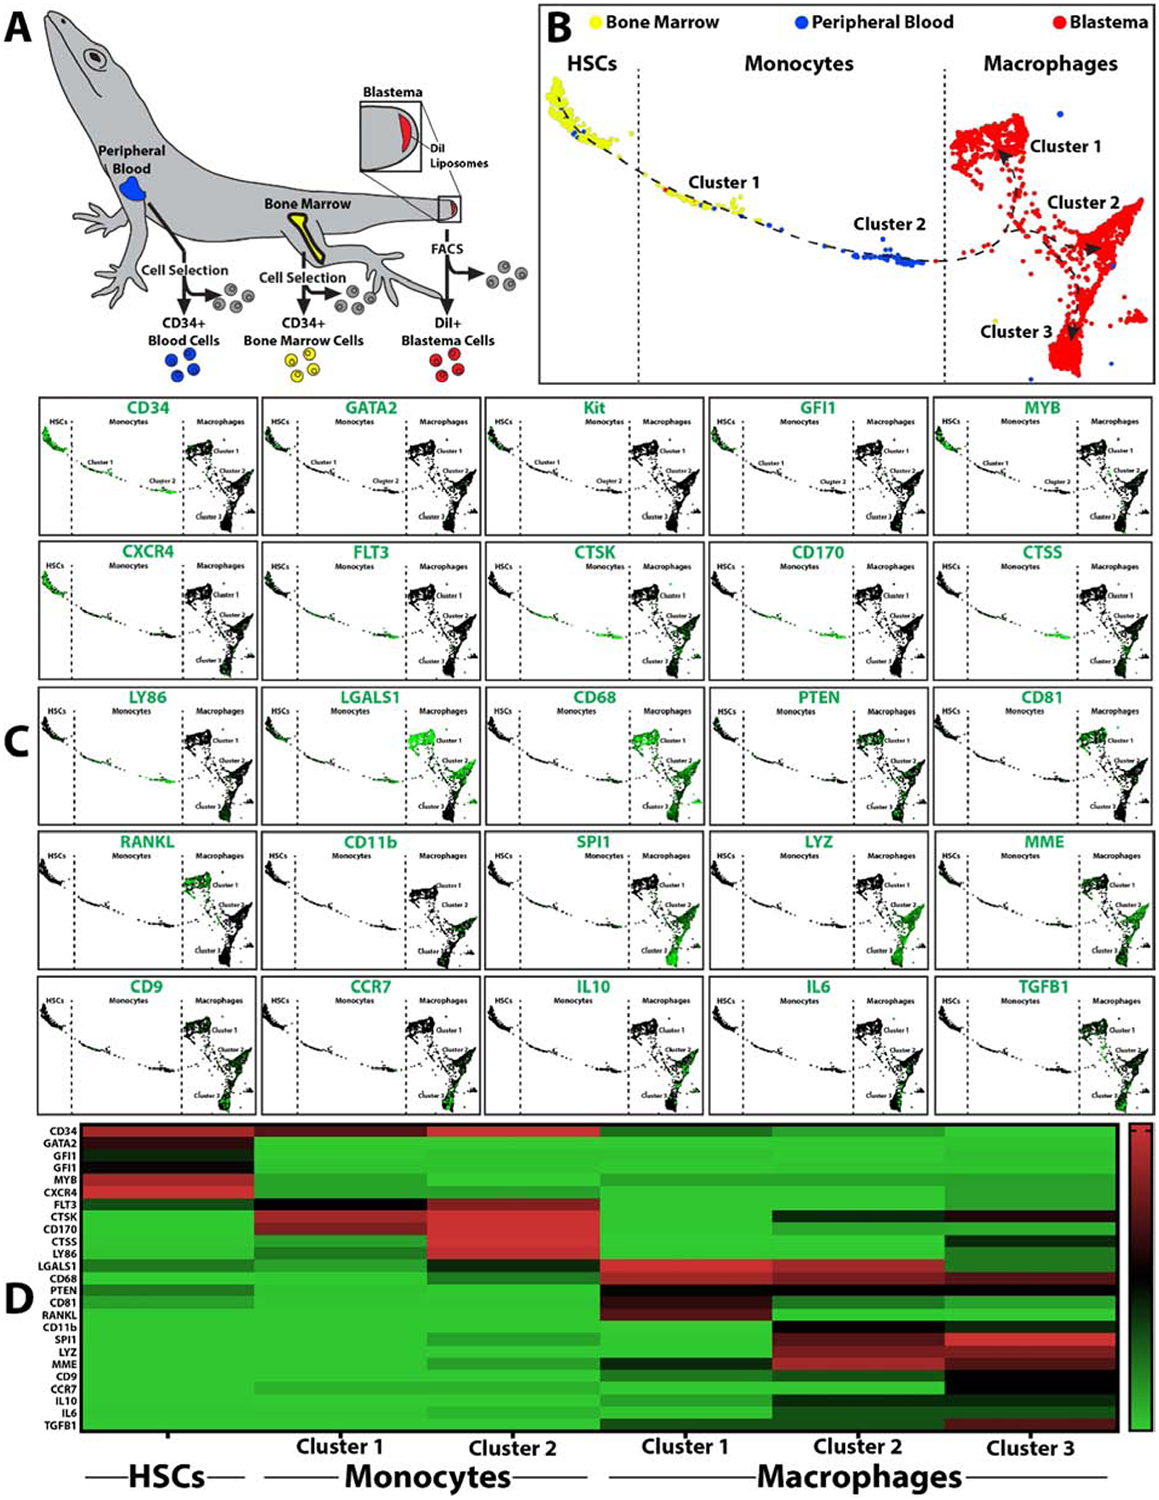
(A) Isolation scheme for lizard CD34+ bone marrow HSCs, CD34+ peripheral blood monocytes, and phagocytic blastema cells labeled with DiI liposomes. (B) TSNE plots of lizard bone marrow, peripheral blood, and blastema phagocytes collected 7 DPA from lizards treated with DiI liposomes. Dashed lines delineate populations into HSCs, monocytes, and macrophages based on marker analysis. (C) Expression analysis of select HSC, monocyte, and macrophage markers. (D) Heat map presenting distribution of select markers across HSC, monocyte, and macrophage populations and clusters.
Regenerating lizard tail macrophage populations contribute matrix metalloproteinases that are critical for tail regeneration.
Remodeling of the extracellular matrix is an important step in tissue regeneration and commonly involves simultaneous expression of new matrix proteins as well as a class of proteases known as matrix metalloproteases (MMPs).21 Furthermore, from the results presented in Figure 2, tissue remodeling takes the form of stump tissue ablation during early lizard regeneration in a process that involves phagocytes/macrophages. Blastema macrophage scRNAseq data sets were interrogated to determine whether lizard macrophages continued to contribute matrix molecules and proteases during the blastema stage of tail regrowth, finding that lizard macrophages exhibited high expression of genes related to extracellular matrix remodeling. All 3 blastema macrophage clusters expressed high levels of matrix metalloproteases such as MMP2, MMP12, MMP14, and MMP19. Macrophage cluster 1 also expressed high levels of matrix structural genes DCN, FN1, COL1A1, COL3A1, and COL8A1 (Fig. 8A). MMP2 expression of blastema macrophages was validated with histology; blastemas collected from three lizards treated with DiI liposomes were immunostained for MMP2 and analyzed by in situ zymography. MMP2 expression and cleaved gelatin co-localized to DiI-labeled blastema regions, indicating MMP activity in blastema phagocytic macrophage populations (Fig. 8B). In situ zymogram activity was significantly inhibited by the broad-spectrum MMP inhibitor GM6001, indicating that lizard blastema macrophage MMPs are responsive to inhibition by GM6001. The effects of MMP inhibition on overall lizard tail regrowth was tested by in vivo studies in which lizards were treated with GM6001 during 4 weeks of tail regeneration (Fig. 8C, D). Five experimental replicates were measured. GM6001 treatment significantly inhibited tail regrowth, reducing both regenerated tail length and area. Taken together, these results suggest that MMPs, which might be contributed by lizard tail blastema macrophages, are critical for normal tail regeneration.
Figure 8: Lizard blastema macrophages express matrix metalloproteinase that are required for tail regeneration.
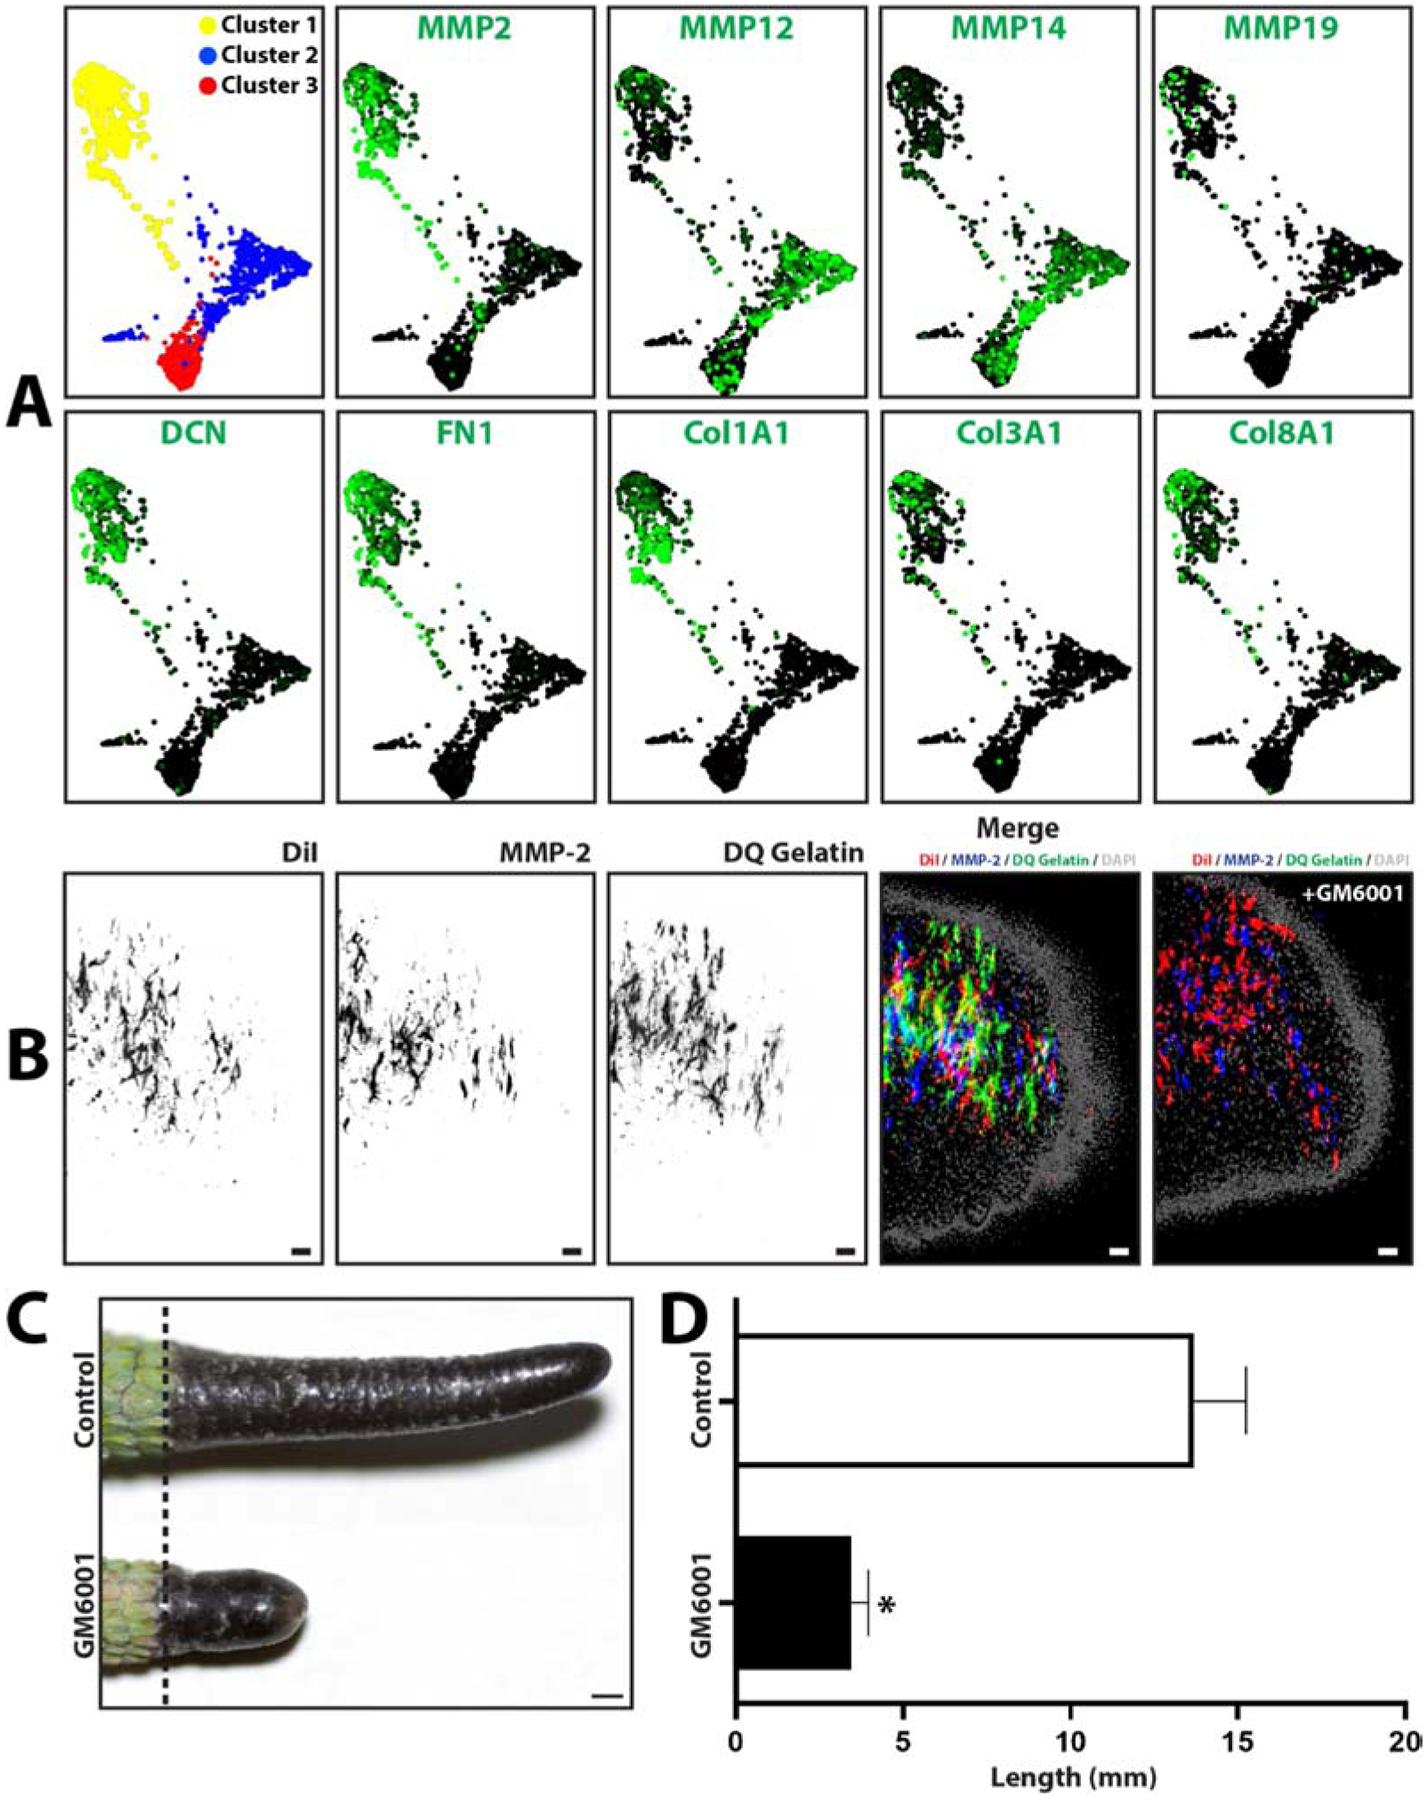
(A) TSNE plots generated from scRNAseq analysis of blastema phagocytic macrophage cells collected 7DPA from lizards treated with DiI liposomes. Macrophage cell populations grouped into 3 clusters, and expression analyses of select protease and extracellular matrix genes are presented. (B) Histological analysis of lizard tail blastemas immunostained for MMP2 expression and analyzed by in situ zymography. Macrophage cells are labeled with DiI liposomes. (C) Representative imaged of tails regenerated over 4 weeks by lizards treated with the broad-spectrum MMP inhibitor GM6001 or vehicle control. (D) Quantification of lizards tails regenerated by lizards treated with GM6001 and control. N=5. * p<0.05, compared to vehicle control condition (t-test).
DISCUSSION
In this study we use single cell transcriptomics to the study the role of the immune system in lizard tail regrowth - the only example of amniote appendage regeneration, focusing on the roles of phagocytes/macrophages in the regenerative process.
The study of complex biological processes such a regeneration in nontraditional model organisms like lizards presents several challenges that we sought to overcome with this work. For example, tail regeneration involves multiple cell types and complex interactions between populations. Previous work has analyzed the stages of lizard tail regeneration by “bulk” RNA sequencing22, which generates data representing an average of gene expression patterns across cells within a sample. Such analyses can obscure biologically relevant differences between cells, making observations of heterogeneous cell population behaviors impossible. The development of single cell sequencing technologies has overcome the challenges presented by heterogeneous cell samples through the generation of sequencing libraries mapped to individual cells. This unprecedented level of resolution allows for observations of cellular population dynamics that were practically impossible through other means. Single cell sequencing has been used to investigate salamander limb regeneration22, but this study is the first to apply scRNAseq to the topic of lizard tail regeneration.
Additional obstacles in the study of lizard tail regeneration, particularly with regard to immune cells, is the lack of information on cell markers for the various immune cell populations. Cell marker analysis has been vital to the study of mammalian cell immunology, and markers identifying cell types and subpopulations allow for sophisticated investigations into the functions of each. This study takes advantage of the defined identities of mouse blood cell types to educate our analysis of lizard blood scRNAseq data, thereby allowing for meaningful comparisons between the two species. Limitation to this approach involve the assumptions that the same genes regulate lizard and mouse immune cells similarly, and the identification of “lizard-specific” immune cell markers remains difficult. Still, this approach was able to detect important marker differences between lizard and mouse cells that extend to all major blood cell types. For example, the classic mammalian monocyte lineage marker CD68 was shown to be a specific marker of tissue-resident lizard macrophages, but not peripheral blood monocytes. Similarly, the mammalian T lymphocyte maker CD4 was not expressed by lizard T lymphocytes, and the marker CD8b was shown to be expressed by lizard B lymphocytes instead. Interestingly, the cathepsin family of protease were shown to be very useful markers for delineating lizard peripheral blood cell populations. Cathepsin K (CTSK) and cathepsin S (CTSS) were shown to be specific markers of lizard peripheral blood monocytes. Thus, one of the most impactful contributions of this study involves the identification of new markers for evaluating lizard immune cell scRNAseq data.
In applying scRNAseq techniques to investigate the effects of lizard tail amputation on immune cell population dynamics and the effects of these cells on tail regrowth, this study offers a unique perspective on the interactions of lizard immune cell state and tail regeneration. Using macrophage phagocytosis as a means for both labeling populations and studying cell behavior, we have provided the first links between phagocytes and lizard tail regrowth. Thus, this work adds to the ever-increasing evidence supporting the critical role macrophages play in tissue regeneration.
This work also presents the first side-by-side comparisons of lizard and mouse macrophages and phagocyte behavior. We have shown that lizard tail regeneration is supported by an early and significant increase in phagocytes/macrophages that secrete MMPs and extracellular matrix molecules. We also linked invasion of these cell populations with secretion of CTSK and ablation of tail stump vertebrae. This timed recruitment/invasion of macrophages to the lizard, but not mouse, tail stump has profound implications. Our current working hypothesis is that these recruited cells secrete proteases such as CTSK and MMP2, remodel matrix, and liberate stump cell populations that lay the foundation for blastema formation rather than scar formation. Future work will tease apart more of the contributions of these cells to the lizard tail environment and their effects of tail regrowth. Future work will also test the therapeutic applications of these findings towards improving mammalian wound healing. For example, perhaps making a mouse with a lizard-like macrophage response to tail amputation would exhibit reduced scar formation and the early stages of blastema formation.
The present study also provides evidence that macrophage isolation protocols validated for mammalian bone marrow cells are also applicable to lizard macrophages. Combined with the presented comparisons of bone marrow HSCs, blood monocytes, and blastema macrophages, and the transition of markers from one population to the next, these results offer evidence that at least some blastema macrophages originate in the bone marrow. In mammals, most tissue-resident macrophages seem to originate from fetal precursors that colonize developing organs and self-maintain with minimal bone marrow contribution24–28. However, upon injury, a surge of bone-marrow derived blood monocytes home to the wound site and differentiate into tissue macrophages29. Our results suggest that a similar bone marrow/blood/tissue progression for the macrophages that home to the regenerating lizard tail. Future work will determine whether lizard HSC, monocytes, and macrophages respond to the same activation and chemoattractant factors as their mammalian counterparts and whether any differences could be responsible for the divergent behaviors observed between macrophages from the two species. Interestingly, our data suggests that macrophage recruited to regenerating lizard tails persist long after peripheral blood monocyte levels fall, suggesting that, once inside tissues, lizard macrophage populations exist independently from blood monocytes. This phenomenon is evident in Figure 1 as discrepancies between the time course of phagocyte numbers detected in blood (Fig. 1A) and regenerating tail tissue (Fig. 1B, D). While blood cell phagocytosis rates decline precipitously after a spike at Day3 (Fig. 1A), tissue phagocytes remain detectable until Day 21 (Fig. 1B, C). Furthermore, recruited macrophages consistently occupy a centralized location associated with apical re-epithelialized regenerating tail regions, persisting from Day 3, before any new tail growth had occurs, until Day 21, during which the tail has elongated considerably. These observations suggest that lizard macrophage recruitment is highly specific to initial injury sites, and that the macrophages observed in regenerated tissue over the course of tail regrowth are derived from the same founding population. Future work will investigate this topic by lineage tracing macrophage populations from initial recruitment through blastema formation and tail regeneration.
In summary, this study presents the first detailed comparisons of lizard and mouse immune cells and highlights differences in phagocyte populations that underlie divergent regenerative potentials between these two species. Comparisons between lizard and mouse peripheral white blood cells by scRNAseq reveals that lizards lack much of the diversity in immune cell populations found in mice, particularly those related to the myeloid lineages. Indeed, possibly the most interesting facet of this study concerns the ramifications of the reduced diversity in lizard blood cell types, including how lizards compensate for “missing” immune cell populations. For example, neutrophils are the main phagocytic cell type found in mammalian blood, but scRNAseq analysis reveals that lizards lack blood populations that can be defined as neutrophils. How, then, does the lizard innate immune system function without neutrophils? Our results suggest that the phagocytic roles occupied by neutrophils in mammalian blood are filled by monocytes and mast cells/heterophils in lizard blood. Lizard monocytes were found to be particularly distinct from their mouse counterparts. For example, lizard peripheral blood monocytes appeared to exist in a more stem, undifferentiated state, expressing the classic HSC marker CD34 while lacking CD68 and CD11b, the markers typically associated with macrophage lineage commitments. Meanwhile, lizards, but not mice, mount an early phagocytic response to tail amputation, including a significant increase in peripheral blood monocytes and the recruitment of monocyte-derived macrophages that have profound impacts on subsequent tail regeneration. Future work will focus on the lizard monocyte as a key cell type responsible for the differences in immune reactions to tail amputation between lizards vs mice, and an attractive target for manipulating the tail regeneration process.
Supplementary Material
Highlights.
Tail amputation stimulates peripheral blood cell phagocytosis and recruitment of phagocytic cells to regenerating lizard tails.
Lizards, but not mice, exhibit a spike in phagocytic cell populations three days after tail amputation.
Comparing lizard and mouse peripheral blood by scRNAseq reveals reduced cell diversity in lizards.
Tail amputation alters lizard peripheral blood cell population dynamics.
Clodronate liposome treatment depletes lizard macrophages and inhibits tail regeneration.
Lizard bone marrow cells differentiate into macrophages similar to mouse cells.
Lizard macrophages express protease such as CSTK and MMP2 that are critical for tail regeneration.
ACKNOWLEDGEMENTS
We would like to acknowledge the University of Pittsburgh Genomic Research Core and the University of Southern California Molecular Genomics Core for their assistance in scRNAseq experiments. We would also like to thank Danielle Danucalov, Nicole Eng, Sara Kenes, Ashley Martier for their help in maintaining lizard and salamander colonies. We would like to acknowledge funding from NIH R01GM115444.
Footnotes
Publisher's Disclaimer: This is a PDF file of an unedited manuscript that has been accepted for publication. As a service to our customers we are providing this early version of the manuscript. The manuscript will undergo copyediting, typesetting, and review of the resulting proof before it is published in its final form. Please note that during the production process errors may be discovered which could affect the content, and all legal disclaimers that apply to the journal pertain.
The authors declare that they have no conflicts of interest.
REFERENCES
- 1.Godwin JW, Debuque R, Salimova E, Rosenthal NA. Heart regeneration in the salamander relies on macrophage-mediated control of fibroblast activation and the extracellular landscape. npj Regen Med. 2017;2(1):22. doi: 10.1038/s41536-017-0027-y [DOI] [PMC free article] [PubMed] [Google Scholar]
- 2.Petrie TA, Strand NS, Yang C-T, Rabinowitz JS, Moon RT. Macrophages modulate adult zebrafish tail fin regeneration. Development. 2015. doi: 10.1242/dev.120642 [DOI] [PMC free article] [PubMed] [Google Scholar]
- 3.Kamrin RP, Singer M. The influence of the spinal cord in regeneration of the tail of the lizard, Anolis carolinensis. J Exp Zool. 1955;128(3):611–627. doi: 10.1002/jez.1401280314 [DOI] [Google Scholar]
- 4.Londono R, Sun AX, Tuan RS, Lozito TP. TISSUE REPAIR AND EPIMORPHIC REGENERATION: AN OVERVIEW. Curr Pathobiol Rep. 2018;6(1):61–69. doi: 10.1007/s40139-018-0161-2 [DOI] [PMC free article] [PubMed] [Google Scholar]
- 5.Lozito TP, Tuan RS. Lizard tail skeletal regeneration combines aspects of fracture healing and blastema-based regeneration. Development. 2016;143(16):2946–2957. doi: 10.1242/dev.129585 [DOI] [PMC free article] [PubMed] [Google Scholar]
- 6.Bely AE, Nyberg KG. Evolution of animal regeneration: re-emergence of a field. Trends Ecol Evol. 2010;25(3):161–170. doi: 10.1016/j.tree.2009.08.005 [DOI] [PubMed] [Google Scholar]
- 7.Lozito TP, Tuan RS. Lizard tail regeneration: Regulation of two distinct cartilage regions by Indian hedgehog. Dev Biol. 2015;399(2):249–262. doi: 10.1016/j.ydbio.2014.12.036 [DOI] [PubMed] [Google Scholar]
- 8.MacLeod AS, Mansbridge JN. The Innate Immune System in Acute and Chronic Wounds. Adv Wound Care. 2015. doi: 10.1089/wound.2014.0608 [DOI] [PMC free article] [PubMed] [Google Scholar]
- 9.Larouche J, Sheoran S, Maruyama K, Martino MM. Immune Regulation of Skin Wound Healing: Mechanisms and Novel Therapeutic Targets. Adv Wound Care. 2018. doi: 10.1089/wound.2017.0761 [DOI] [PMC free article] [PubMed] [Google Scholar]
- 10.Baht GS, Vi L, Alman BA. The Role of the Immune Cells in Fracture Healing. Curr Osteoporos Rep. 2018. doi: 10.1007/s11914-018-0423-2 [DOI] [PMC free article] [PubMed] [Google Scholar]
- 11.Mescher AL, Neff AW. Regenerative capacity and the developing immune system. Adv Biochem Eng Biotechnol. 2005;93:39–66. [DOI] [PubMed] [Google Scholar]
- 12.Simkin J, Gawriluk TR, Gensel JC, Seifert AW. Macrophages are necessary for epimorphic regeneration in African spiny mice. Elife. 2017;6. doi: 10.7554/eLife.24623 [DOI] [PMC free article] [PubMed] [Google Scholar]
- 13.Rios FM, Zimmerman LM. Immunology of Reptiles. In: ELS.; 2015. doi: 10.1002/9780470015902.a0026260 [DOI] [Google Scholar]
- 14.Sicari BM, Dziki JL, Siu BF, Medberry CJ, Dearth CL, Badylak SF. The promotion of a constructive macrophage phenotype by solubilized extracellular matrix. Biomaterials. 2014. doi: 10.1016/j.biomaterials.2014.06.060 [DOI] [PubMed] [Google Scholar]
- 15.Weinreb C, Wolock S, Klein AM. SPRING: A kinetic interface for visualizing high dimensional single-cell expression data. Bioinformatics. 2018. doi: 10.1093/bioinformatics/btx792 [DOI] [PMC free article] [PubMed] [Google Scholar]
- 16.Han X, Wang R, Zhou Y, et al. Mapping the Mouse Cell Atlas by Microwell-Seq. Cell. 2018. doi: 10.1016/j.cell.2018.02.001 [DOI] [PubMed] [Google Scholar]
- 17.Hadler-Olsen E, Kanapathippillai P, Berg E, Svineng G, Winberg JO, Uhlin-Hansen L. Gelatin in situ zymography on fixed, paraffin-embedded tissue: Zinc and ethanol fixation preserve enzyme activity. J Histochem Cytochem. 2010. doi: 10.1369/jhc.2009.954354 [DOI] [PMC free article] [PubMed] [Google Scholar]
- 18.van Rooijen N, Hendrikx E. Liposomes for specific depletion of macrophages from organs and tissues. Methods Mol Biol. 2010. doi: 10.1007/978-1-60327-360-2_13 [DOI] [PubMed] [Google Scholar]
- 19.Danenberg HD, Fishbein I, Gao J, et al. Macrophage depletion by clodronate-containing liposomes reduces neointimal formation after balloon injury in rats and rabbits. Circulation. 2002. doi: 10.1161/01.CIR.0000023532.98469.48 [DOI] [PubMed] [Google Scholar]
- 20.Lozito TP, Tuan RS. Lizard tail regeneration: regulation of two distinct cartilage regions by Indian hedgehog. Dev Biol. 2015. doi: 10.1016/j.ydbio.2014.12.036 [DOI] [PubMed] [Google Scholar]
- 21.Xue M, Jackson CJ. Extracellular Matrix Reorganization During Wound Healing and Its Impact on Abnormal Scarring. Adv Wound Care (New Rochelle). 2015. doi: 10.1089/wound.2013.0485 [DOI] [PMC free article] [PubMed] [Google Scholar]
- 22.Hutchins ED, Markov GJ, Eckalbar WL, et al. Transcriptomic analysis of tail regeneration in the lizard Anolis carolinensis reveals activation of conserved vertebrate developmental and repair mechanisms. PLoS One. 2014. doi: 10.1371/journal.pone.0105004 [DOI] [PMC free article] [PubMed] [Google Scholar]
- 23.Gerber T, Murawala P, Knapp D, et al. Single-cell analysis uncovers convergence of cell identities during axolotl limb regeneration. Science (80- ). 2018. doi: 10.1126/science.aaq0681 [DOI] [PMC free article] [PubMed] [Google Scholar]
- 24.Mass E Delineating the origins, developmental programs and homeostatic functions of tissue-resident macrophages. Int Immunol. 2018. doi: 10.1093/intimm/dxy044 [DOI] [PubMed] [Google Scholar]
- 25.Shaw TN, Houston SA, Wemyss K, et al. Tissue-resident macrophages in the intestine are long lived and defined by Tim-4 and CD4 expression. J Exp Med. 2018. doi: 10.1084/jem.20180019 [DOI] [PMC free article] [PubMed] [Google Scholar]
- 26.Zhao Y, Zou W, Du J, Zhao Y. The origins and homeostasis of monocytes and tissue-resident macrophages in physiological situation. J Cell Physiol. 2018. doi: 10.1002/jcp.26461 [DOI] [PubMed] [Google Scholar]
- 27.Hoeffel G, Ginhoux F. Fetal monocytes and the origins of tissue-resident macrophages. Cell Immunol. 2018. doi: 10.1016/j.cellimm.2018.01.001 [DOI] [PubMed] [Google Scholar]
- 28.Epelman S, Lavine KJ, Randolph GJ. Origin and Functions of Tissue Macrophages. Immunity. 2014. doi: 10.1016/j.immuni.2014.06.013 [DOI] [PMC free article] [PubMed] [Google Scholar]
- 29.Koh TJ, DiPietro LA. Inflammation and wound healing: the role of the macrophage. Expert Rev Mol Med. 2011. doi: 10.1017/S1462399411001943 [DOI] [PMC free article] [PubMed] [Google Scholar]
Associated Data
This section collects any data citations, data availability statements, or supplementary materials included in this article.


