

Abstract
Background
Optic neuritis (ON) is the most common cause of acute unilateral visual loss in young adults and frequently occurs as the presenting symptom of multiple sclerosis (MS). Recently, we reported activation of peripheral blood CD19 + B-cells in the early stage of ON. In the current study we aimed to identify peripheral blood B-cell molecular markers associated with ON severity and visual outcome.
Methods
Expression of B-cell related biomarkers were analysed in patients with the first clinical presentation of acute unilateral ON. Logarithm of the Minimum Angle of Resolution (LogMAR). visual acuity, Optical Coherence Tomography (OCT) imaging, Expanded Disability Status Scale (EDSS) visual score and visual evoked responses were evaluated at onset and visual acuity and EDSS visual score were repeated at 6 months post-ON.
Results
Thirty patients with acute unilateral ON, 77% female, mean age 33 ± 2.0 years, were enroled in the study. Expression of CD19, CD79A and CD20 B-cell markers significantly correlated with LogMAR visual acuity of the affected eye (r = 0.44, p = 0.01, r = 0.37, p = 0.01 and r = 0.36, p = 0.04, respectively). The marker levels were elevated between 1.5 and 2.2-folds in the group with worse visual acuity (LogMAR>1.0) at onset (CD79A:×1.5, p = 0.013; CD19:×2.25, p = 0.007; CD20:×1.5, p = 0.015) and not correlated with 6 month visual outcome.
Conclusions
Among patient with a first event of acute ON, expression of B-cell biomarkers correlated with the severity of the disease. These results could add information on the role of B-cell dysfunction in the early stages of ON.
Subject terms: Inflammation, Autoimmune diseases
Introduction
Optic neuritis (ON) is the most common cause of acute unilateral visual loss in young adults with an incidence of 1–5 cases in 100,000 cases per year [1]. In most individuals ON is caused by inflammatory demyelination as an isolated syndrome or in association with multiple sclerosis (MS) [2]. Clinically, vision loss develops within hours and may worsen within the following days and is accompanied by pain, reduced central acuity, diminished colour vision and central scotoma, with a relative afferent pupillary defect [3]. In 20% of patients with MS, ON is the presenting symptom and about three quarter of the patients with isolated ON will develop MS within 15 years [2]. MS is mostly diagnosed in the third and fourth decade of life, hence the availability of reliable predictors of long-term prognosis is extremely important [4].
The mechanism of insult in ON is an inflammatory demyelination process, yet the operating triggering components are unclear [5]. The clinical prognostic markers for increased risk of disability (e.g., male gender, older age, progressive onset, etc.) do not offer real advantages in terms of prediction potential as they are not modifiable risk factors, they do not directly reflect biological processes, and do not generally distinguish between responders and non-responders to treatment. The complex interaction between genetic background and environmental exposure likely determines the vast clinical heterogeneity of MS expression, making a challenge to predict the clinical course at the individual level [4].
A previous work by our group expanded these observations using gene expression analyses. We found that apoptosis-related pathways were the most significant biological processes involved in acute relapse of MS and correlated with the severity of relapse. Regulation of apoptosis, caspase activity, and caspase regulation genes were significantly downregulated in acute MS relapses [6].
The clinical outcome of patients with ON is not evident at presentation. Therefore, identifying molecular markers associated with ON severity and visual outcome may improve our diagnostic capabilities and influence management. Our research group previously evaluated the molecular pathways that play a role in the early phase of ON and found that CD19 B-cells have a significant role in the pathogenesis of acute ON [5]. This B-cell involvement may also predict clinical outcomes. Therefore, the aim of this study was to further examine the correlation between clinical severity of ON at onset and peripheral blood B-cell activity.
Materials and methods
Study design
A cross-sectional study in two tertiary referral centres. The study was approved by Sheba and Wolfson IRB committees and all patients signed written informed consent.
Subjects
Consecutive patients with the first clinical presentation of acute unilateral ON, without previous neurological symptoms were recruited from the Multiple Sclerosis Center, Sheba Medical Center and the ophthalmic department at the Wolfson medical centre during the years 2015–2016. Inclusion criteria were as follows: (1) age between 18 and 40 years; (2) diagnosis of ON based on unilateral visual loss worse than 20/40 associated with dyschromatopsia, afferent pupillary defect, and central/paracentral visual field defect; (3) no prior neurological symptoms of any kind; (4) time from the onset of visual symptoms to blood sampling of up to two weeks and before steroid treatment. All subjects underwent comprehensive neurological examination and disability was scored by the Expanded Disability Status Scale (EDSS) and visual functional system score was obtained. Patients were treated with intravenous methylprednisolone administration following a constant protocol.
Clinical assessment
Each patient underwent blood sampling for ON related evaluation during hospitalisation up to three days from admission and up to two weeks from onset of symptoms. The evaluation included erythrocyte sedimentation rate, thyroid function tests, antinuclear antibodies, and anti-AQP4 antibody. In addition, the blood sampling underwent B-cell related marker analysis, which results were not known to the doctors treating the patient. Visual examination including visual acuity, visual fields, visual evoked potentials and Optical Coherent Tomography (OCT). OCT was performed using an OCT-3 scanner (Heidelberg Engineering GmbH, Germany) by applying Fast RNFL protocol consisting of three circular 3.4 mm diameter scans centred on the optic disc. A complete neurological examination was performed and an EDSS score and a visual functional score were assigned and recorded. Visual acuities are expressed using the Logaritm of the Minimum Angle of Resolution (LogMAR) On the LogMAR scale a value of 0.0 corresponds to excellent visual acuity, equivalent to 6/6 or 20/20 in the Snellen notation, while a LogMAR value of 1.0 is equivalent to a visual acuity of 6/60 or 20/200 (Snellen) [7].
Gene expression analyses
Peripheral blood mononuclear cells (PBMC) were separated on ficol-hypaque gradient. Total RNA was obtained from PBMC using TRlzol®. RNA quality was assessed using Experion Automated Electrophoresis Station and quantified by fiberoptic spectrophotometry using the Nanodrop ND-1000 and expression of four B-cell related biomarkers CD19, CD20, CD79A and IgMC were analysed by Affymetrix QuantiGene Plex Assay according to the manufacturer’s manual (Quantigene Plex 2.0 Assay, Affymetrix, Santa Clara, CA, http://www.affymetrix.com). This hybridisation-based assay provides high-throughput solution for multiplexed gene expression quantitation. Specifically, 0.25 µ of total RNA was transferred to the assay’s hybridisation plate (Abgene, Pittsburg) for 18–22 h at 54 ± 1 °C, with shaking at 600 rpm and then transferred to magnetic separation plate (Nunc catalogue no. 269620), washed by magnetic bead washer (Affymetrix P/N QP0702), removing all unbound materials and 100 μl of 2.0 preamplifier working reagent was added to each assay well, incubated for 1 h at 50 ± 1 °C and 600 rpm. The unbound 2.0 preamplifier was removed, and beads were washed three times with 100 μl of wash buffer. This was followed by incubation with 2.0 Amplifier working reagent, followed by label probe working reagent, and finally followed by SAPE working reagent. Signals from the beads were measured with a Luminex FlexMap three-dimensional instrument (Luminex Corp., Austin, TX, http://www.luminexcorp.com). Expression levels of GAPDH and HPRT1 were used as internal controls. Data were analysed with StarStation software (Applied cytometry Systems, Sheffield, UK Applied Cytometry Systems, Sheffield, UK).
Statistical analysis
Data presented as mean ± standard deviation (SD). Clinical parameters distributions were tested for normality by the Shapiro–Wilk test. Independent and paired T tests were conducted for continuous variables with a normal distribution and Wilcoxon signed–rank test and the Mann–Whitney-U test for variables with a non-normal distribution. Bivariate correlation was calculated to assess relationships between blood expression biomarkers and clinical outcome parameters using Pearson correlation for continuous variables with a normal distribution and Spearman test for variables with a non-normal distribution. Recovery of visual acuity was calculated as the difference between visual acuity at onset and after 6 months of follow up in the affected eye. Patients with visual recovery of 0.5 LogMAR were defined as having favourable visual recovery. Power calculations showed that a minimum of 21 participants were required to detect a clinically significant difference of 0.5 LogMAR lines with a two-sided significance level of 0.05 and a power of 80% using a paired model. Statistical analysis was performed using SPSS (version 22.0). P values less than 0.05 were considered statistically significant.
Results
Clinical assessment
Thirty patients, 76% females, mean age 33 ± 2.0 years, with the first onset of acute ON were included in this study. Mean visual acuity of the affected eye at onset was 1.19 ± 0.15 LogMAR (equal to a Snellen score of 20/270), suggestive of severe visual impairment. After 6 months visual acuity improved and mean LogMAR was 0.24 ± 0.08 (Snellen score of 20/32). Specifically, 24 patients showed visual improvement, three had not improved and three patients visually deteriorated (by a mean of 0.154 ± 0.13 LogMAR). At the end of the follow-up period 19 patients (63%) achieved full or nearly full (20/25 or better) visual acuity (Fig. 1).
Fig. 1.

Baseline and follow-up VA compared with marker level. Arrows indicate change from baseline VA to VA following 6 months. a CD19, b CD20, c CD79. Note that most arrows point left, indicating improvement (lower LogMAR indicates better vision); in addition, there is greater improvement with higher marker levels. Values of biomarker expression levels are provided relative to the expression levels of housekeeping genes. VA visual acuity
The mean visual function by EDSS score at onset was 2.2 ± 0.2 and improved to 0.85 ± 0.17 (p = 2.5E-06) at 6 months follow up. In the affected eyes the mean RNFL was 87.2 ± 11.0 µm, mean macular retinal thickness was 234.7 ± 7.6 µm, mean visual latencies P75, P100 and P145 were 78 ± 43 ms, 139 ± 15 ms and 162 ± 24 ms, respectively. Taken together, these findings are suggestive of acute visual impairment affecting the optic nerve. Clinical parameters at baseline are detailed in Table 1.
Table 1.
Clinical characteristics of patients with a first demyelinating event of acute ON at baseline
| Variable | Value N = 30 | SD |
|---|---|---|
| Females, N (%) | 23 (76) | |
| Age, years | 33 | 11 |
| VA (LogMAR)a | 1.1 | 0.2 |
| VA (Snellen)a | 20/270 | |
| Mean RNFL thickness (µm) | 77.2 | 2.0 |
| Mean macular retinal thickness (µm) | 235.0 | 7.6 |
| Latency | ||
| N 75 | 78 | 43 |
| P 100 | 139 | 15 |
| N 145 | 162 | 24 |
| EDSS Score, Median | 2 | 1 |
SD standard deviation, VA visual acuity, RNFL retinal nerve fibre layer, IQR interquartile range
aAffected eye
Biomarkers associated with severity of ON onset
At onset, the expression of CD19, CD79A and CD20 B-cell markers significantly correlated with LogMAR visual acuity of the affected eye (r = 0.44, p = 0.01, r = 0.37, p = 0.01 and r = 0.36, p = 0.04, respectively, Fig. 1). Patients with a more severe ON presenting with LogMAR visual acuity >1.0, mean 1.85 ± 0.17, were characterised by overexpression of B-cell related biomarkers CD19, CD79A and CD20 as compared with patients with LogMAR visual acuity <1.0 (mean 0.53 ± 0.06), with p = 0.013, p = 0.018 and p = 0.022, respectively.
The marker levels were elevated between 1.5 and 2.2-folds higher in the group with worse visual acuity at onset (CD79A: × 1.5, p = 0.013; CD19: × 2.2, p = 0.007; CD20: × 1.5, p = 0.015).
Levels of CD19 and CD20 also correlated with P145 latency of the affected eye (r = 0.55, p = 0.009 and r = 0.41, p = 0.05), however not with P75 and P100 latency (P > 0.05).
To test for the specificity of the findings, we repeated the analysis using EDSS scores. Patients with a more severe ON that presented with higher EDSS visual score of 3, 4 and 5, were characterised by overexpression of B-cell CD19 and CD79A related biomarkers as compared with patients with EDSS visual score of 1 and 2 (p = 0.009 and p = 0.01).
B-cell markers CD19 and CD79A and B-cell product IgMC significantly correlated with EDSS visual score at onset (r = 0.46, p = 0.01; r = 0.41, p = 0.02 and r = 0.42, p = 0.02).
In female patients the correlation between ON severity at onset and B-cell markers remained significant (CD19: r = 0.50, p = 0.01; CD79A: r = 0.43, p = 0.03; IgMC: r = 0.45, p = 0.03).
Biomarkers associated with clinical outcome
At 6 months follow-up most patients achieved almost full visual recovery (n = 25 had 20/40 or better). Patients with worse visual acuity at onset (LogMAR > 1.0) achieved relatively similar visual outcomes at follow-up compared with those with better visual presentation (0.106 ± 0.15 vs 0.383 ± 0.60, p = 0.096). Correspondingly, patients with worse onset showed further improvement as illustrated in Fig. 1 [2].
B-cell markers did not differ between patients with full recovery at 6 months (n = 19) compared with those with partial recovery and between patients with no improvement at all (n = 6, 3 stable and 3 declined) to those with any improvement (n = 24) (P > 0.05 for all comparisons). Only positive trend for better VA recovery were observed in patients with higher expression of B-cell markers at onset (Fig. 2).
Fig. 2.
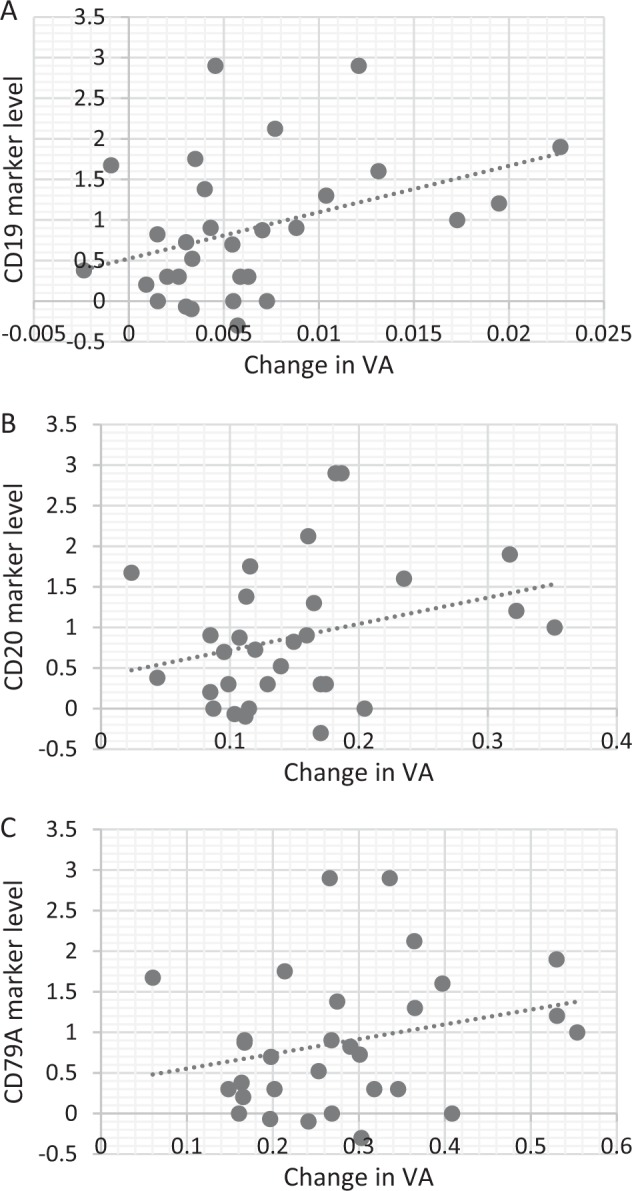
Visual acuity recovery and marker levels. Scatter plots detailing visual acuity recovery and marker levels. Notice the positive trend in VA recovery compared with higher marker levels. a CD19, b CD20 and c CD79A. Values of biomarker expression levels are provided relative to the expression levels of housekeeping genes. VA, visual acuity
We further isolated the group of patients with persistent visual impairment (worse than 20/40 after 6 months, n = 5, 17%) and compared them to patients which achieved better visual acuity (20/40 or better, n = 25, 83%). No significant differences in marker levels were observed (P > 0.05 for all comparisons) and a multivariant analysis revealed no significant predictors of visual impairment after 6 months.
Discussion
In the current study we analysed the expression of B-cell related biomarkers in patients with the first clinical presentation of acute unilateral ON and without previous neurological symptoms. Our study has found that severity of acute ON correlated with higher expression levels of B-cell associated biomarkers CD19, CD20, CD79A. This correlation remained significant on gender sub-analysis. As autoimmune processes are more frequent in females compared with males, this gender effect, found in our study, may further indicate that males and females differ in the pattern of disease and recovery [8].
By studying gene expression, we have recently demonstrated the significant role that B cells play in the pathogenesis of the first demyelinating event of acute ON which then progress to MS [5]. Examination of B-cell gene expression profile in acute ON revealed an arch of operating mechanisms including cell activation, antigen uptake, antigen presentation, and immunoglobin production4. Identifying molecular markers associated with clinical outcomes has the potential to improve our diagnostic capabilities, our assessment of disease severity and to influence management.
B lymphocytes play an important role in the pathogenesis of MS as they regulate the autoimmune response and participate in the development of the demyelinating lesions within the brain [9]. Previous studies have shown that B-cell homoeostasis and function within the central nervous system are related to development and course of clinically definite MS [10]. In addition, the presence of oligoclonal bands within the cerebrospinal fluid is a marker of B-cell activation and predicts conversion from a clinically isolated syndrome to clinically definite MS and correlates with MRI activity, onset of relapses, and disability progression [10].
One of biomarkers seen to be overexpressed in our study was CD79. A targeted anti-CD79 antibody exists which seems to induce a B-cell anergic-like state that protects against autoimmunity [11]. Considering the elevated levels of CD79 seen in our study population, the influence of this antibody during the acute onset phase of ON might provide important insights. Other innovative treatment with monoclonal antibodies targeting CD19 or combined CD19/CD3 (Blinatumomab) [12] are reported to reduce disease activity [13]. Moreover, Rituximab mouse chimeric anti CD20 antibody showed efficacy in newly diagnosed relapsing remitting (RR) MS patients [14]. In addition, Ocrelizumab, a humanised monoclonal antibody targeting the CD20 marker in B cells had just showed, in three phase 3 trials, beneficial effects in RR or primary progressive MS patients [15]. Since our results indicate that higher B-cell marker levels are associated with ON severity the role of targeted antibodies in therapy should be a subject for further research.
Our findings that patients with worse presenting visual acuity, and elevated B-cell marker levels, had further recovery can be straightforwardly explained by the ceiling effect which may prevent further improvement in patients with only minimal injury. Thus it is possible that patients with higher B-cell marker levels had a worse clinical presentation with more impaired visual acuity, and so their recovery was also larger in its extent compared with patients with lesser visual impairment [16].
This study has several limitations. First, differences in marker expression could be related to the time since onset, until blood was withdrawn (few hours and up to 72 h). Second, as patients initiated steroid treatment when the diagnosis was made, we were not able to follow the expression of the markers and evaluate the dynamics with time. Third, we assume that there is a common pathogenesis to the process leading to ON and MS involving B cells. Since the patients that will develop MS are still unknown, the conclusion about the common process is yet to be checked.
To conclude, severity of acute ON at onset was correlated with higher levels of B-cell associated biomarkers. These results suggest that ON assessment might be aided by B-cell related markers and that the role of targeted therapy should be a subject for further research.
Summary
What was known before
B cells play a significant role in the pathogenesis acute ON, yet the details of operating components are unclear.
What this study adds
The severity of acute optic neuritis was correlated with levels of B-cell associated biomarkers.
B-cell activity might be a possible target for future therapy in optic neuritis.
Acknowledgments
Funding
This study was supported by a research grant from the Claire and Amedee Maratier Institute for the Study of Blindness and Visual Disorder, Sackler Faculty of Medicine, Tel-Aviv University, Israel.
Compliance with ethical standards
Conflict of interest
The authors declare that they have no conflict of interest.
Footnotes
Publisher’s note Springer Nature remains neutral with regard to jurisdictional claims in published maps and institutional affiliations.
References
- 1.Pau D, Al Zubidi N, Yalamanchili S, Plant GT, Lee AG. Optic neuritis. Eye. 2011;25:833–42. doi: 10.1038/eye.2011.81. [DOI] [PMC free article] [PubMed] [Google Scholar]
- 2.Voss E, Raab P, Trebst C, Stangel M. Clinical approach to optic neuritis: pitfalls, red flags and differential diagnosis. Ther Adv Neurol Disord. 2011;4:123–34. doi: 10.1177/1756285611398702. [DOI] [PMC free article] [PubMed] [Google Scholar]
- 3.Kaur P, Bennett JL. Optic neuritis and the neuro‐ophthalmology of multiple sclerosis. Int Rev Neurobiol. 2007,79:633–63. [DOI] [PubMed]
- 4.Gajofatto A, Calabrese M, Benedetti MD, Monaco S. Clinical, MRI, and CSF markers of disability progression in multiple sclerosis. Dis Markers. 2013;35:687–99. doi: 10.1155/2013/484959. [DOI] [PMC free article] [PubMed] [Google Scholar]
- 5.Feldman A, Gurevich M, Huna-Baron R, Achiron A. The role of B cells in the early onset of the first demyelinating event of acute optic neuritis. Investig Ophthalmol Vis Sci. 2015;56:1349–56. doi: 10.1167/iovs.14-15408. [DOI] [PubMed] [Google Scholar]
- 6.Achiron A, Feldman A, Mandel M, Gurevich M. Impaired expression of peripheral blood apoptotic-related gene transcripts in acute multiple sclerosis relapse. Ann N Y Acad Sci. 2007;1107:155–67. doi: 10.1196/annals.1381.017. [DOI] [PubMed] [Google Scholar]
- 7.Bailey IL, Lovie-Kitchin JE. Visual acuity testing. From the laboratory to the clinic. Vis Res. 2013;90:2–9. doi: 10.1016/j.visres.2013.05.004. [DOI] [PubMed] [Google Scholar]
- 8.Harbo HF, Gold R, Tintoré M. Sex and gender issues in multiple sclerosis. Ther Adv Neurol Disord. 2013;6:237–48. doi: 10.1177/1756285613488434. [DOI] [PMC free article] [PubMed] [Google Scholar]
- 9.Wekerle H. B cells in multiple sclerosis. Autoimmunity. 2017;50:57–60. doi: 10.1080/08916934.2017.1281914. [DOI] [PubMed] [Google Scholar]
- 10.Disanto G, Morahan JM, Barnett MH, Giovannoni G, Ramagopalan SV. The evidence for a role of B cells in multiple sclerosis. Neurology. 2012;78:823–32. doi: 10.1212/WNL.0b013e318249f6f0. [DOI] [PMC free article] [PubMed] [Google Scholar]
- 11.Hardy IR, Anceriz N, Rousseau F, Seefeldt MB, Hatterer E, Irla M, et al. Anti-CD79 antibody induces B cell anergy that protects against autoimmunity. J Immunol. 2014;192:1641–50. doi: 10.4049/jimmunol.1302672. [DOI] [PMC free article] [PubMed] [Google Scholar]
- 12.Hoffman L, Gore L. Blinatumomab, a Bi-specific anti-CD19/CD3 BiTE® antibody for the treatment of acute lymphoblastic leukemia: perspectives and current pediatric applications. Front Oncol. 2014;4:63. 10.3389/fonc.2014.00063. [DOI] [PMC free article] [PubMed]
- 13.Naddafi F, Davami F. Anti-CD19 monoclonal antibodies: a new approach to lymphoma therapy. Int J Mol Cell Med. 2015;4:143–51. [PMC free article] [PubMed] [Google Scholar]
- 14.Granqvist M, Boremalm M, Poorghobad A, et al. Comparative effectiveness of rituximab and other initial treatment choices for multiple sclerosis. JAMA Neurol. 2018;75:320–7. doi: 10.1001/jamaneurol.2017.4011. [DOI] [PMC free article] [PubMed] [Google Scholar]
- 15.Hohlfeld R, Meinl E. Ocrelizumab in multiple sclerosis: markers and mechanisms. Lancet Neurol. 2017;16:259–61. doi: 10.1016/S1474-4422(17)30048-0. [DOI] [PubMed] [Google Scholar]
- 16.Shechter R, London A, Varol C, Raposo C, Cusimano M, Yovel G, et al. Infiltrating blood-derived macrophages are vital cells playing an anti-inflammatory role in recovery from spinal cord injury in mice. PLoS Med. 2009;6:e1000113. doi: 10.1371/journal.pmed.1000113. [DOI] [PMC free article] [PubMed] [Google Scholar]