Abstract
Background and Aims
Soil salinization and aridification are swiftly engulfing the limited land resources on which humans depend, restricting agricultural production. Hydroxy-3-methylglutaryl coenzyme A reductase (HMGR) is important in the biosynthesis of terpenoids, which are involved in plant growth, development and responses to environmental stresses. This study aimed to provide guidance for producing salt- and drought-resistant poplar.
Methods
A protein expression system was used to obtain PtHMGR protein, and high-performance liquid chromatography was used to detect the activity of PtHMGR protein in vitro. In addition, a simplified version of the leaf infection method was used for transformation of ‘Nanlin895’ poplar (Populus×euramericana). qRT–PCR was used to identify expression levels of genes.
Key Results
PtHMGR catalysed a reaction involving HMG-CoA and NADPH to form mevalonate. Overexpression of PtHMGR in Populus × euramericana ‘Nanlin895’ improved drought and salinity tolerance. In the presence of NaCl and PEG6000, the rates of rooting and survival of PtHMGR-overexpressing poplars were higher than those of wild-type poplars. The transgenic lines also exhibited higher proline content and peroxidase and superoxide dismutase activities, and a lower malondialdehyde level under osmotic stress. In addition, the expression of genes related to reactive oxygen species (ROS) scavenging and formation was altered by osmotic stress. Moreover, the effect of osmotic stress on transcript levels of stress-related genes differed between the transgenic and wild-type poplars.
Conclusion
PtHMGR catalysed a reaction involving HMG-CoA and NADPH to form mevalonate in vitro. Overexpression of PtHMGR promoted root development, increased the expression of ROS scavenging-related genes, decreased the expression of ROS formation-related genes, and increased the activity of antioxidant enzymes in transgenic poplars, enhancing their tolerance of osmotic stress. In addition, overexpression of PtHMGR increased expression of the stress-related genes KIN1, COR15 and AAO3 and decreased that of ABI, MYB, MYC2 and RD22, enhancing the stress resistance of poplar.
Keywords: HMGR, terpenoids, Populus trichocarpa, drought tolerance, salinity tolerance, ROS
INTRODUCTION
Plant secondary metabolism is the result of the interaction of plants with the environment. Secondary metabolites play an important role in the self-protection, survival and competitiveness of plants and coordinate their interactions with the surrounding environment. Compounds consisting of isoprene units and their derivatives are the most widely distributed and complex secondary metabolites in nature (Markus et al., 2000; Yonekura et al., 2009). Many isoprene compounds participate in the physiological activities of organisms and the synthesis of pigments during plant growth and development. Plant hormones regulate growth, development and defence against biotic and abiotic stresses (Wu et al., 1997). For example, abiotic stress responses are relevant to the production of reactive oxygen species (ROS) in plant cells. Volatile isoprenoids can alleviate the effects of oxidative stress by regulating the oxidative state of plants (Vickers et al., 2009). Volatile isoprenoids can also alleviate oxidation and thermal stress in plants and promote both direct and indirect defence by regulating signals of the biochemical activation of defence pathways (Loreta and Schnitzler, 2010). In addition, carbon is allocated to stress-induced volatile compounds, which play a significant role in protecting plants from abiotic stresses (Mithöfer and Boland, 2012; Loreto et al., 2014) In plants, terpenoids are synthesized by the methylerythritol phosphate (MEP) and mevalonate pathways (Yu and Utsumi, 2009). Based on their locations, the mevalonate pathway is known as the cytoplasmic pathway and the MEP pathway as the plastid pathway (Estevez et al., 2001). The mevalonate and MEP pathways also synthesize isopentenyl diphosphate (IPP) and dimethylallyl diphosphate (DMAPP) precursors, as well as the terpenoids required for growth and development (Schwender et al., 2001; Miziorko, 2011). Hydroxy-3-methylglutaryl coenzyme A reductase (HMGR) is the first and rate-limiting enzyme in the mevalonate metabolic pathway and catalyses the reaction of 3-hydroxy-3-methyl-glutaric coenzyme A (HMG-CoA) with NADPH to produce the intermediate metabolite methyl valerate. The synthesis of IPP and its allylic isomer DMAPP is the first step in both the mevalonate and the MEP pathway (Maldonado et al., 1992). The mevalonate pathway is responsible for producing sesquiterpenoids, sterols and secondary triterpenes (Leivar et al., 2011), whereas the MEP pathway is primarily responsible for synthesis of monoterpenoids, diterpenoids, essential photosynthesis pigments and plastidial quinones. Plants have two ABA (as a sesquiterpene compound) synthesis pathways; the indirect pathway is responsible for the production of most ABA. 9-Cis-epoxy carotenoid dioxygenase (NCED) is a rate-limiting factor in the biosynthesis of ABA (Finkelstein, 2013). In plants, the NCED expression level is positively correlated with ABA content (Christmann et al., 2005). Higher plants under stress have an increased endogenous ABA content, resulting in a series of responses, e.g. solute outflow and stomatal closure of guard cells. ABA has the most significant response to drought and salt stress (Chaves et al., 2003). In addition, the increased ABA content of plants under osmotic stress results in upregulation of various downstream genes, e.g. P5CS (Székely et al., 2008) and KIN1 (Xiong et al., 2002). Environmental changes can suppress plant growth and development (Ahuja et al., 2010). Abiotic stresses include drought, high temperature, low temperature, nutrient deprivation, excessive salt and heavy metals. Drought, salt and temperature stresses affect the geographical distribution of plants and limit agricultural yields. Plants perceive abiotic stresses through specific sensors and in response alter their growth, metabolism and development (Ahuja et al., 2010). Therefore, improving the stress tolerance of plants is critical for enhancing agricultural yields and for environmental sustainability. Poplar is an economically important forest tree species that grows in temperate and cold-temperate regions of the northern hemisphere. Also, poplar as a model woody plant has been widely used in scientific research since the announcement of the poplar genome (Tuskan et al., 2006), and genetic engineering has often been used to modify poplars for adaptation to a variety of environments. However, the characterization and function of HMGR of Populus trichocarpa, which codes for the rate-limiting enzyme, has remained unclear. Research on poplar HMGR would enhance our understanding of the mevalonate and MEP pathways and facilitate forest-tree breeding programmes. In this study we cloned HMGR of P. trichocarpa and analysed the structure and function of HMGR. We also analysed PtHMGR expression in plant parts and the effect of abiotic stresses on its expression. In addition, we evaluated the effect of PtHMGR overexpression on plant antioxidant levels and the expression of osmotic stress-related genes and of genes related to the ABA-mediated response to osmotic stress. These data enhance our understanding of PtHMGR function and provide us with a theoretical basis for genetic improvement of poplar.
MATERIALS AND METHODS
Plant materials and treatments
Populus trichocarpa and Populus × euramericana ‘Nanlin895’ were cultured in half-strength Murashige and Skoog (MS) medium under a 16 h light/8 h dark cycle at 23 °C and 74 % humidity. Populus trichocarpa seedlings were subcultured after 1 month for an additional 1 month. Subsequently, P. trichocarpa seedlings were treated with 200 μm ABA, 200 μm salicylic acid (SA), 200 μm jasmonic acid (JA), 2 mm hydrogen peroxide (H2O2), 200 mm NaCl or 10 % PEG6000. Total RNA was extracted from samples using the Plant Mini RNA Kit (TaKaRa, Japan).
Cloning of PtHMGR and bioinformatics analysis
The MMLV reverse transcriptase and forward and reverse primers (Supplementary Data Table S1) were used to amplify cDNA using poly(A)-enriched mRNA from leaves and the open reading frame (ORF) of PtHMGR. The PCR system was as follows: 2.0 µL cDNA as template, 2 µL forward and reverse primers (10 μmol), 1 µL dNTPs (10 mm), 5.0 µL 10× PCR buffer (Mg2+ plus), 0.5 µL rTaq DNA polymerase (Takara, Japan) and 38.5 µL ddH2O. The PCR procedure was as follows: 95 °C for 10 min; 35 cycles of 95 °C for 2 min, 56 °C for 2 min and 72 °C for 2 min; and finally 72 °C for 10 min. We amplified the 5′ and 3′ UTR regions by RACE PCR with specific primers (Supplementary Data Table S1). For PCR product identification we used 1 % agarose gel and an Axygen DNA purification kit (Suzhou, China) was used to purify PCR products. After purification, all PCR products were cloned into the sequencing vector pEASY-T3 (TransGen Biotech, China) and sequenced by Nanjing GenScript (Nanjing, China). Subsequently, a phylogenetic tree of HMGR was constructed and the three-dimensional structure of PtHMGR was determined according to the methods described by Zhang et al. (2017).
Vector construction and PtHMGR production
Depending on the analysis of restriction sites PtHMGR gene, BamHI and NotI were chosen as the restriction sites. Forward and reverse primers (Supplementary Data Table S1) were designed and the PCR procedure was performed as description above. Digestion with BamHI and NotI and ligation of PtHMGR yielded the recombinant vectors PET-28a-PtHMGR and PET-32a-PtHMGR, which were transformed into Escherichia coli BL21 (DE3), and PPICZα-A-PtHMGR, which was transformed into Pichiapastoris GS115.
Cells harbouring the PET-28a-PtHMGR and PET-32a-PtHMGR vectors were cultured in 100 mL of Luria–Bertani medium at 37 °C with shaking at 220 r.p.m. When the absorbance reached 0.6, 1.0 mm isopropyl-β-d-1-thiogalactopyranoside (IPTG) was added to induce production of PtHMGR. Following incubation for a further 4 h, the mixtures were resolved by 12 % SDS–PAGE.
Recombinant P. pastoris GS115 containing PPICZα-A-PtHMGR was cultured in 100 mL of buffered glycerol complex medium at 30 °C with shaking at 250 r.p.m. When the absorbance reached 2.0, we performed concentration at 5000 r.p.m. for 20 min at room temperature. The cells were resuspended in buffered methanol complex medium to an absorbance of ~1.0, transferred to a 1-L shake flask and incubated at 28 °C with shaking at 250 r.p.m. Methanol was added at 24-h intervals to a final concentration of 0.5–2 %. After centrifugation, the supernatant was analysed by SDS–PAGE to determine the optimal culture duration and inducer concentration. Following centrifugation at 4 °C, PtHMGR was purified using a His-tag column and its identity was confirmed by western blotting with rabbit anti-His antibody as the first antibody and anti-rabbit IgG (TransGen Biotech) as the second antibody.
Assay of PtHMGR activity
PtHMGR activity was assayed using reaction mixtures containing 2.5 mmol K2HPO4 (pH 7.2), 5 mmol KCl, 1 mmol EDTA, 5 mmol DTT, 1 mg/mL PtHMGR and H2O to 1 mL. The mixtures were heated in a water bath at 37 °C for 30 min and 30 mmol NADPH and 0.3 mmol HMG-CoA were added; the control lacked PtHMGR. The mixtures were incubated at 30 °C for 30 min and the reaction was terminated by the addition of 100 μL of 6 mol L−1 HCL. Finally, the mixture was passed through a 0.22-μm membrane and analysed using a Thermo TSQ 8000 EVO mass spectrometer.
High-performance liquid chromatography (HPLC; Shimadzu LC20A) conditions were as follows: solvents, 0.1 % formic acid, water and methanol; column temperature, 30 °C; flow rate, 0.3 mL min−1; and a Waters XBridge C18 3.5 μm, 2.1 × 150 mm column. The mass spectrometer (Thermo TSQ 8000 EVO) conditions were as follows: SCIEX triple TOF 5600+ m/z range, 50–1200; ion collection, IDA pattern; and second level, CE 35, CES 20 and an information-dependent acquisition (IDA) pattern to collect ions.
Quantitative reverse transcriptase–polymerase chain reaction
In order to analyse PtHMGR expression level in various tissues, we extracted RNA from mature and young leaves, upper and lower stems, petioles and roots (Supplementary Data Fig. S1). In addition, RNA was extracted from P. trichocarpa leaves treated different stress conditions and then reverse-transcribed to form cDNA. A pair of specific primers (Supplementary Data Table S1) and SYBR Green Master Mix (Roche) were used for quantitative reverse transcription–polymerase chain reaction (qRT–PCR) amplification of PtHMGR. Three independent biological experiments were performed. Ptactin (accession number XM-006370951.1) was used as the internal reference. Fold changes in expression levels were calculated by the ΔΔCT method (fold change = 2−[ΔΔCT]) (Livak and Schmittgen, 2001). Real-time RT–PCR reactions were performed using SYBR Green Mix (Roche) under the following conditions: initial incubation at 95 °C for 5 min followed by 40 cycles of 30 s at 95 °C and 30 s at the annealing temperature of 60 °C. Three independent biological experiments were performed.
Transformation of Populus × euramericana ‘Nanlin895’ and screening of transgenic lines
The ORF of PtHMGR was inserted into the vector pENTR/D-TOPO and subsequently into the destination vector pGWB9. The recombinant vector pGWB9-PtHMGR was transformed into Agrobacterium EHA105 and transgenic poplar lines were generated by the method of leaf infecting (Zhang et al., 2017).
The seedlings were cultured in screening differentiation medium (MS medium supplemented with 30 mg mL−1 kanamycin, 200 mg mL−1 cefotaxime, 30 g L−1 sucrose, 8 g L−1 agar, 0.5 mg L−1N-6-benzyladenine and 0.002 mg L−1 thidiazuron at pH 5.8) and screening bud elongation medium (MS medium supplemented with 20 mg mL−1 kanamycin, 200 mg mL−1 cefotaxime, 30 g L−1 sucrose, 8 g L−1 agar, 0.5 mg L−1N-6-benzyladenine and 0.002 mg L−1 thidiazuron at pH 5.8) and subsequently transferred to screening rooting medium (half-strength MS medium supplemented with 10 mg mL−1 kanamycin, 200 mg mL−1 cefotaxime, 30 g L−1 sucrose and 8 g L−1 agar at pH 5.8). Genomic DNA and RNA were isolated from the leaves of ten putative transgenic lines and subjected to PCR to verify whether PtHMGR was present in poplar chromosomes and could be expressed. The PCR reaction was carried out under the following conditions: 95 °C for 10 min; 35 cycles of 95 °C for 2 min, 58 °C for 2 min and 72 °C for 2 min; and 72 °C for 10 min. PCR products were visualized on a 1 % agarose gel. Subsequently, real-time qRT–PCR was carried out to reveal the transcript levels of PtHMGR in the transformants and WT poplars. The reaction conditions and reaction system for real-time qRT–PCR used for the transformants and WT poplars were as described above. Three independent biological experiments were performed.
Phenotypic analysis of transgenic poplar
Two-month-old T1 seedlings were transferred to half-strength MS medium without (control) or with 50, 100 or 150 mm NaCl or 1, 2 or 3 % PEG6000 for 1 month. Next, root length was evaluated (three plants of each line were used for each NaCl concentration and PEG6000 concentration). Following treatment for 20 d with 100 mm NaCl and 2 % PEG6000, leaves were subjected to RNA extraction for analysis of transcript levels of indole-3-acetaldehyde oxidase (AAO3), ABA-insensitive 1 (ABI1), cold-regulated 15A (COR15A), KIN, MYB, MYC2 and responsive to dehydration 22 (RD22) (the forward and reverse primers are shown in Supplementary Data Table S1). The reaction conditions and reaction system for real-time qRT–PCR used for the transformants and WT poplars were as described above. Three independent biological experiments were performed.
Transplantation of WT and transgenic poplar and assay of salt- and drought-stress tolerance
Two-month-old WT and transgenic poplars cultured in a greenhouse were transplanted to pots containing soil mixed with sterilized peat and perlite (2:1) and grown under long-day conditions (16 h light/8 h dark) at 24 °C for 5 months. Next, the plants were irrigated for 2 weeks with a solution containing 200 mm NaCl. Drought stress was induced by withdrawing irrigation for 2 weeks. The poplars were grown under long-day (16 h light/8 h dark) conditions.
The leaves were collected and RNA was extracted and subjected to qRT–PCR analysis of the transcript levels of ascorbate peroxidase (APX), catalase (CAT), glutathione S-transferase (GST), superoxide dismutase (SOD), respiratory burst oxidase homologue protein A (RbohA) and RbohB (the forward and reverse primers are shown in Supplementary Data Table S1). In addition, the effects of drought and salt stress on the proline and malondialdehyde (MDA) levels and the activities of SOD and peroxidase (POD) were evaluated using a microplate reader (Bio-Rad).
ABA-mediated signal transduction
Drought, salt and low and high temperatures increase the accumulation of ABA, an important hormone in plant responses to abiotic stresses. Indeed, the ABA signalling pathway is pivotal in plant responses to drought and high salt levels (Zhu, 2000). Higher plants synthesize ABA by direct and indirect pathways. In the direct pathway, mevalonate is converted to ABA in a manner dependent on pyrophosphate. In the indirect pathway, ABA is generated by oxidative cleavage of a carotenoid precursor; this is the major ABA synthesis pathway Seo and Koshiba, (2002). The rate-limiting enzymes in ABA synthesis are NCED and zeaxanthin (Zhang et al., 2009; Sun et al., 2012; Jing et al., 2018). We evaluated the expression levels of genes related to the mevalonate and MEP pathways and ABA synthesis-related genes (forward and reverse primers are shown in Supplementary Data Table S1) in WT and transgenic poplars. The reaction conditions and reaction system for real-time qRT–PCR used for the transformants and WT poplars were as described above. Three independent biological experiments were performed.
RESULTS
Molecular cloning and sequence analysis of PtHMGR
The ORF of PtHMGR (XP_002317026.1) was 1767 bp and encoded 588 amino acids (Supplementary Data Fig. S2). The molecular weight of PtHMGR was 62.7 kDa and its isoelectric point was 6.24. PtHMGR contained multiple active domains at the C-terminus: two HMG-CoA-binding domains, EMPVGYIQIP and TTEGCLVA; and two NADP(H)-binding domains, DAMGMNMV and VGTVGGGT (Supplementary Data Fig. S3). The conserved domains were consistent with the reported structural characteristics of plant HMGR proteins. In addition, the C-terminal amino acid sequences were highly conserved, while those at the N-terminus were not (Supplementary Data Fig. S3).
Three-dimensional structure and phylogenetic tree of PtHMGR
The three-dimensional structures of the HMGRs of P. trichocarpa, Arabidopsis thaliana, Nicotiana tabacum, Oryza sativa and Zea mays were determined. The HMG-CoA- and NADPH-binding domains were conserved, and their spatial structures were similar (Supplementary Data Fig. S4). PtHMGR showed 73.27, 64.63, 62.96 and 41.03 % similarity with the HMGRs of N. tabacum, O. sativa, A. thaliana and Z. mays, respectively (Supplementary Data Fig. S4).
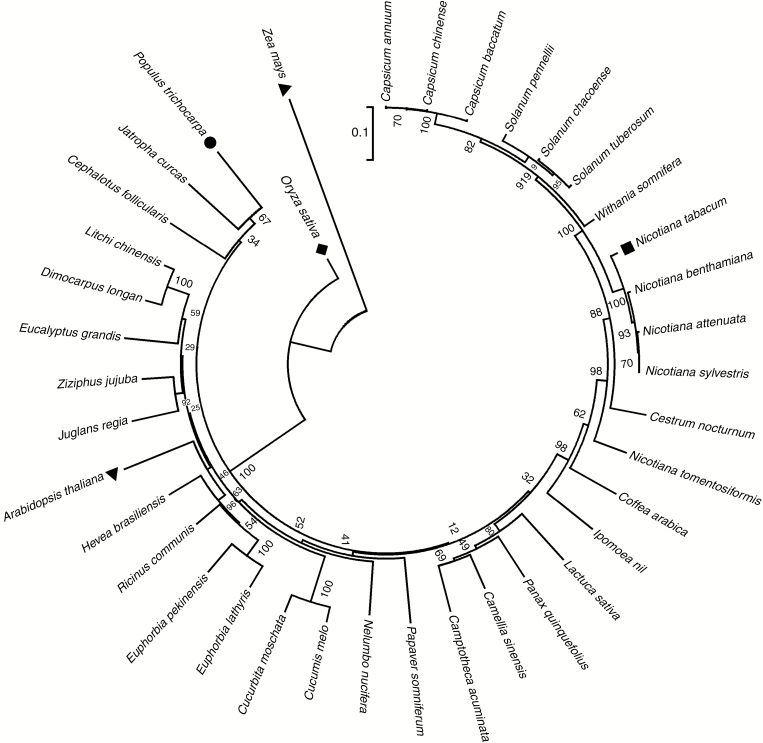
In the phylogenetic tree of PtHMGR and 37 other HMGRs, PtHMGR was clustered with Jatropha curcas and Cephalotus follicularis (Fig. 1). Because plant HMGRs are relatively conserved, this will be useful for studies of genetic differentiation and molecular evolution.
Fig. 1.
Phylogenetic tree of PtHMGR and other HMGRs. The GenBank accession numbers of the HMGRs are as follows: Populus trichocarpa, XM_002316990.2; Arabidopsis thaliana, NM_106299.4; Camellia sinensis, KF649853.1; Camptotheca acuminata, AAB69727.1; Capsicum annuum, XM_016704840.1; Capsicum baccatum, MLFT02000002.1; Capsicum chinense, CIT02000002.1; Cephalotus follicularis, BDDD01003560.1; Cestrum nocturnum, KY703396.1; Coffea arabica, HQ540670.1; Cucumis melo, NM_001297451.1; Cucurbita moschata, XM_023090472.1; Dimocarpus longan, JN034591.1; Eucalyptus grandis, XM_010062927.2; Euphorbia lathyris, JQ694150.1; Euphorbia pekinensis, EF062569.1; Hevea brasiliensis, XM_021830837.1; Ipomoea nil, XM_019327336.1; Jatropha curcas, XM_012232190.2; Juglans regia, XM_018987497.1; Lactuca sativa, XM_023892538.1; Litchi chinensis, JN034589.1; 728.1; Nicotiana benthamiana, LC382275.1; Nicotiana sylvestris, XM_009782484.1; Nicotiana tabacum, NM_001326284.1; Nicotiana tomentosiformis, XM_009602774.2; Oryza sativa, AF110382.1; Panax quinquefolius, FJ755158.2; Papaver somniferum, XM_026548454.1; Ricinus communis, XM_002510686.3; Solanum chacoense, JF802615.1; Solanum pennellii, XM_015210528.1; Solanum tuberosum, NM_001288155.1; Withania somnifera, KX574809.1; Zea mays, NM_001153261.1; and Ziziphus jujuba, XM_016024520.2. The tree was constructed using the neighbor-joining method in MEGA 5.1 and bootstrapped 1000 times. Bootstrap percentages are indicated at the branch points. In all cases, tree topologies obtained using the NJ, minimum evolution, and maximum parsimony methods were identical. The numbers on the nodes represent the bootstrap values.
Expression and purification of PtHMGR
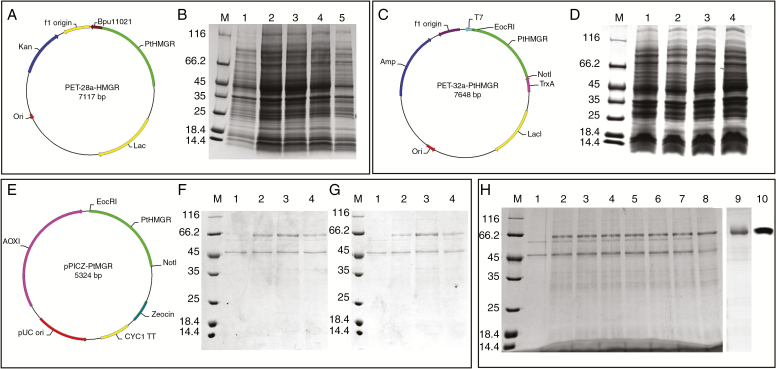
Following cloning of the ORF of PtHMGR into PET-28a (Figure 2A) and IPTG-induced expression in E. coli BL21 (DE3), the target protein was not detected by 12 % SDS–PAGE (Fig. 2B). The ORF of PtHMGR was also cloned into PET-32a (Fig. 2C), but the Trx-tagged target protein was not detected by 12 % SDS–PAGE (Fig. 2D).
Fig. 2.
PtHMGR protein production and purification. (A) Construction of the PET-28a fusion vector containing PtHMGR and BamHI and NotI sites. (B) Analysis of PET-28a-HMGR expression by 12 % SDS–PAGE. Lane M, molecular mass marker; lane 1, negative control; lanes 2–5, colonies 1–4, respectively, induced by 1 mm IPTG. (C) Construction of the PET-32a fusion vector containing PtHMGR and BamHI and NotI sites. (D) Analysis of PET-28a-HMGR expression by 12 % SDS–PAGE. Lane M, molecular mass marker; lane 1, negative control; lanes 2–4, colonies 1–3, respectively, induced by 1 mm IPTG. (E) Construction of the pPICZ-α fusion vector containing PtHMGR and BamHI and NotI sites. (F) Analysis of methanol-induced pPICZ-α-HMGR expression. Lane M, molecular mass marker; lane 1, negative control; lane 2, 0.5 % methanol for 48 h; lane 3, 1 % methanol for 48 h; lane 4, 2 % methanol for 48 h. (G) Analysis of methanol-induced pPICZ-α-HMGR expression. Lane M, molecular mass marker; lane 1, negative control; lane 2, 1 % methanol for 48 h; lane 3, 1 % methanol for 72 h; lane 4, 1 % methanol for 96 h. (H) Analysis of the expressed fusion protein by 12 % SDS–PAGE. Lane M, molecular mass marker; lane 1, negative control; lanes 2–8, colonies 1–7, respectively, induced by 1 % methanol for 72 h; lane 9, purified PtHMGR; lane 10, identification of PtHMGR by western blotting.
The ORF of PtHMGR was cloned into pPICZα (Fig. 2E) and the recombinant plasmid pPICZα-A-PtHMGR was transformed into P. pastoris GS115 by electroporation. The greatest yield of the target protein resulted from the addition of 1 % methanol for 72 h (Fig. 2F, G). The His-tagged recombinant protein was purified using Ni-IDA resin and its identity was confirmed by western blotting (Fig. 2H).
Functional analysis of PtHMGR
HMGR catalyses the reaction of one molecule of HMG-CoA with two molecules of reduced NADPH. First, one molecule of NADPH is desorbed from H and added to the acyl oxygen bound to CoA in HMG-CoA. Next, the CoA molecule is detached from HMG to form the intermediate mevalonaldehyde and CoASH, and finally the H of the other NADPH molecule is added to the acid oxygen of mevalonaldehyde to produce mevalonate (Ha et al., 2001; Yechun et al., 2007).
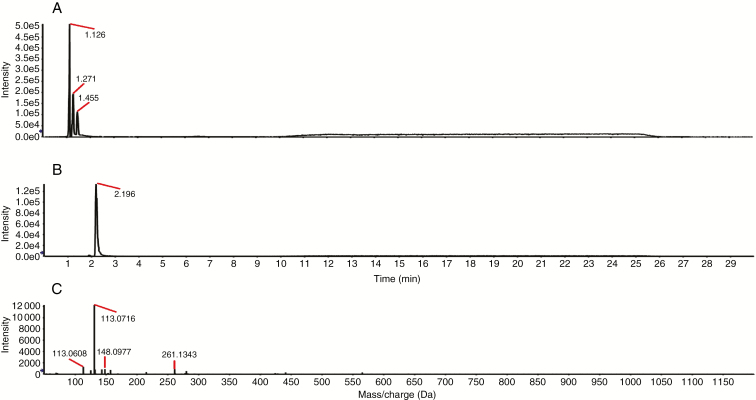
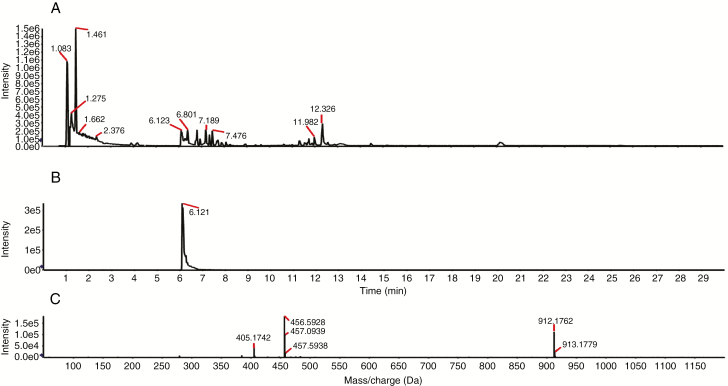
We evaluated the activity of HMGR in vitro. Mevalonate was produced by the reactions containing PtHMGR (Fig. 4), but not by the control reactions (Fig. 3). Therefore, PtHMGR catalyses the formation of mevalonate by HMG-COA. The Michaelis constant of PtHMGR for HMG-CoA was 7.91 ± 3.04 (Supplementary Data Fig. S5).
Fig. 4.
Activity of PtHMGR in vitro. (A) Total ion chromatogram of the reaction products; (B) XIC peak map; (C) TOF–MS peak map.
Fig. 3.
Activity of the control in vitro. (A) Total ion chromatogram of the reaction products; (B) XIC peak map; (C) TOF–MS peak map.
PtHMGR transcript levels
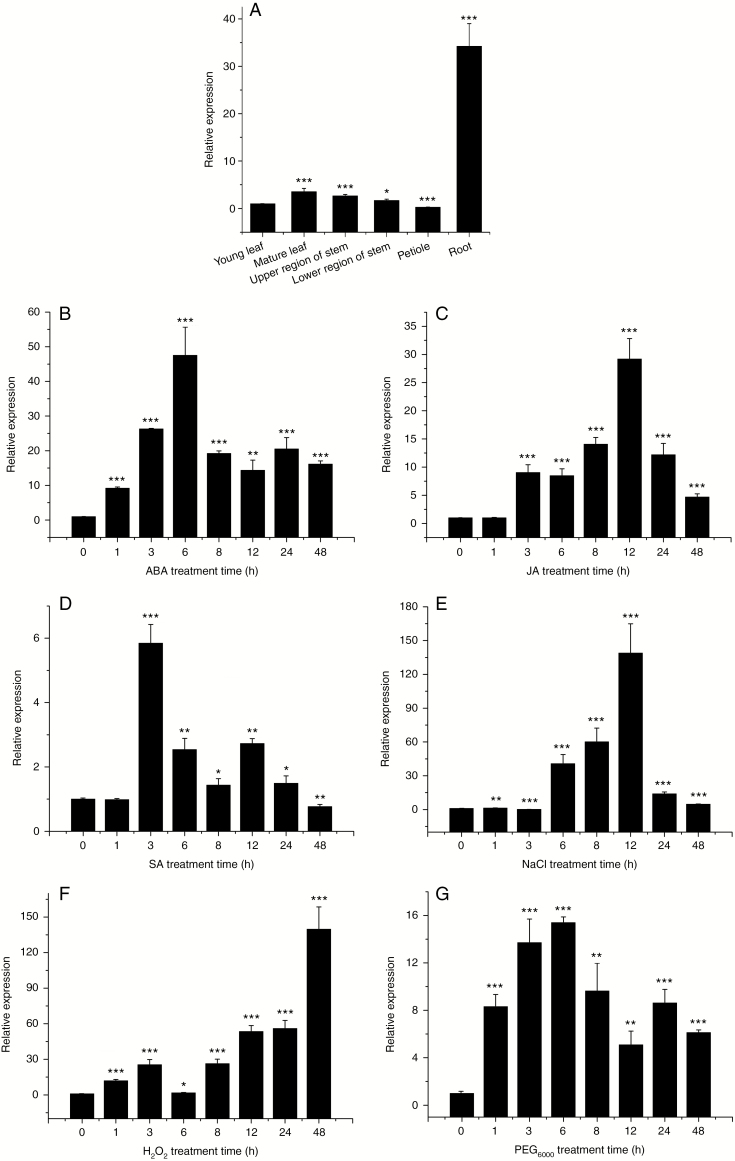
In this study, PtHMGR expression was higher in roots, followed by mature leaves, stems, young leaves and petioles (Fig. 5A). The root is the vegetative organ and is responsible for absorbing water from soil as well as dissolving inorganic salts therein, provides structural support, and stores organic substances. Therefore, we speculated that PtHMGR may be related to the growth, development and response to plant osmotic stress.
Fig. 5.
(A) Transcript levels of PtHMGR gene of P. trichocarpa in mature leaves, young leaves, upper and lower region of stems, roots and petioles. Effect of (B) 200 μm ABA, (C) 200 μm JA, (D) 200 μm SA, (E) 200 mm NaCl, (F) 2 mm H2O2, and (G) 10 % PEG6000 on the PtHMGR transcript level. Relative expression was calculated using Actin as an internal reference. Leaves treated with distilled water served as controls. Vertical bars are mean ± s.d. (n = 3). Three independent experiments were performed. *P < 0.05, **P < 0.01, ***P < 0.001.
We determined the effect on PtHMGR expression of ABA, JA, SA, NaCl, PEG6000, H2O2 and cold stress. Treatment with 200 μm ABA resulted in a gradual increase in PtHMGR expression to a peak at 6 h followed by a decrease to a higher level than the control (Fig. 5B). The increase in PtHMGR expression to a peak at 12 h and a subsequent decrease caused by 200 μm JA was of lesser magnitude than that caused by 200 μm ABA (Fig. 5C). Treatment with JA resulted in significant upregulation of PtHMGR expression to a peak at 3 h (Fig. 5D). Treatment with 200 mm NaCl resulted in an increase in the expression of PtHMGR to a peak at 12 h, followed by a gradual decrease from 24 to 48 h (Fig. 5E). Treatment with 2 mm H2O2 resulted in an increase in PtHMGR expression from 1 to 3 h, followed by a slight decrease at 6 h and a subsequent increase to a peak at 48 h (Fig. 5F). Treatment with 10 % PEG6000 increased PtHMGR expression at 1 to 48 h with a peak at 24 h; at 6 h, PtHMGR expression was ~16-fold higher than the control (Fig. 5G). Therefore, the expression of PtHMGR is modulated by a variety of stresses, indicating an important role in plant resistance to drought and salt stress.
Identification of transgenic poplar plants and analysis of stress resistance
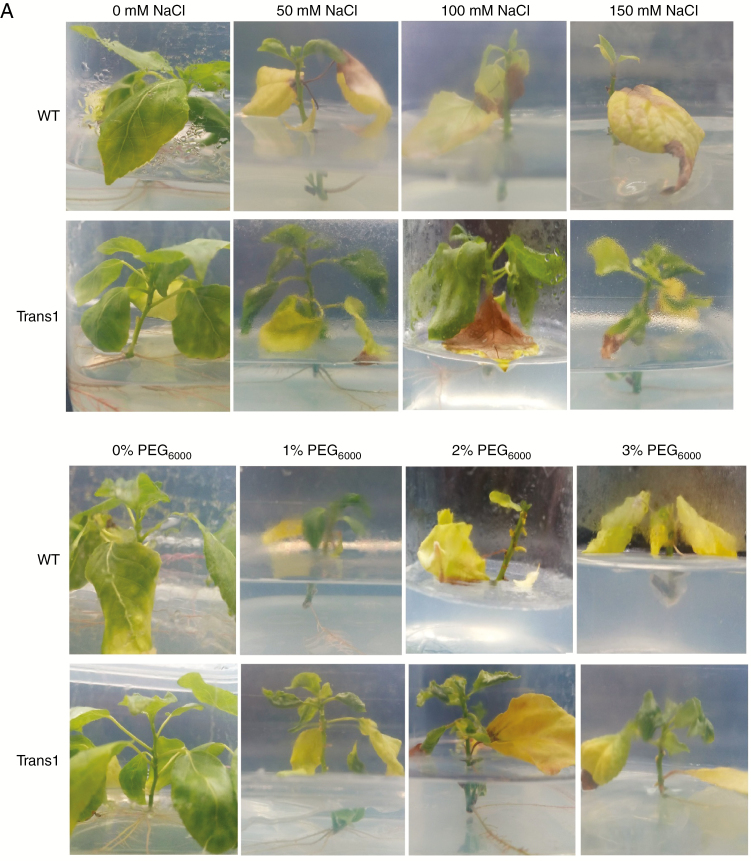
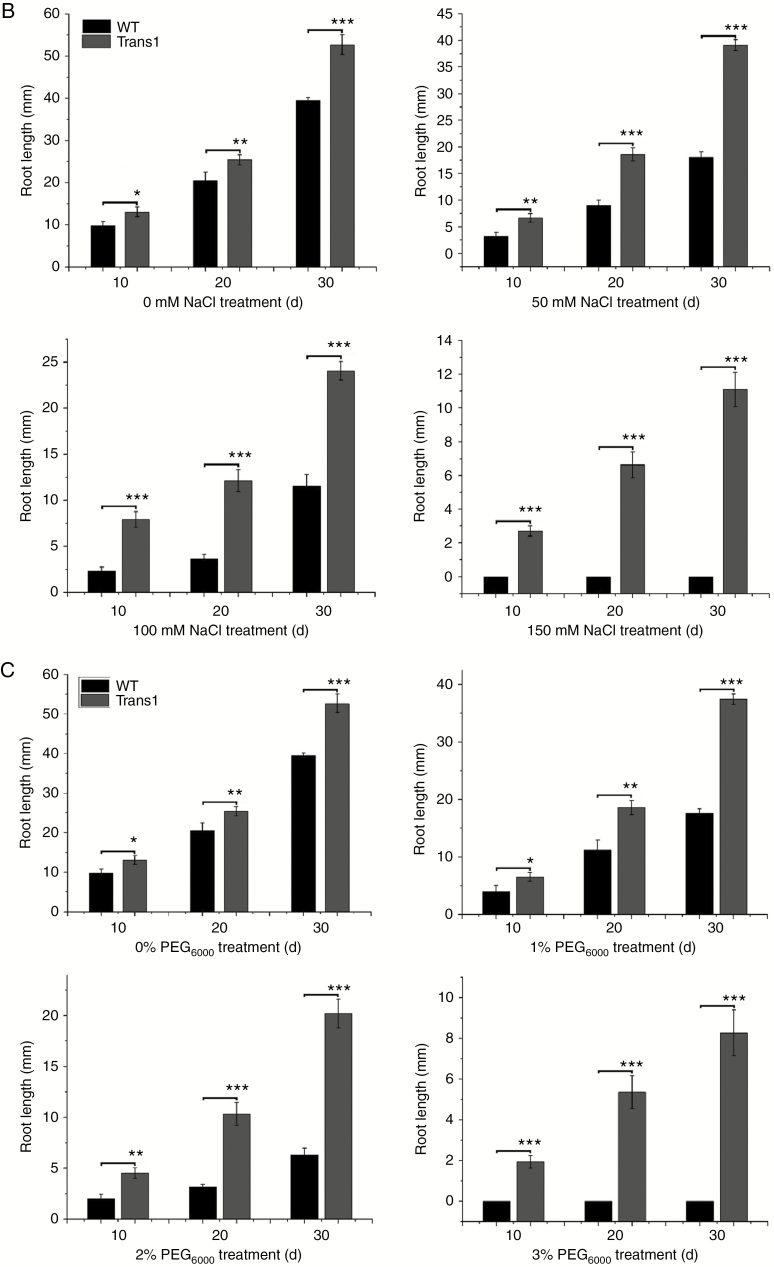
Successful generation of ten transgenic poplar lines was confirmed by RT–PCR (Supplementary Data Fig. S6A). PtHMGR expression was higher in transgenic lines than in WT (Supplementary Data Fig. S6B). Therefore, PtHMGR was successfully introduced into the Populus × euramericana ‘Nanlin895’ genome. Growth of transgenic poplars was slower in half-strength MS medium containing 150 mm NaCl than in half-strength MS medium alone, while WT growth was inhibited in half-strength MS medium containing 100 or 150 mm NaCl (Fig. 6A). The roots of transgenic poplars were longer than those of WT under normal growth conditions. Salt stress induced significant differences in the lengths of roots of transgenic and WT poplars (Fig. 6B). The transgenic poplars grew in medium containing 3 % PEG6000, while WT growth was significantly inhibited by 2 % PEG6000 (Fig. 6A). In addition, the roots of transgenic poplars grown in 1–3 % PEG6000 were longer than those of WT poplars (Fig. 6C). Therefore, the transgenic poplars were better adapted to osmotic stress than were the WT poplars.
Fig. 6.
(A) Phenotype of WT and transgenic poplars treated with 0, 50 or 100 mm NaCl or 1, 2 or 3 % PEG6000 in WT and transgenic poplar. (B) Root length in MS medium containing 0, 50 or 100 mm NaCl or (C) 1, 2 or 3 % PEG6000. Three independent experiments were performed. *P < 0.05, **P < 0.01, ***P < 0.001.
PtHMGR regulates the expression of stress-related genes
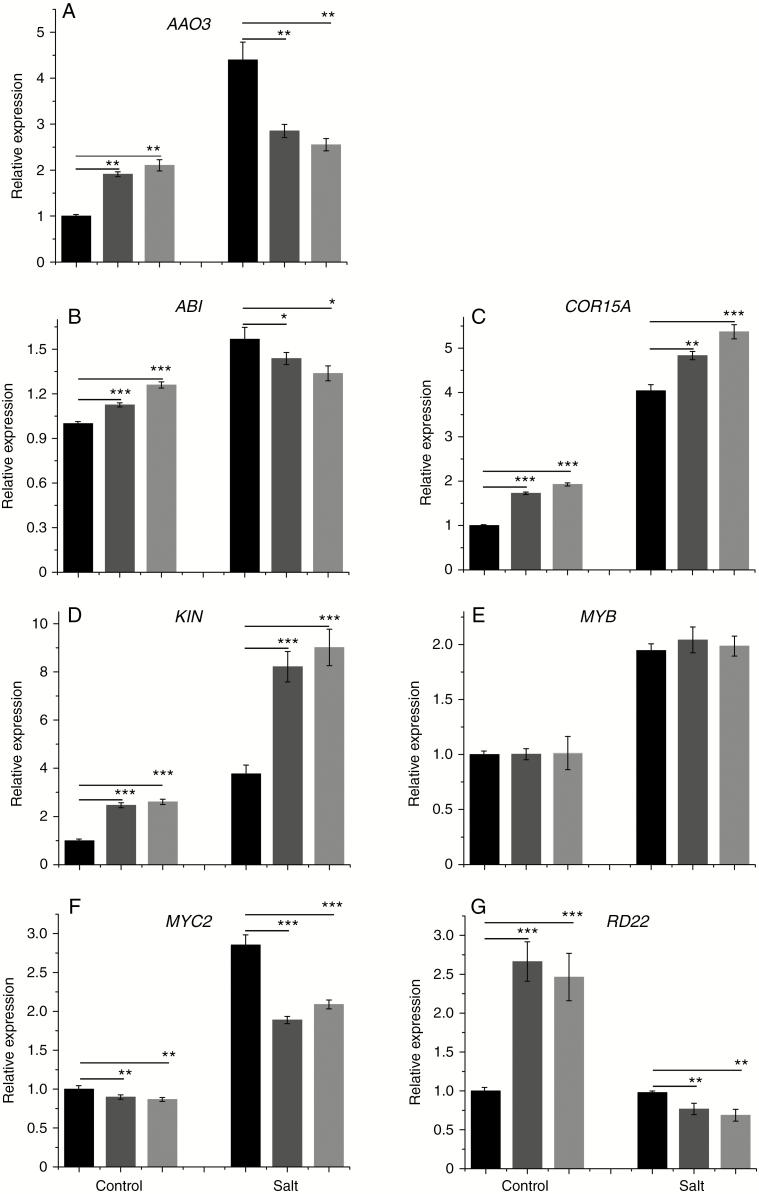
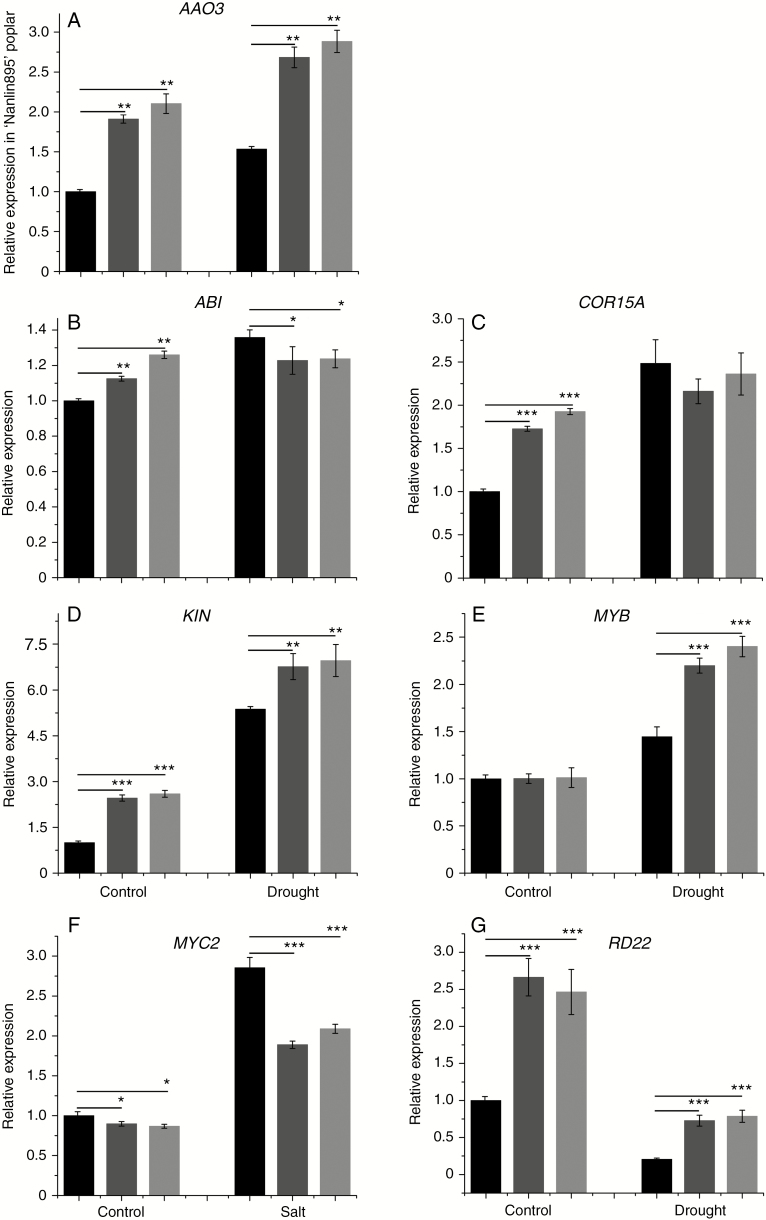
We assessed the effect of drought and salt stress on the transcript levels of AAO3, ABI, COR15A, KIN, MYB, MYC and RD22 in transgenic and WT poplars. Under normal growth conditions, the transcript levels of these genes differed significantly between transgenic and WT poplars. The transcript level of AAO3 in transgenic lines was higher than that in WT under normal conditions but was lower in transgenic lines under salt treatment (Fig. 7A). The transcript level of ABI showed similar trends to that of AAO3 (Fig. 7B). In addition, the transcript levels of COR15A and KIN in transgenic and WT poplars were increased by salt treatment. It was more obvious that the expression of COR15A and KIN in transgenic lines was increased by salt treatment (Fig. 7C, D). The transcript level of MYB in transgenic and WT poplars was upregulated by salt treatment (Fig. 7E). The transcript level of MYC2 in transgenic and WT poplars was increased by salt treatment and was higher in the latter irrespective of salt treatment (Fig. 7F). The transcript level of RD22 in transgenic lines was higher than that in WT but was decreased by salt treatment; the magnitude of the decrease was greater in transgenic lines (Fig. 7G).
Fig. 7.
Effect of treatment with 100 mm NaCl on the transcript level of (A) AAO3, (B) ABI, (C) COR15A, (D) KIN, (E) MYB, (F) MYC2 and (0G) RD22. Relative expression was calculated using Actin as an internal reference. WT leaves untreated with NaCl served as controls. Vertical bars are mean ± s.d. (n = 3). Black columns, WT; Trans1 and Trans2 represent two relatively independent transgenic lines, respectively, dark grey columns, Trans1; light grey columns, Trans2. Three independent experiments were performed. *P < 0.05, **P < 0.01, ***P < 0.001.
Under normal growth conditions, the transcript levels of AAO3 and KIN in transgenic lines were higher than those in WT. Treatment with PEG6000 resulted in upregulation of AAO3, KIN, ABI and COR15A expression (Fig. 8A–D). Under PEG6000 treatment, the transcript levels of ABI and COR15A in transgenic lines were lower than those in WT (Fig. 8B and C). There was no difference in MYB expression between the transgenic and WT poplars, but MYB expression was increased by PEG6000 treatment (Fig. 8E). Under PEG6000 treatment, the transcript level of MYC2 was increased, and the increase in WT was significant. The decrease in the transcript level of RD22 induced by PEG6000 treatment was greater in WT than in transgenic lines. Therefore, PtHMGR responds to environmental stress by altering the expression of stress-related genes.
Fig. 8.
Effect of treatment with 2 % PEG6000 on the transcript level of (A) AAO3, (B) ABI, (C) COR15A, (D) KIN, (E) MYB, (F) MYC2 and (G) RD22 in WT and transgenic poplar. Relative expression was calculated using Actin as an internal reference. WT leaves untreated with PEG6000 served as controls. Vertical bars are mean ± s.d. (n = 3). Black columns, WT; Trans1 and Trans2 represent two relatively independent transgenic lines, respectively, dark grey columns, Trans1; light grey columns, Trans2. Three independent experiments were performed. *P < 0.05, **P < 0.01, ***P < 0.001.
Overexpression of PtHMGR improves drought tolerance
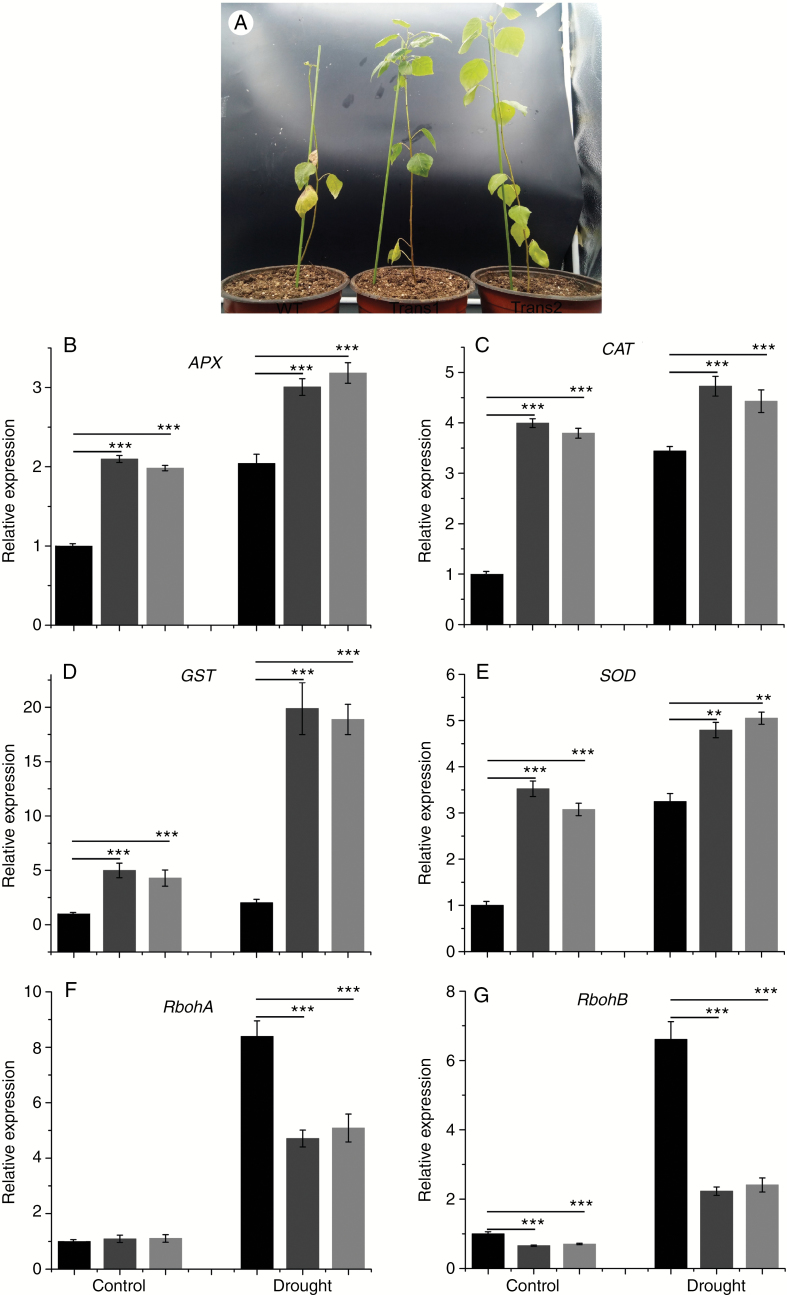
Overproduction of ROS can cause oxidative damage to plant cells (Xiuli et al., 2006; Choudhury et al., 2017). To determine whether PtHMGR modulates ROS accumulation, we analysed the expression of genes related to antioxidants (SOD, CAT, GST and APX) and ROS generation (RbohA and RbohB) by qRT–PCR. Growth of WT was significantly inhibited by drought stress, and the leaves turned yellow and fell off. Some leaves of transgenic lines also fell off (Fig. 9A). The transcript levels of APX, CAT, GST and SOD were increased significantly under the drought condition, and expression of APX, CAT, GST and SOD in transgenic lines showed greater increases than in WT (Fig. 9B–E). RbohA expression was significantly higher in WT than in transgenic lines and was increased by drought stress (Fig. 9F). Moreover, although the expression of RbohB was increased under drought stress, it was lower in transgenic lines than in WT (Fig. 9G).
Fig. 9.
Effect of drought stress on the (A) phenotype and transcript levels of (B) APX, (C) CAT, (D) GST, (E) SOD, (F) RbohA and (G) RbohB in WT and transgenic poplar. Relative expression was calculated using Actin as an internal reference. WT leaves untreated with drought stress served as controls. Vertical bars are mean ± s.d. (n = 3). Black columns, WT; Trans1 and Trans2 represent two relatively independent transgenic lines, respectively, dark grey columns, Trans1; light grey columns, Trans2. Three independent experiments were performed. **P < 0.01, ***P < 0.001.
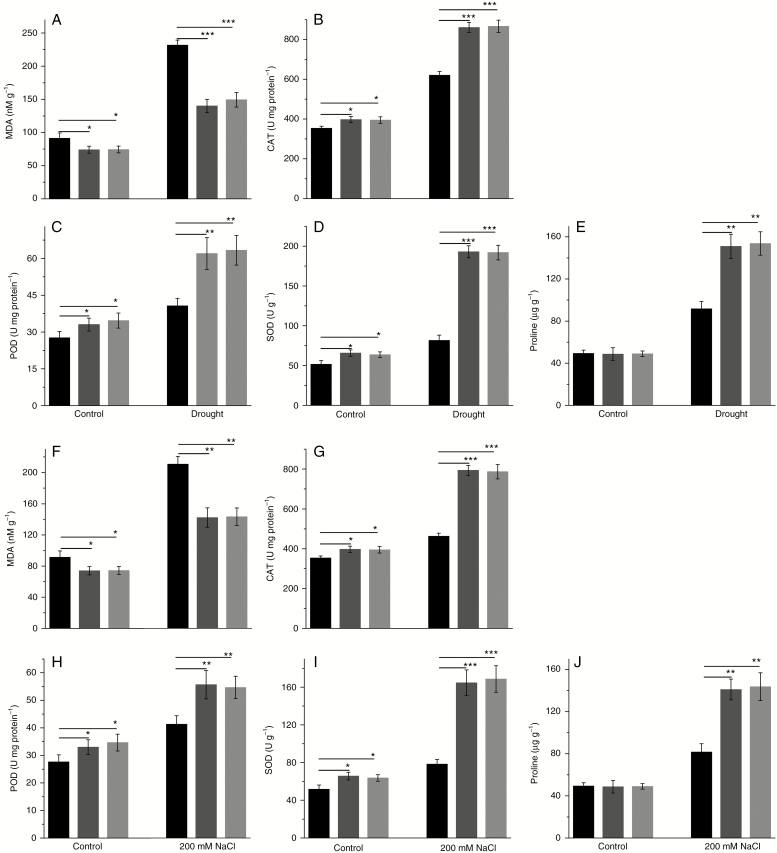
We also analysed the activities of POD, SOD and CAT, and MDA and proline contents. The MDA level in transgenic lines was slightly lower than that in WT under normal conditions (Fig. 10A). In addition it increased, the MDA level in WT was higher than that in transgenic lines under drought stress. The activities of SOD, POD and CAT and proline content were higher in transgenic lines compared with WT under drought stress (Fig. 10B–E). These results suggest that PtHMGR modulates the expression of genes related to ROS scavenging, the activities of SOD, POD and CAT, and the MDA and proline contents of plant cells.
Fig. 10.
(A–E) Effect of drought stress on (A) MDA level, (B) CAT activity, (C) POD activity, (D) SOD activity and (E) proline content in WT and transgenic poplar. (E–J) Effect of salt stress on (F) MDA level, (G) CAT activity, (H) POD activity, (I) SOD activity and (J) proline content in WT and transgenic poplar. Vertical bars are mean ± s.d. (n = 3). Black columns, WT; Trans1 and Trans2 represent two relatively independent transgenic lines, respectively, dark grey columns, Trans1; light grey columns, Trans2. Three independent experiments were performed. *P < 0.05, **P < 0.01, ***P < 0.001.
Overexpression of PtHMGR improves salt tolerance
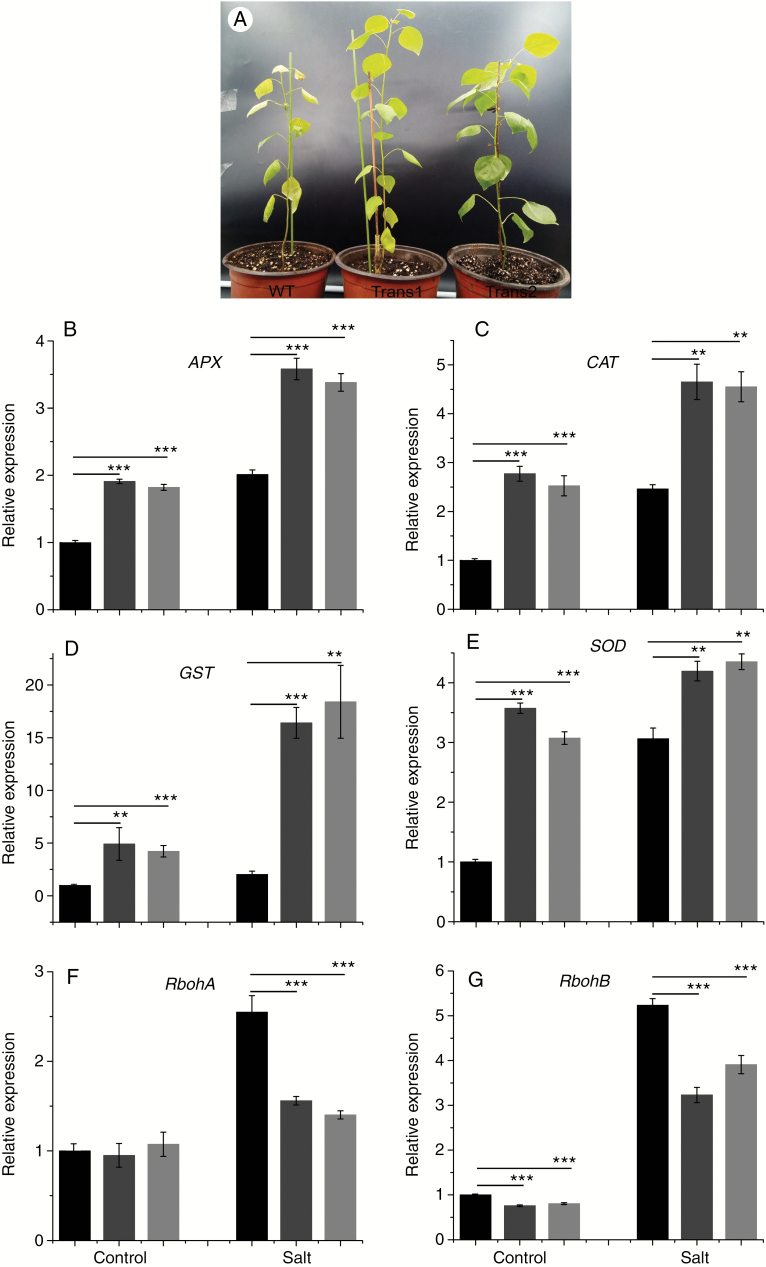
Osmotic stress leads to osmotic imbalance and physiological disorders, thus inhibiting the growth and development of plants (Ahuja et al., 2010). Growth of WT was significantly inhibited by salt stress, and leaves turned yellow and fell off. Some leaves of the transgenic lines also fell off (Fig. 11A). The transcript levels of APX, CAT, GST and SOD were increased significantly and the increases in the transcript levels of APX, CAT, GST, and SOD in transgenic lines were greater than those in WT under salt stress (Fig. 11B–E). Although the expression of RbohA was increased by salt stress, the transcript level of RbohA in transgenic lines was significantly lower than that in WT (Fig. 11F). The expression of RbohB in transgenic lines was lower than that in WT under salt stress (Fig. 11G) Under salt stress, the activities of SOD, POD and CAT and the proline content were higher in transgenic lines than in WT, and the MDA level was lower in transgenic lines (Fig. 10F–J). Therefore, PtHMGR modulates the expression of ROS scavenging-related genes, the activities of SOD, POD and CAT, and the MDA and proline contents of plant cells.
Fig. 11.
Effect of salt stress on the (A) phenotype and transcript levels of (B) APX, (C) CAT, (D) GST, (E) SOD, (F) RbohA, and (G) RbohB of WT and transgenic poplar. Relative expression was calculated using Actin as an internal reference. WT leaves untreated with salt stress served as controls. Vertical bars are mean ± s.d. (n = 3). Black columns, WT; Trans1 and Trans2 represent two relatively independent transgenic lines, respectively, dark grey columns, Trans1; light grey columns, Trans2. Three independent experiments were performed. **P < 0.01, ***P < 0.001.
PtHMGR regulates the expression of MEP-, mevalonate- and ABA-related genes
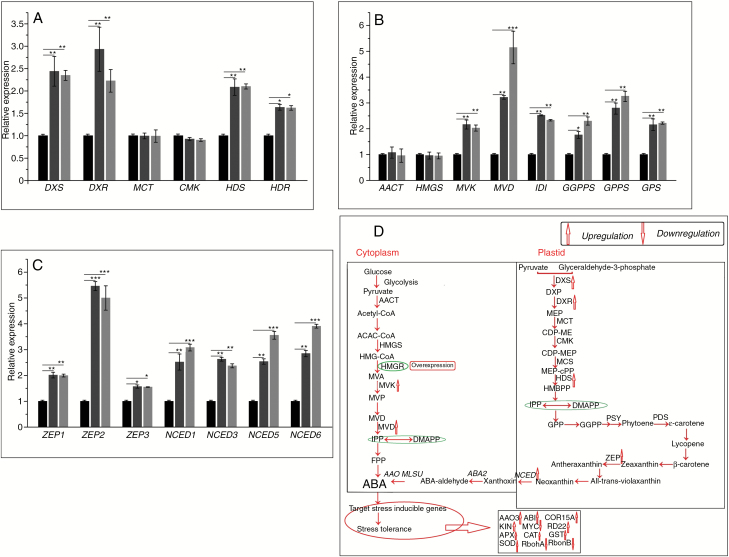
Isoprenoid metabolites, such as cytokinin, gibberellin, ABA, chlorophyll and terpenoids, are important for maintaining plant growth and development and coping with environmental stresses (Mosquera et al., 2016; Gupta et al., 2017). Isoprene metabolites are mainly synthesized via the mevalonate and MEP pathways, in which the rate-limiting enzyme HMGR converts HMG-CoA to mevalonate. The transcript levels of 1-deoxy-d-xylulose5-phosphate synthase (DXS), 1-deoxy-d-xylulose5-phosphate reductoisomerase (DXR), 1-hydroxy-2-methyl-2-(E)-butenyl4-diphosphate synthase (HDS) and 1-hydroxy-2-methyl-2-(E)-butenyl4-diphosphate reductase (HDR) were increased significantly in transgenic lines, while those of acetoacetyl CoA thiolase (AACT), 2-C-methyl-d-erythritol 4-phosphate cytidylyltransferase (MCT) and 4-diphosphocytidyl-2-C-methyl-d-erythritol kinase (CMK) were not significantly different (Fig. 12A). In addition, the transcript levels of mevalonate kinase (MVK), mevalonate5-diphosphate decarboxylase (MVD), isopentenyl diphosphate isomerase (IDI), geranyl geranyl diphosphate synthase (GGPPS), geranyl diphosphate synthase (GPPS) and geranyl diphosphate (GPS) were increased significantly in transgenic lines (Fig. 12B), as were those of ABA-related genes (Fig. 12C). Therefore, PtHMGR regulates the expression of osmotic stress-related genes via the ABA signalling pathway to enhance tolerance of salt and drought stress (Fig. 12D).
Fig. 12.
Changes in WT and transgenic poplars in the transcript levels of (A) DXS, DXR, MCT, CMK, HDS and HDR (MEP-related genes); (B) AACT, HMGS, MVK, MVD, IDI, GPS, GPPS and GGPPS (mevalonate- and downstream-related genes); and (C) ZEP1, ZEP2, ZEP3 NCED1, NCED3, NCED5 and NCED6 (ABA-related genes). Black columns, WT; Trans1 and Trans2 represent two relatively independent transgenic lines, respectively, dark grey columns, Trans1; light grey columns, Trans2. (D) ABA-mediated signal transduction under drought and salt stress. Relative expression was calculated using Actin as an internal reference. Leaves treated with distilled water served as controls. Vertical bars are mean ± s.d. (n = 3). Three independent experiments were performed. *P < 0.05, **P < 0.01, ***P < 0.001.
DISCUSSION
The HMGRs, which encode the rate-limiting enzyme of the mevalonate pathway, have been isolated and cloned from A. thaliana, O. sativa and Hevea brasiliensis (Caelles et al., 1989; Chye et al., 1991; Nelson et al., 1994). The open reading frame of HMGRs is 1–2 kb in length (most are ~1.7 kb) and encodes 500–600 amino acids. The amino acid sequences of most plant HMGRs have HMG-CoA- and NADPH-binding regions. The amino acid sequences of HMG-CoA-binding region 1 is EM(L)PVGYVQIP; the second amino acid in monocotyledonous plants (e.g. rice and maize) is leucine (L) and that in dicotyledons is methionine (M). HMG-CoA-binding region 2 has a conserved sequence (TTEGCLVA). The amino acid sequence of the NADPH-binding region is DAMGMNM or GTVGGGTQ. These residues are involved in substrate recognition and binding. In this study we cloned the 1767-bp (encoding 588 amino acids) HMGR gene from P. trichocarpa. PtHMGR contained HMGR-CoA (EMPVGYVQIP and TTEGCLVA)- and NADPH (DAMGMNM and GTVGGGTQ)-binding domains.
2EpHMGR and CgHMGR (Yechun et al., 2007; Cao et al., 2010) promote the biosynthesis of β-carotene in E. coli. Transfer of TbHMGR1, TbHMGR2 and TbHMGR3 enabled survival of E. coli defective in isoprene pyrophosphate synthesis through the endogenous MEP pathway. Indeed, these three HMGRs have similar activities and can restart the mevalonate pathway (Campos and Boronat, 1995). PtHMGR production in a prokaryotic system was unsuccessful. However, we obtained and purified PtHMGR protein in P. pastoris GS115. The PtHMGR then produced was capable of catalysing the formation of mevalonate from HMG-CoA and NADPH in vitro. The Km value of PtHMGR for HMG-CoA was 7.91 ± 3.04. The HMG-CoA binding capacity of PtHMGR is similar to that of the corresponding proteins of Z. mays and A. thaliana, and stronger than that of H. brasiliensis (Wititsuwannakul et al., 1990; Dale et al., 2010).
3The expression level of WsHMGR increased in the order flower > root > fruit > stem > leaf and was higher in young than in mature leaves (Akhtar et al., 2013). The transcript level of CaHMGR was high in stems, roots and leaves (Wang et al., 2014). The expression of PfHMGR is reportedly high in roots and stems (Liang et al., 2014). ZmHMGR6 is highly expressed in seeds, ZmHMGR5 is exclusively expressed in the endosperm of seeds, and soybean GmHMGR4 is highly expressed during the late stage of seed development (Wei et al., 2014). In the present study we found the highest expression accumulation in roots. In addition, previous studies demonstrated that the HMGR gene could respond to various treatments (Yukimune et al., 1996; Wang et al., 2014).
4In this study the transcript level of PtHMGR responded to ABA, JA, SA, NaCl, PEG6000 and H2O2, suggesting it has roles in the responses to various stresses. These findings will facilitate the breeding of salt- and drought-resistant poplar varieties.
5Drought induces osmotic stress in plants, while salt stress induces osmotic stress and ion toxicity (Ahuja et al., 2010). The secondary effects of drought and salt stress on plants include oxidative stress, damage to membrane lipids, proteins and nucleic acids, and disruption of metabolism. Primary stress signals may induce cellular responses, but secondary stress signals are typically more important. Therefore, drought and salinity stress have specific signal transduction pathways, which can engage in cross-talk. Both drought and salt stress induce hyperosmotic signals, leading to the accumulation of ABA and a variety of responses in plants. In this study we observed that the expression levels of mevalonate- and MEP-related genes were increased in transgenic poplars. In addition, the transcript levels of ABA-related genes and ABA contents were increased in transgenic poplars (Supplementary Data Fig. S7). ABA is critical for the response of plants to abiotic stresses, including drought and salt (Zhu, 2000). The ABA signalling pathway consists of a subfamily of PP2Cs and three kinases, SnRK2-2/3/6, whose activity is controlled by the concentration of ABA. In the absence of ABA, the PYL receptor proteins do not interact with PP2Cs (ABI1, ABI2 and HAB1). The PP2Cs inactivate SnRK2 by phosphorylation, suppressing the expression of ABA-responsive genes. The serine subunit in the activation loop of SnRK2s was phosphorylated by PP2C (Ng et al., 2011; Soon et al., 2012) Above a threshold concentration, ABA binds to PYL receptors, which promotes its binding to the catalytic site of PP2Cs. The ABA–PYL complex inhibits PP2C kinase activity, resulting in release of SnRK2s. SnRK2 auto-phosphorylates and transmits ABA signals to downstream factors, which initiate the plant response to drought and salt stresses (Fujii et al., 2009; Park et al., 2009). In this study the transcript levels of ABA-responsive genes (including AAO3, ABI, COR15A, KIN, MYB, MYC and RD22) differed significantly between the transgenic and WT poplars after salt and drought stress. In addition, the roots of PtHMGR-overexpressing poplar seedlings developed rapidly, and the transgenic poplars had a high survival rate and enhanced tolerance of osmotic stress. The expression levels of genes related to ROS scavenging were higher in the PtHMGR-overexpressing (PtHMGR-OE) poplars under osmotic stress conditions, and the transcript levels of genes related to ROS formation were lower in transgenic poplars under osmotic stress conditions, which indicated that the PtHMGR-OE poplars could not only produce less ROS, but also produce more ROS scavengers under osmotic stress conditions. In addition, the activities of SOD, POD and CAT in transgenic poplars were higher than those in WT under normal or osmotic stress conditions. SOD, POD and CAT scavenge ROS and peroxide free radicals in plants (Kar et al., 2011). Therefore, overexpression of PtHMGR maintains the stability of the ROS system in poplar.
Conclusions
We cloned PtHMGR from P. trichocarpa and constructed a phylogenetic tree based on the amino acid sequences of plant HMGRs. The function and evolution of plant HMGR genes were conserved, making HMGR useful as a reference for assessing relationships among species. Overexpression of PtHMGR promoted root development, increased the expression of genes related to ROS scavenging, decreased the expression of genes related to ROS formation and increased the activity of antioxidant enzymes in transgenic poplars, enhancing their tolerance of osmotic stress. In addition, overexpression of PtHMGR increased expression of the stress-related genes KIN1, COR15 and AAO3, and decreased that of ABI, MYB, MYC2 and RD22, enhancing the stress resistance of poplar.
SUPPLEMENTARY DATA
Supplementary data are available online at https://academic.oup.com/aob and consist of the following. Figure S1: samples were extracted from mature and young leaves, upper and lower stems, petioles and roots. Figure S2: nucleotide and deduced amino acid sequences of PtHMGR. Figure S3: amino acid sequence alignments of PtHMGR and other HMGRs. Figure S4: three-dimensional structure of PtHMGR, AtHMGR, NtHMGR, OsHMGR and ZmHMGR. Figure S5: construction of Michaelis equation for PtHMGR protein. Figure S6: identification of transgenic lines. Figure S7: HPLC-MS/MS analysis of the ABA content of WT and transgenic poplars. Table S1: primers used in this study.
FUNDING
This work was supported by the National Key Program on Transgenic Research (2018ZX08020002), the National Science Foundation of China (31570650) and the Priority Academic Program Development of Jiangsu Higher Education Institutions.
ACKNOWLEDGEMENTS
The authors declare no conflicts of interest.
LITERATURE CITED
- Ahuja I, Vos RCHD, Bones AM, Hall RD. 2010. Plant molecular stress responses face climate change. Trends in Plant Science 15: 664–674. [DOI] [PubMed] [Google Scholar]
- Akhtar N, Gupta P, Sangwan NS, et al. 2013. Cloning and functional characterization of 3-hydroxy-3-methylglutaryl coenzyme A reductase gene from Withania somnifera: an important medicinal plant. Protoplasma 250: 613–622. [DOI] [PubMed] [Google Scholar]
- Caelles C, Ferrer A, Balcells L, Hegardt FG, Boronat A. 1989. Isolation and structural characterization of a cDNA encoding Arabidopsis thaliana 3-hydroxy-3-methylglutaryl coenzyme A reductase. Plant Molecular Biology 13: 627–638. [DOI] [PubMed] [Google Scholar]
- Campos N, Boronat A. 1995. Targeting and topology in the membrane of plant 3-hydroxy-3-methylglutaryl coenzyme A reductase. Plant Cell 7: 2163–2174. [DOI] [PMC free article] [PubMed] [Google Scholar]
- Cao X, Zong Z, Ju X, et al. 2010. Molecular cloning, characterization and function analysis of the gene encoding HMG-CoA reductase from Euphorbia pekinensis Rupr. Molecular Biology Reports 37: 1559–1567. [DOI] [PubMed] [Google Scholar]
- Caelles C, Ferrer A, Balcells L, Hegardt FG, Boronat A. 1989. Isolation and structural characterization of a cDNA encoding Arabidopsis thaliana 3-hydroxy-3-methylglutaryl coenzyme A reductase. Plant Molecular Biology 13: 627–638. [DOI] [PubMed] [Google Scholar]
- Chaves MM, Maroco JP, Pereira JS. 2003. Understanding plant responses to drought—from genes to the whole plant. Functional Plant Biology 30: 239–264 [DOI] [PubMed] [Google Scholar]
- Choudhury FK, Rivero RM, Blumwald E, Mittler R. 2017. Reactive oxygen species, abiotic stress and stress combination. Plant Journal 90: 856–867. [DOI] [PubMed] [Google Scholar]
- Christmann A, Hoffman T, Teplova I, Grill E, Müller A. 2005. Generation of active pools of abscisic acid revealed by in vivo imaging of water-stressed Arabidopsis. Plant Physiology 137: 209–219. [DOI] [PMC free article] [PubMed] [Google Scholar]
- Chye ML, Kush A, Tan CT, Chua NH. 1991. Characterization of cDNA and genomic clones encoding 3-hydroxy-3-methylglutaryl-coenzyme A reductase from Hevea brasiliensis. Plant Molecular Biology 16: 567–577. [DOI] [PubMed] [Google Scholar]
- Dai Z, Cui G, Zhou SF, Zhang X, Huang L. 2011. Cloning and characterization of a novel 3-hydroxy-3-methylglutaryl coenzyme A reductase gene from Salvia miltiorrhiza involved in diterpenoid tanshinone accumulation. Journal of Plant Physiology 168: 0–157. [DOI] [PubMed] [Google Scholar]
- Dale S, Arró M, Becerra B, et al. 2010. Bacterial expression of the catalytic domain of 3-hydroxy-3-methylglutaryl-CoA reductase (isoform HMGR1) from Arabidopsis thaliana, and its inactivation by phosphorylation at ser577 by Brassica oleracea 3-hydroxy-3-methylglutaryl-CoA reductase kinase. European Journal of Biochemistry 233: 506–513. [DOI] [PubMed] [Google Scholar]
- Estevez JM, Cantero A, Reindl A, Reichler S, Leon P. 2001. 1-Deoxy-d-xylulose-5-phosphate synthase, a limiting enzyme for plastidic isoprenoid biosynthesis in plants. Journal of Biological Chemistry 276: 22901–22909. [DOI] [PubMed] [Google Scholar]
- Finkelstein R. 2013. Abscisic acid synthesis and response. The Arabidopsis Book 11: e0166. [DOI] [PMC free article] [PubMed] [Google Scholar]
- Fujii H, Chinnusamy V, Rodrigues A, et al. 2009. In vitro reconstitution of an abscisic acid signalling pathway. Nature 462: 660–664. [DOI] [PMC free article] [PubMed] [Google Scholar]
- Gupta R, Singh A, Srivastava M, Singh V, Gupta MM, Pandey R. 2017. Microbial modulation of bacoside. A biosynthetic pathway and systemic defense mechanism in Bacopa monnieri under Meloidogyne incognita stress. Science Reports 7: 41867. [DOI] [PMC free article] [PubMed] [Google Scholar]
- Ha SH, Lee SW, Kim YM, Hwang YS. 2001. Molecular characterization of hmg2 gene encoding a 3-hydroxy-methylglutaryl-CoA reductase in rice. Molecules and Cells 11: 295–302. [PubMed] [Google Scholar]
- Jing L, Li W, Rong D, Jinteng C, Kezhong Z, School LA. 2018. Analysis of key enzyme genes in carotenoid metabolism pathway of Lilium and cloning of LOLCYB gene. Molecular Plant Breeding 10. [Google Scholar]
- Kar RK. 2011. Plant responses to water stress: role of reactive oxygen species. Plant Signaling & Behavior 6: 1741–1745. [DOI] [PMC free article] [PubMed] [Google Scholar]
- Leivar P, Antolín-Llovera M, Arró M, Ferrer A, Boronat A, Campos N. 2011. Modulation of plant HMG-CoA reductase by protein phosphatase 2a. Plant Signaling & Behavior 6: 1127–1131. [DOI] [PMC free article] [PubMed] [Google Scholar]
- Liang Y, Jiang XM, Hu Q, et al. 2014. Cloning and characterization of 3-hydroxy-3-methylglutaryl-CoA reductase (HMGR) gene from Paris fargesii Franch. Indian Journal of Biochemistry and Biophysics 51: 201–206. [PubMed] [Google Scholar]
- Livak KJ, Schmittgen TD. 2001. Analysis of relative gene expression data using real-time quantitative PCR and the 2− ΔΔCT method. Methods 25: 402–408. [DOI] [PubMed] [Google Scholar]
- Loreto F, Schnitzler JP. 2010. Abiotic stresses and induced BVOCs. Trends in Plant Science 15: 154–166. [DOI] [PubMed] [Google Scholar]
- Loreto F, Dicke M, Schnitzler JP, Turlings TC. 2014. Plant volatiles and the environment. Plant Cell & Environment 37: 1905–1908. [DOI] [PubMed] [Google Scholar]
- Maldonado-Mendoza IE, Burnett RJ, Nessler CL. 1992. Nucleotide sequence of a cDNA encoding 3-hydroxy-3-methylglutaryl coenzyme A reductase from Catharanthus roseus. Plant Physiology 100: 1613–16. [DOI] [PMC free article] [PubMed] [Google Scholar]
- Markus Lange B, Rujan T, Martin W, Croteau R. 2000. Isoprenoid biosynthesis: the evolution of two ancient and distinct pathways across genomes. Proceedings of the National Academy of Sciences of the USA 97: 13172–13177. [DOI] [PMC free article] [PubMed] [Google Scholar]
- Mithöfer A, Boland W. 2012. Plant defense against herbivores: chemical aspects. Annual Review of Plant Biology 63: 431–450. [DOI] [PubMed] [Google Scholar]
- Miziorko HM. 2011. Enzymes of the mevalonate pathway of isoprenoid biosynthesis. Archives of Biochemistry & Biophysics 505: 0–143. [DOI] [PMC free article] [PubMed] [Google Scholar]
- Mosquera T, Alvarez MF, José M, et al. 2016. Targeted and untargeted approaches unravel novel candidate genes and diagnostic SNPs for quantitative resistance of the potato (Solanum tuberosum L.) to Phytophthora infestans causing the late blight disease. PLoS ONE 11: e0156254. [DOI] [PMC free article] [PubMed] [Google Scholar]
- Nelson AJ, Doerner PW, Zhu Q, Lamb CJ. 1994. Isolation of a monocot 3-hydroxy-3-methylglutaryl coenzyme a reductase gene that is elicitor-inducible. Plant Molecular Biology 25: 401–412. [DOI] [PubMed] [Google Scholar]
- Ng LM, Soon FF, Zhou XE, et al. 2011. Structural basis for basal activity and autoactivation of abscisic acid (ABA) signaling SnRK2 kinases. Proceedings of the National Academy of Sciences of the USA 108: 21259–21264. [DOI] [PMC free article] [PubMed] [Google Scholar]
- Park SY, Fung P, Nishimura N, et al. 2009. Abscisic acid inhibits type 2C protein phosphatases via the PYR/PYL family of START proteins. Science 324: 1068–1071. [DOI] [PMC free article] [PubMed] [Google Scholar]
- Schwender J, Gemünden C, Lichtenthaler HK. 2001. Chlorophyta exclusively use the 1-deoxyxylulose 5-phosphate/2-c-methylerythritol 4-phosphate pathway for the biosynthesis of isoprenoids. Planta 212: 416–423. [DOI] [PubMed] [Google Scholar]
- Seo M, Koshiba T. 2002. Complex regulation of ABA biosynthesis in plants. Trends in Plant Science 7: 41–48. [DOI] [PubMed] [Google Scholar]
- Soon FF, Ng LM, Zhou XE, et al. 2012. Molecular mimicry regulates ABA signaling by SnRK2 kinases and PP2C phosphatases. Science 335: 85–88. [DOI] [PMC free article] [PubMed] [Google Scholar]
- Sun L, Sun Y, Zhang M, et al. 2012. Suppression of 9-cis-epoxycarotenoid dioxygenase, which encodes a key enzyme in abscisic acid biosynthesis, alters fruit texture in transgenic tomato. Plant Physiology 158: 283–298. [DOI] [PMC free article] [PubMed] [Google Scholar]
- Székely G, Ábrahám E, Cséplő A, et al. 2008. Duplicated p5cs genes of Arabidopsis play distinct roles in stress regulation and developmental control of proline biosynthesis. Plant Journal 53: 18. [DOI] [PubMed] [Google Scholar]
- Tuskan GA, Difazio S, Jansson S, et al. 2006. The genome of black cottonwood, Populus trichocarpa (Torr. & Gray). Science 313: 1596–1604. [DOI] [PubMed] [Google Scholar]
- Vickers CE, Gershenzon J, Lerdau MT, Loreto F. 2009. A unified mechanism of action for volatile isoprenoids in plant abiotic stress. Nature Chemical Biology 5: 283–291. [DOI] [PubMed] [Google Scholar]
- Wang QJ, Zheng LP, Zhao PF, Zhao YL, Wang JW. 2014. Cloning and characterization of an elicitor-responsive gene encoding 3-hydroxy-3-methylglutaryl coenzyme A reductase involved in 20-hydroxyecdysone production in cell cultures of Cyanotis arachnoidea. Plant Physiology and Biochemistry 84: 1–9. [DOI] [PubMed] [Google Scholar]
- Wei L, Wei L, Hengling W, et al. 2014. Species-specific expansion and molecular evolution of the 3-hydroxy-3-methylglutaryl coenzyme A reductase (HMGR) gene family in plants. PLoS ONE 9: e94172. [DOI] [PMC free article] [PubMed] [Google Scholar]
- Wititsuwannakul R, Wititsuwannakul D, Suwanmanee P. 1990. 3-Hydroxy-3-methylglutaryl coenzyme A reductase from the latex of Hevea brasiliensis. Phytochemistry 29: 1401–1403. [Google Scholar]
- Wu TS, Leu YL, Chan YY, et al. 1997. Tetranortriterpenoid insect antifeedants from Severinia buxifolia. Phytochemistry 45: 1393–1398. [Google Scholar]
- Xiong L, Schumaker KS, Zhu JK. 2002. Cell signaling during cold, drought, and salt stress. Plant Cell 14: 165–183. [DOI] [PMC free article] [PubMed] [Google Scholar]
- Xiuli HU, Zhang A, Zhang J, Jiang M. 2006. Abscisic acid is a key inducer of hydrogen peroxide production in leaves of maize plants exposed to water stress. Plant & Cell Physiology 47:1484–1495. [DOI] [PubMed] [Google Scholar]
- Yechun W, Binhui G, Fei Z, Hongyan Y, Zhiqi M, Kexuan T. 2007. Molecular cloning and functional analysis of the gene encoding 3-hydroxy-3-methylglutaryl coenzyme A reductase from hazel (Corylus avellana L. Gasaway). Journal of Biochemistry & Molecular Biology 40:861–869. [DOI] [PubMed] [Google Scholar]
- Yonekura-Sakakibara K, Saito K. 2009. Functional genomics for plant natural product biosynthesis. Natural Product Reports 26: 1466–1487. [DOI] [PubMed] [Google Scholar]
- Yu F, Utsumi R. 2009. Diversity, regulation, and genetic manipulation of plant mono- and sesquiterpenoid biosynthesis. Cellular and Molecular Life Sciences 66: 3043–3052. [DOI] [PMC free article] [PubMed] [Google Scholar]
- Yukimune Y, Tabata H, Higashi Y, Hara Y. 1996. Methyl jasmonate-induced overproduction of paclitaxel and baccatin III in Taxus cell suspension cultures. Nature Biotechnology 14: 1129–1132. [DOI] [PubMed] [Google Scholar]
- Zhang J, Movahedi A, Sang M, et al. 2017. Functional analyses of NDPK2 in Populus trichocarpa, and overexpression of PtNDPK2, enhances growth and tolerance to abiotic stresses in transgenic poplar. Plant Physiology and Biochemistry 117: 61–74. [DOI] [PubMed] [Google Scholar]
- Zhang M, Leng P, Zhang G, Li X. 2009. Cloning and functional analysis of 9-cis-epoxycarotenoid dioxygenase (NCED) genes encoding a key enzyme during abscisic acid biosynthesis from peach and grape fruits. Journal of Plant Physiology 166: 0–1252. [DOI] [PubMed] [Google Scholar]
- Zhu JK. 2000. Genetic analysis of plant salt tolerance using Arabidopsis. Plant Physiology 124: 941–948. [DOI] [PMC free article] [PubMed] [Google Scholar]
Associated Data
This section collects any data citations, data availability statements, or supplementary materials included in this article.


