Abstract
Chitin production wastewater contains nutrient-rich organic and mineral contents. Coagulation of the wastewater with a natural coagulant such as by-product chitosan would be an economical and environmentally friendly method of treatment. This study investigated the treatment efficiencies of a preliminary sedimentation process followed by coagulation. The removal efficiencies for wastewater parameters were evaluated and compared for coagulants including by-product chitosan, polyaluminum chloride, and polyacryamide. The evaluation was based on the removal of wastewater turbidity and other criteria, including tCOD, sCOD, TKN, NH4+–N, TP, TSS, calcium, and crude protein. The results showed that the preliminary sedimentation (before coagulation) can remove over 80% of turbidity and more than 93% of TSS at pH 4 in 30 min. At optimal conditions, when the ratio of crude protein and calcium was 4.95, by-product chitosan dose of 77.5 mg·L−1 and pH = 8.3, the wastewater characteristics changes were tCOD 23%, sCOD 32%, TKN and ammonium 25%, TP 90%, TSS 84%, Ca2+ 29%, and crude protein 25%. The residue recovered through coagulation consists of up to 55 mg·g−1 crude protein, which is used for animal feed or crop fertilizer.
Keywords: high strength wastewater treatment, turbidity removal, chitin and chitosan, chemical coagulation, crude protein recovery
1. Introduction
Chitin production from seafood waste such as shrimp scraps is an important industry in a number of countries including Vietnam and China [1,2,3]. It is favorable in utilizing the abundance of waste materials, cheap labor resources, application of inorganic chemical technology, and simple production processes [4,5,6,7,8,9,10,11,12,13,14,15,16,17,18,19,20,21,22,23,24,25,26,27,28]. However, the chemical extraction process consumes many concentrated inorganic acid and alkaline solutions [7,25]. As a consequence, the industry produces large quantities of wastewater streams that contains a significant number of chemical residues with highly acidic and highly alkaline flows, as well as high levels of organic matter (mostly protein), minerals, and pigments that are toxic to the environment and a risk to human health [5,6,7,8,9,10,11,12,13,14,15,16,17,18,19,20,21,22,23,24,25,26,27,28,29,30]. Currently, chitin production processes have not widely adopted the use of cleaner production methods that can increase the efficiencies of raw material utilization and reduce the environmental pollution issues [5,7,8,9,10,11,12,13,14,15,16,17,18,19,20,21,22,23,24,25]. In addition, the key organic components of the chitin production wastewater are protein-based residues that can be recovered as a valuable resource [5,6,7,8,9,10,11,12,13,14,15,16,17,18,19,20,21,22,23,24,25,26,27,28,29,30].
Recent research on treatment of chitin wastewater has focused on the recovery of sodium hydroxide, water, and protein from alkali waste streams by using ultrafiltration and nanofiltration [31]; treatment of strongly acidic flows by micro-electrolysis-contact oxidization connected to biological reactors; recovery of protein [32]; coagulation by chitosan combined with aluminum sulphate [30].
Coagulation is an important step to eliminate suspended solids and turbidity to enhance the efficiency of the wastewater treatment processes. There are many chemical coagulants widely used in both water and wastewater treatment, such as inorganic substances (aluminum, iron), synthetic organic polymers, and biopolymers because these coagulants offer a simple and cheap means of treatment [33,34,35].
Some studies have used various types of chemical coagulants and flocculants, such as iron salts [36], modified clays, ferromagnetic nanoparticle composites [37], magnetic beads with polyaluminum chloride [38]. However, many of these chemical coagulants are toxic and can adversely affect human health and the environment. Aluminum sulphate can cause cognitive and intellectual deterioration leading to memory loss, neurological diseases (affecting the nervous system), and the risk for Alzheimer’s disease [39]. In addition, the solid waste created by chemical substances needs to be handled carefully before disposal in the environment due to their nonbiodegradability and toxicity, resulting in additional costs for the solid residue disposal process.
Natural coagulants derived from plants or polysaccharides extracted from bacteria can be used not only to avoid these issues, but also to generate nutrient sludge that can be reused [40]. The most studied plant-based natural coagulants for water and wastewater treatment are Moringa oleifera seeds, Nirmali seeds, tannin, and Opuntia ficus-indica cactus [41,42]. Moreover, alginates and chitosan are classified as popular green coagulants for coagulation-flocculation operations.
Chitosan is biodegradable and nontoxic, and has been applied effectively as a natural coagulant and flocculant in water and wastewater treatment [39,43,44,45,46]. In addition, chitosan can remove the color from synthetic reactive dye wastewater [39,47], and heavy metal ions [48], especially in nutrient-rich wastewater [45]. The by-product chitosan, although the quality is not as high as the traditionally used coagulants, can still be expected to work effectively as a coagulant in the wastewater treatment process, but its treatment efficiencies have not yet been studied.
Many of the insoluble substances in chitin production wastewater can easily be settled out of the stream at room temperature because the solution is oversaturated. It is preferable to recover as many of these substances as possible before further treatment. Thus, a preliminary sedimentation process should be investigated to support the treatment process, as well as to reduce the use of needed coagulants.
The objectives of this paper were to: (1) Evaluate the removal efficiencies of a process of preliminary sedimentation followed by coagulation with by-product chitosan for total suspended solids (TSS) and turbidity, COD, total Kjeldahl nitrogen (TKN) and NH4+–nitrogen, total phosphorus (TP), and calcium ion contents from chitin production wastewater samples, (2) compare the treatment performance of by-product chitosan with those of chemical coagulant polyaluminum chloride (PAC) and polyacrylamide (PAA), and (3) investigate the feasibility of recovering crude protein from the wastewater streams. An optimization process was also carried out with the methods of conventional and Box-Wilson central composite experimental designs.
2. Materials and Methods
2.1. Sample of Wastewater
Samples of wastewater were collected from a site of Vietnam Food Joint Stock Company (VNF) in Ca Mau Province, Vietnam. VNF specializes in the production of chitin from shrimp scraps. The samples were taken from the equalization tank of the wastewater treatment system and characterized as shown in Table 1.
Table 1.
Characteristics of chitin production wastewater.
| Parameters | Values |
|---|---|
| PH | 3.55–7.41 |
| COD (mg·L−1) | 4245–23,600 |
| TKN (mg·L−1) | 639–1395 |
| NH4+–N (mg·L−1) | 145–842 |
| TP (mg·L−1) | 53–366 |
| TSS (mg·L−1) | 1880–10,400 |
| Ca2+ (mg·L−1) | 1200–3163 |
| Crude protein (mg·L−1) | 3994–8719 |
| Turbidity (NTU) | 363–1254 |
2.2. Reagents and Apparatus
A dry sample of chitosan by-product was obtained from VNF. The by-product is a low-quality factory waste which is substandard to commercial chitosan. The viscosity and deacetylating degrees of the chitosan stock solution are 583.8 cP (at 25 °C) and 79.55%, respectively.
Polyaluminum chloride (PAC) ([Al2(HO)nCl6-nxH2O]m), (1≤ n ≤5, m ≥ 10, PAC 31) was purchased from Weifang Tenor Chemical Co., Ltd., Qingdao, China. Polyacrylamide (PAA) (–CH2CHCONH2–)n, (Polymer cation C1492) was purchased from Specfloc KMR, Woodmansey, East Yorkshire, England. Acetic acid (>99%) was used as the solvent for dissolving chitosan.
The PAC stock solution was prepared at 50 g·L−1 in water. It took around 5 min to dissolve completely under stirring (100 rpm) at room temperature (RT). The PAA stock solution was prepared at 5 g·L−1 in water. It took around 2 h to dissolve PAA completely under stirring (100 rpm) at RT. Chitosan stock solution was prepared at 10 g·L−1 in aqueous acetic acid 1%; it took around 4 h to dissolve chitosan completely under stirring (100 rpm) at RT.
A six-unit combined mixer (JLT6, LOVIBOND, Dortmund, Germany) was used in all coagulation and flocculation (jar test) experiments.
2.3. Analytical Methods
Chemical oxygen demand (COD) (5220 C), total Kjeldahl nitrogen (TKN) (4500-Norg C), NH4+–N (ammonium nitrogen) (4500-NH3 C), total phosphorus (TP) (4500-PE), and calcium ion (Ca2+) (2340 A) were all measured using methods of the American Public Health Association, as described in the Standard Methods for Examination of Water and Wastewater 20th edition [49] and pH (4500-H+B), total suspended solids (TSS) (2450 D) using edition 22nd [50]. Crude protein content was calculated on the basis of total Kjeldahl nitrogen multiplied by 6.25 [51].
A COD reactor (HI839800-02, HANNA Company, Cluj-Napoca, Rumania), an UV–Vis Laboratory Spectrophotometer (DR5000-03, HACH Company, Loveland, CO, USA), Kjeldahl reactor (Behr Labor Technik, Düsseldorf, Germany), and a pH meter (SevenEasy™ S20, Mettler Toledo, Greifensee, Switzerland) were used in the analytical procedures.
2.4. Experimental Design
2.4.1. Preliminary Sedimentation Experiments
Preliminary sedimentation was carried out at RT (30 °C). The experiment was designed using 2 factors of pH value ranging from 4 to 11 and settling time ranging from 5 to 45 min. After an initial turbidity measurement, the wastewater sample was put into 1 L beakers with pH adjusted to a value between 4 to 11, at intervals of 0.5 unit. The beakers were left to settle by gravity at RT for a period of 5 to 45 min. The supernatant liquid was then measured for turbidity to calculate the turbidity removal efficiencies. All experiments were carried out in triplets and average values were reported.
2.4.2. Coagulation and Flocculation Experiments by Chitosan, PAC, and PAA
After the preliminary sedimentation experiments, wastewater samples were then used for the coagulation experiments. The experiments were carried out under different pH values and coagulant doses, and the experimental design was based on the Box-Wilson central composite method with circumscribed type [52]. In this design, the experimental points are selected at some distance α from the central position, based on the considered factors and repeatability desired. With the experiments repeated three times at the central position (n0 = 3), the number of experiments (N) of two factors (k = 2) is calculated N = 2k + 2k + n0 = 22 + 2 × 2 + 3 = 11. For three factors (k = 3), the number of experiments is 17. The value of α is calculated from the formula α4 + 2kα2 – 2k-1(k + 0.5n0) = 0. The value of α is 1.414 for k = 2 and 1.353 for k = 3.
The details of the experimental parameters designed for each experiment are given in Table 2, together with the turbidity removal efficiencies obtained from the coagulation experiments.
Table 2.
Coagulation experimental conditions.
| No | Experiment 1 (Chitosan) | Experiment 2 (PAC) | Experiment 3 (PAA) | Experiment 4 (PAC and PAA) | Experiment 5 (optimization) | ||||||||||||||||
|---|---|---|---|---|---|---|---|---|---|---|---|---|---|---|---|---|---|---|---|---|---|
| Initial turbidity: 523 NTU Turbidity after settling: 79 NTU |
Initial turbidity: 493 NTU Turbidity after settling: 81 NTU |
Initial turbidity: 511 NTU Turbidity after settling: 97 NTU |
Initial turbidity: 511 NTU Turbidity after settling: 100 NTU |
Initial turbidity: 963 NTU Turbidity after settling: 184 NTU |
|||||||||||||||||
| pH/Chitosan (mg·L−1)/Turbidity (NTU) | TRE * (%) | pH/PAC (mg·L−1)/Turbidity (NTU) | TRE * (%) | pH/PAA (mg·L−1)/Turbidity (NTU) | TRE * (%) | pH/PAC (mg·L−1)/PAA (mg·L−1)/Turbidity (NTU) | TRE * (%) | pH/Chitosan (mg·L−1)/Turbidity (NTU) | TRE * (%) | ||||||||||||
| 1 | 10.0 | 140.0 | 6 | 92.4 | 10.0 | 90.0 | 10 | 87.7 | 10.0 | 140.0 | 13 | 86.6 | 10.0 | 90.0 | 60.0 | 8 | 92.0 | 5.0 | 50.0 | 148 | 19.6 |
| 2 | 4.0 | 140.0 | 67 | 15.2 | 4.0 | 90.0 | 29 | 64.2 | 4.0 | 140.0 | 92 | 5.2 | 4.0 | 90.0 | 60.0 | 37 | 63.0 | 9.0 | 50.0 | 23 | 87.5 |
| 3 | 10.0 | 40.0 | 12 | 84.8 | 10.0 | 30.0 | 9 | 88.9 | 10.0 | 40.0 | 8 | 91.8 | 10.0 | 30.0 | 60.0 | 8 | 92.0 | 5.0 | 100.0 | 150 | 18.5 |
| 4 | 4.0 | 40.0 | 70 | 11.4 | 4.0 | 30.0 | 40 | 50.6 | 4.0 | 40.0 | 86 | 11.3 | 4.0 | 30.0 | 60.0 | 49 | 51.0 | 9.0 | 100.0 | 20 | 89.1 |
| 5 | 11.2 | 90.0 | 8 | 89.9 | 11.2 | 60.0 | 5 | 93.8 | 11.2 | 90.0 | 2 | 97.9 | 10.0 | 90.0 | 20.0 | 6 | 94.0 | 9.8 | 75.0 | 19 | 89.7 |
| 6 | 2.8 | 90.0 | 58 | 26.6 | 2.8 | 60.0 | 43 | 46.9 | 2.8 | 90.0 | 87 | 10.3 | 4.0 | 90.0 | 20.0 | 32 | 68.0 | 4.2 | 75.0 | 153 | 16.8 |
| 7 | 7.0 | 160.7 | 49 | 38.0 | 7.0 | 102.4 | 13 | 84.0 | 7.0 | 160.7 | 18 | 81.4 | 10.0 | 30.0 | 20.0 | 6 | 94.0 | 7.0 | 110.4 | 12 | 93.48 |
| 8 | 7.0 | 19.3 | 27 | 65.8 | 7.0 | 17.6 | 16 | 80.2 | 7.0 | 19.3 | 14 | 85.6 | 4.0 | 30.0 | 20.0 | 44 | 56.0 | 7.0 | 39.7 | 13 | 92.93 |
| 9 | 7.0 | 90.0 | 12 | 84.8 | 7.0 | 60.0 | 13 | 84.0 | 7.0 | 90.0 | 15 | 84.5 | 11.1 | 60.0 | 40.0 | 2 | 98.0 | 7.0 | 75.0 | 21 | 88.6 |
| 10 | 7.0 | 90.0 | 13 | 83.5 | 7.0 | 60.0 | 13 | 84.0 | 7.0 | 90.0 | 18 | 81.4 | 3.0 | 60.0 | 40.0 | 38 | 62.0 | 7.0 | 75.0 | 19 | 89.7 |
| 11 | 7.0 | 90.0 | 19 | 75.9 | 7.0 | 60.0 | 17 | 79.0 | 7.0 | 90.0 | 17 | 82.5 | 7.0 | 100.6 | 40.0 | 13 | 87.0 | 7.0 | 75.0 | 18 | 90.2 |
| 12 | 7.0 | 19.4 | 40.0 | 13 | 87.0 | ||||||||||||||||
| 13 | 7.0 | 60.0 | 67.1 | 13 | 87.0 | ||||||||||||||||
| 14 | 7.0 | 60.0 | 12.9 | 13 | 87.0 | ||||||||||||||||
| 15 | 7.0 | 60.0 | 40.0 | 14 | 86.0 | ||||||||||||||||
| 16 | 7.0 | 60.0 | 40.0 | 13 | 87.0 | ||||||||||||||||
| 17 | 7.0 | 60.0 | 40.0 | 13 | 87.0 | ||||||||||||||||
| 18 | 10.6 | 86.4 | - | 99.4 | 11.2 | 17.6 | - | 93.5 | 9.8 | 79.3 | - | 99.5 | 11.0 | 48.1 | 39.2 | - | 98.9 | 8.3 | 77.5 | - | 99.3 |
* TRE: Turbidity removal efficiency; optimal results based on the calculation of Minitab 16.0 software.
Wastewater samples of 500 mL were placed in six 1000 mL beakers. The pH value of each sample was adjusted according to the experimental design. The range of pH tested was from 4 to 10. The dose of chitosan or PAA was from 40 and 140 mg·L−1 (experiments 1 and 3) and the dose of PAC was from 30 to 90 mg·L−1 (experiment 2). In experiment 4, both PAC and PAA were used. The dosage of PAC was kept the same as above and the dose of PAA was from 20–60 mg·L−1.
In all the experiments, under stirring of 150 rpm at RT in the first 2 min, the different coagulant solutions were added. The flocculation time was 15 min at a stirring speed of 20 rpm. Finally, the samples were settled for 30 min and the turbidity of the supernatant liquid was measured. These TRE values were put in the Minitab 16.0 software to determine the optimal conditions. Under these optimal conditions, the values of COD, TKN, NH4+–N, TP, TSS, calcium ion, and crude protein concentrations before and after coagulation/flocculation were also measured.
The optimization experiment with chitosan was conducted using both the conventional experimental design and Box-Wilson central composite design. The experimental procedures were the same as above. The range of pH tested was from 5 to 9 and the dose of chitosan was from 50 and 100 mg·L−1.
2.5. Response Surface Designs and Analysis
The experimental design matrix and data processing, including optimal response surface based on the removal efficiency of turbidity (Table 2), were carried out by the Minitab 16.0 software and Microsoft Excel.
3. Results and Discussion
3.1. Preliminary Sedimentation Efficiency
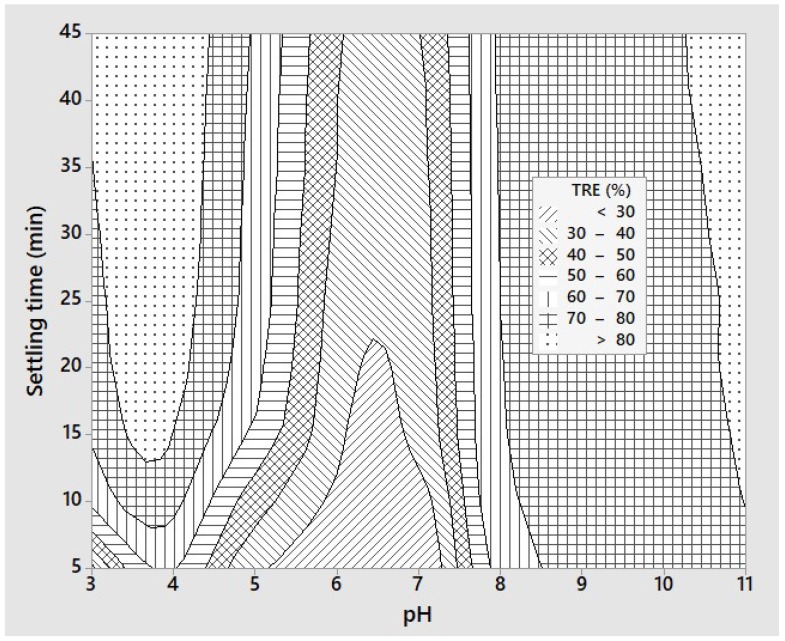
The efficiencies of the preliminary sedimentation experiments on turbidity removal are shown in Figure 1 as a contour plot of the two factors of wastewater pH and settling time. Figure 1 shows that the turbidity removal efficiency was strongly affected by the pH and two regions of high turbidity removal (TRE > 80%) could be identified at around pH 4 and 11. On the other hand, the TRE was lowest at a pH range of 6 to 7. In an acidic environment at pH 4, 90% of the amino acids in chitin wastewater is completely protonated, so that the flocs form quickly and are very large, and easily settle [39]. Electrostatic repulsion between the formed NH3+ groups disrupts hydrogen bonds and hydrophobic interactions after the protonation of the amino groups [53]. In other words, amino groups are deprotonated when the pH is increased to 6, and reducing sedimentation efficiency at pH values over 6. In an alkaline environment at pH 11, the sediment was mainly from the precipitation of calcium salt [54]. Figure 1 also indicates that a settling time of 15 min or higher was needed. After 30 min of settling, the TRE did not increase significantly as the amount of total suspended solids remaining in the wastewater was low and the sedimentation capacity diminished. As pH 4 was the most common value of pH of the wastewater streams, this pH was chosen as the optimal pH for preliminary sedimentation in subsequent experiments. If the pH of the wastewater had to be raised to 11, it would be costly and unsuitable. In addition, a settling time of 30 min was chosen for subsequent experiments.
Figure 1.
Contour plots of sedimentation efficiency showing effects of pH and settling time.
The removal efficiencies of other wastewater parameters such as COD and TSS are given in Table 3, together with those achieved from the coagulation experiments. The total COD of the sample was significantly reduced by 38% from 4245 to 2612 mg·L−1 before and after sedimentation, respectively. Most significantly, the removal of the total suspended solids was up to 93%. However, the removal efficiencies for sCOD, Ca2+, nitrogen, and phosphorus were low and insignificant. This was expected as preliminary sedimentation is effective for suspended solid removal.
Table 3.
Removal efficiencies of preliminary sedimentation and coagulation experiments.
| Coagulants | Samples | pH | tCOD (mg·L−1) | sCOD (mg·L−1) | TKN (mg·L−1) | NH4+-N (mg·L−1) | TP (mg·L−1) | TSS (mg·L−1) | Ca2+ (mg·L−1) | Crude Protein (mg·L−1) |
|---|---|---|---|---|---|---|---|---|---|---|
| Preliminary sedimentation | Inlet wastewater | 5.6 | 4245 | 1621 | 639 | 145 | 53 | 1880 | 1200 | 3996 |
| After settling | 4.0 | 2612 | 1584 | 579 | 133 | 40 | 139 | 1233 | 3617 | |
| * RE (%) | 38 | 2 | 9 | 8 | 25 | 93 | −3 | 9 | ||
| Chitosan 86.4 mg·L−1 |
After coagulation | 10.6 | 1741 | 1463 | 453 | 103 | 5.2 | 39 | 587 | 2829 |
| ** REC (%) | 33 | 8 | 22 | 23 | 87 | 72 | 52 | 22 | ||
| *** ToRE (%) | 59 | 10 | 29 | 29 | 90 | 98 | 51 | 29 | ||
| PAC 17.6 mg·L−1 |
After coagulation | 11.2 | 2116 | 1403 | 448 | 95 | 4.9 | 51 | 673 | 2800 |
| ** REC (%) | 19 | 11 | 23 | 29 | 88 | 63 | 45 | 23 | ||
| *** ToRE (%) | 50 | 13 | 30 | 34 | 91 | 97 | 44 | 30 | ||
| PAA 79.3 mg·L−1 |
After coagulation | 9.8 | 2298 | 1246 | 520 | 146 | 4.2 | 38 | 587 | 3252 |
| ** REC (%) | 12 | 21 | 10 | −10 | 90 | 73 | 52 | 10 | ||
| *** ToRE (%) | 46 | 23 | 19 | −1 | 92 | 98 | 51 | 19 | ||
| Mixture of PAC and PAA 87.3 mg·L−1 |
After coagulation | 11.0 | 1875 | 1645 | 462 | 98 | 4.3 | 44 | 660 | 2888 |
| ** REC (%) | 28 | −4 | 20 | 26 | 89 | 68 | 46 | 20 | ||
| *** ToRE (%) | 56 | −1 | 28 | 32 | 92 | 98 | 45 | 28 |
* RE: Removal efficiency; ** REC: Removal efficiency of coagulation; *** ToRE: Total removal efficiency.
3.2. Coagulation by Chitosan (Experiment 1)
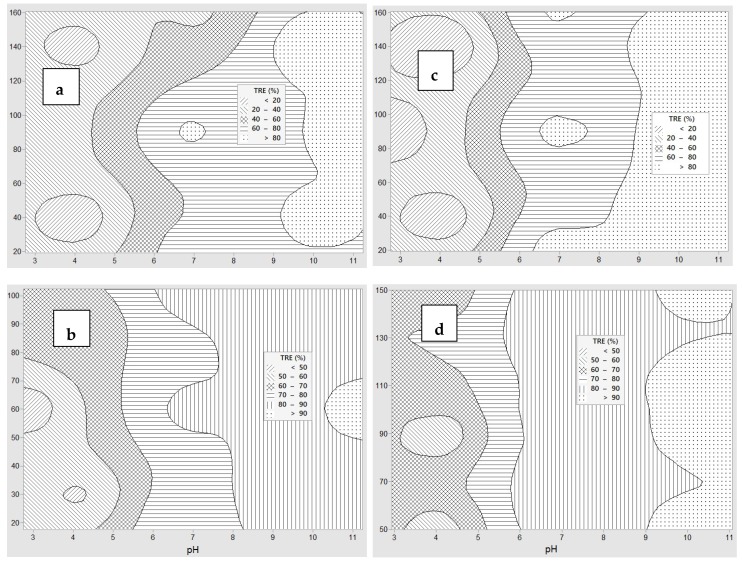
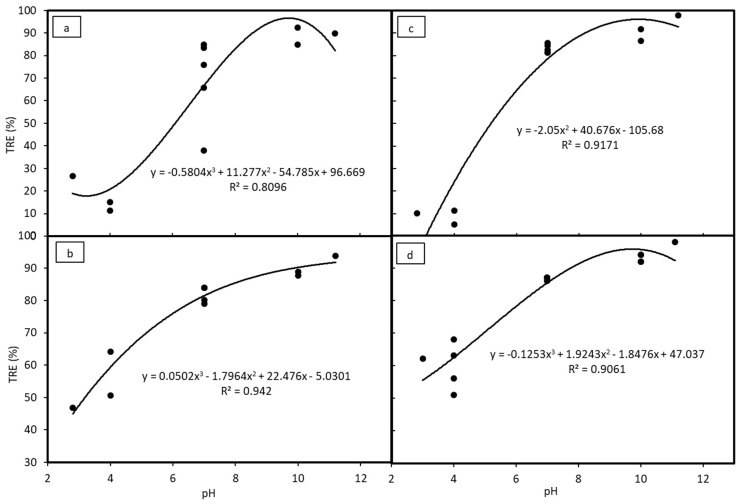
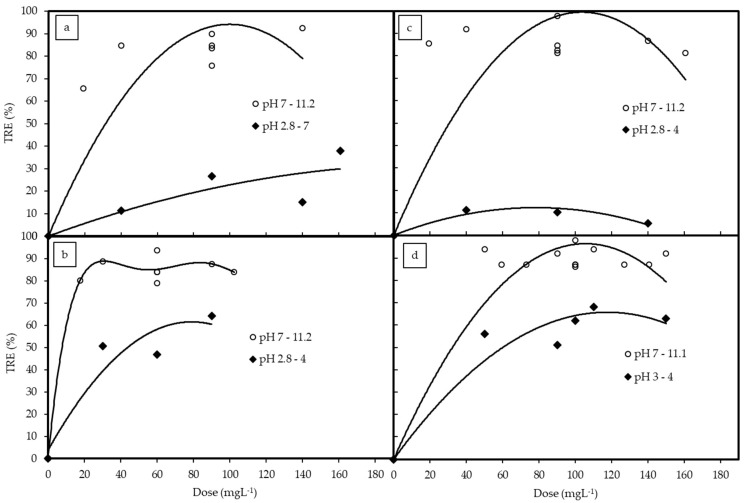
The TRE of the coagulation experiments with different coagulations are given in Table 2. A contour plot of TRE was also constructed to show the effects of pH and doses of coagulants, as given in Figure 2. In addition, the effects of solution pH and doses of coagulants are also shown in Figure 3 and Figure 4, respectively. In all cases, the TRE was strongly affected by solution pH and the coagulant doses.
Figure 2.
Contour plots of turbidity removal efficiencies with coagulation showing effects of pH and coagulant dose (mg·L−1): (a) Chitosan, (b) polyaluminum chloride (PAC), (c) polyacrylamide (PAA), (d) PAC + PAA.
Figure 3.
Turbidity removal efficiencies at different pH values with coagulant: (a) Chitosan, (b) PAC, (c) PAA, (d) PAC + PAA.
Figure 4.
Turbidity removal efficiencies at different coagulant concentrations with coagulant: (a) Chitosan, (b) PAC, (c) PAA, (d) PAC + PAA.
For chitosan, the TRE achieved was above 80% at pH 7 with the dose of chitosan of about 90 mg·L−1 and the region mostly located in the pH ranged from 10 to 11 (Figure 2a). Based on Box-Wilson model calculation, the optimum TRE value was 99.4% with pH 10.6 and chitosan concentration 86.4 mg·L−1. As can be seen in Figure 3a, effective TRE was achieved at the high pH ranges from 7 up to 12. This performance did not change much when the chitosan dose was greater than 80 mg·L−1, as shown in Figure 4a.
The removal efficiencies of other wastewater parameters at the optimal pH of 10.6 and chitosan dose of 86.4 mg·L−1 are given in Table 3. The concentrations of most parameters in the treated effluent decreased significantly, such as total COD (59%), TKN and NH4+–N (29%), TP (90%), TSS (98%), and Ca2+ (51%) (Table 3). However, the concentration of soluble COD was only reduced by about 10% indicating that the coagulation was not as effective for the removal of soluble proteins contained in the sample [55]. The total recovery rate for the crude protein content from the sample after preliminary sedimentation and chitosan coagulation was up to 29%.
3.3. Coagulation by PAC (Experiment 2)
For PAC, TRE reached over 90% at around pH 11 (Figure 2b). The performance of PAC in the coagulation treatment was similar to that of chitosan: The TRE was higher at a higher pH, and it was highest at around pH 11 (Figure 3b). This is clearly shown in Figure 4b, as the measured TRE had fluctuated around 85% at the pH ranging from 7 to more than 11. However, the PAC dose did not affect TRE much even though the dosage was lower than 20 mg·L−1 or higher than 110 mg·L−1. Hence, the optimal TRE was calculated to be 93.5% at pH = 11.2 at PAC dose 17.6 mg·L−1.
The removal efficiencies of other wastewater parameters at the optimal pH of 11.2 and PAC dose of 17.6 mg·L−1 are given in Table 3. PAC had partly removed residues in wastewater as tCOD (50%), sCOD (13%), TKN and NH4+–N (30–34%), TP (91%), TSS (97%), and Ca2+ (44%). The recovery efficiency of crude protein content (30%) after the treatment was similar to that of chitosan (29%), but overall, chitosan was more effective as indicated by the removal efficiencies above.
3.4. Coagulation by PAA (Experiment 3)
The effects of pH and coagulant dose for PAA are illustrated in Figure 2c. The influence of pH on the coagulation process by PAA was also similar to that of PAC (Figure 3c), but the influence of coagulant dose showed a converse trend. The TRE was highest at the pH between 7 to 11.2 with a PAA dose of 80 mg·L−1 and the TRE gradually decreased as the coagulant dose increased (Figure 4c). This was also reflected through the optimal results, being 99.5% TRE at pH 9.8 and PAA dose of 79.3 mg·L−1. There were also some regions where the TRE was over 80% at around pH 7 (Figure 2c). The overall performance of coagulation with the PAA were at the same level as chitosan, but PAA is not as safe for the environment because it is a chemical coagulant.
The removal efficiencies of other wastewater parameters at the optimal pH of 9.8 and PAA dose of 79.3 mg·L−1 are given in Table 3. The parameter changes after coagulation by PAA were as follows: tCOD (46%), sCOD (23%), TKN (19%), TP (92%), TSS (98%), and Ca2+ (51%) (Table 3). Compared to chitosan, PAA’s effect on protein recovery was much lower, being 29% and 19%, respectively. The removal of organic nitrogen and ammonium were both relatively poor, while the soluble organic content was most efficiently reduced.
3.5. Coagulation and Flocculation by PAC and PAA (Experiment 4)
Contour plot Figure 2d shows the effects of pH and mixture doses of PAC and PAA on TRE. It can be said that the alkaline pH range had a good effect on the coagulation process of the PAC and PAA mixture (Figure 2d). The best TRE was achieved at about pH 11 (Figure 3d) with the total mixture dose of around 100 mg·L−1 (Figure 4d). The optimal result was 98.9% of TRE at pH 11.0, and PAC dose of 48.1 mg·L−1 and PAA dose of 39.2 mg·L−1. Compared to the single coagulant of PAA or PAC, the performance of the mixture was less effective than PAA, but more effective than PAC.
The removal efficiencies of other wastewater parameters at the optimal pH of 11.0 and PAC dose of 48.1 mg·L−1 and PAA dose of 39.2 mg·L−1 are given in Table 3. The agglomerated coagulation treatment using PAC and PAA mixtures had better results than using PAC or PAA separately, as follows: Total COD reduced by 56%, was higher than that treated by PAC (50%) and PAA (46%). TKN and NH4+–N reduced slightly to the equivalent of using PAC (>30%), but the effectiveness was noticeably higher compared to PAA. TP and TSS removal efficiencies of the mixture were similar to that of a single coagulant at more than 90%. However, soluble COD could not be removed effectively by PAC and PAA mixtures. The rate of protein recovery of this mixture (28%) was similar to chitosan (29%) and PAC (30%).
3.6. Comparison between Studied Coagulants
In general, COD removal efficiency of chitosan was the best (~60%). Performances of chitosan, PAC, and the mixture were nearly the same (~30%) in TKN and crude protein recovery. TP removal efficiencies of chitosan, PAA, and the mixture were quite similar (>90%). Of note, the removal efficiencies of TSS (97%) and calcium ion were quite high because the process was carried out in alkaline conditions with high concentrations of calcium ion.
3.7. Optimal Conditions of Chitosan Coagulation
3.7.1. Traditional Experimental Design
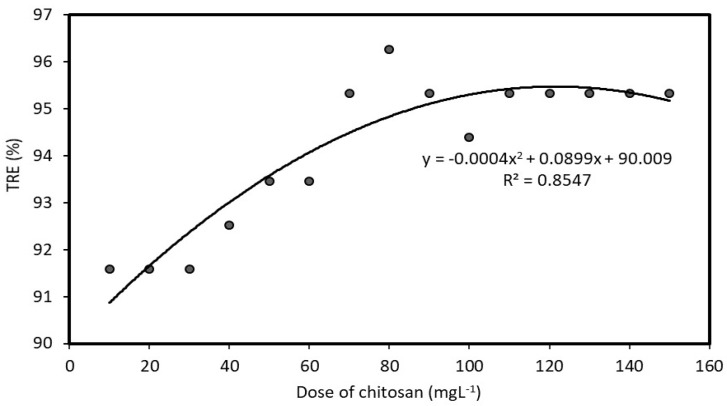
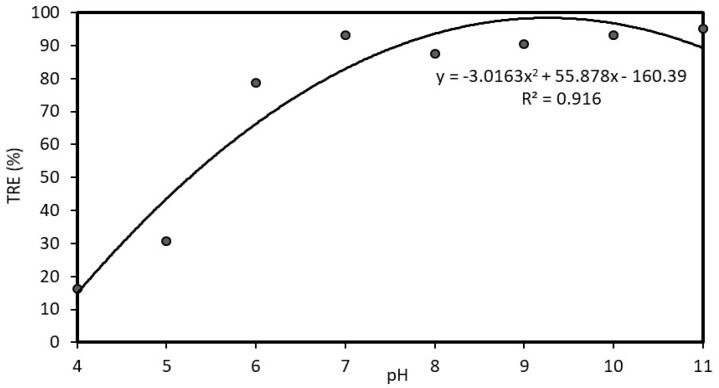
The results of the optimization process of coagulation with chitosan are shown in Figure 5 and Figure 6. In Figure 5, the turbidity treatment efficiency was evaluated with different doses of chitosan at pH 7; it shows that the TRE increased as the dose increased. The highest TRE of over 96% is at a chitosan dose of 80 mg·L−1. Moreover, the TRE remained about the same in the dose range between 80 and 150 mg·L−1. In Figure 6, the TRE was evaluated with a dose of 80 mg·L−1 at a range of pH values. The TRE efficiency was low at a low pH and increased from less than 20% to about 90% as the pH values increased to about 7. Thereafter, the TRE remained about the same. Therefore, the suitable pH for this coagulation experiment was in the range between 7 and 11. Practically, the neutral value of pH 7 can be selected as the optimal pH, considering the effectiveness of coagulation, as well as the lower costs without the need to raise the pH value.
Figure 5.
Correlation between turbidity removal efficiency (TRE) and chitosan dose at pH 7.
Figure 6.
Correlation between turbidity removal efficiency (TRE) and pH at chitosan dose of 80 mg·L−1.
3.7.2. Box-Wilson Central Composite Design (Experiment 5)
The results of process optimization by the use of the Box-Wilson central composite design is given in Table 2 as Experiment 5. The optimal turbidity removal efficiency from the central composite design was up to 99.3% at pH = 8.3, and the optimal chitosan dose was calculated at 77.5 mg·L−1. These results were consistent with those obtained from the traditional experiment design. The optimal pH value of 8.3 is slightly higher than pH 7, but this is consistent with the fact that the TRE did not change significantly between the pH range of 7 to 11 as observed in the traditional experimental design. The experimental conditions of wastewater characteristics were also changed due to sample availability. In particular, the ratio between crude protein content and calcium ion were different. In comparison to Experiment 1, the total COD in Experiment 5 was nearly doubled (7217 compared to 4245 mg·L−1), and the crude protein content was also more than doubled (8721 compared to 3996 mg·L−1). However, the calcium ion content only increased by about 50% (1844 compared to 1200 mg·L−1). Therefore, due to the change of components in this sample, it contains more amino acids which determine the optimal condition of this coagulation test as about neutral pH.
3.7.3. Comparison of Treatment Performances between Two Optimal Points from Traditional Design and Central Composite Design
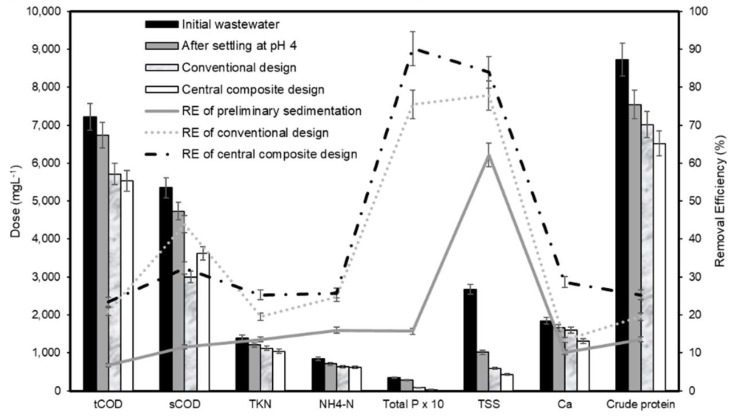
Figure 7 shows the changes in wastewater characteristics after preliminary sedimentation and coagulation at optimal experimental conditions, as well as the corresponding removal efficiencies. As shown in Figure 7, the organic and inorganic contents removed by the central composite design was higher than the conventional design. This could be due to the fact that the central composite design enabled the study of interactive effects between operating treatment conditions and thus, more accurate optimal treatment conditions could be obtained [56]. Therefore, it can be concluded that by using chitosan solution to remove the residues in this wastewater, the optimal treatment efficiency was obtained at pH 8.3 and the chitosan dose of 77.5 mg·L−1.
Figure 7.
Changes of characteristics of wastewater after preliminary sedimentation and coagulation at optimum experimental conditions (left axis) and removal efficiencies (right axis).
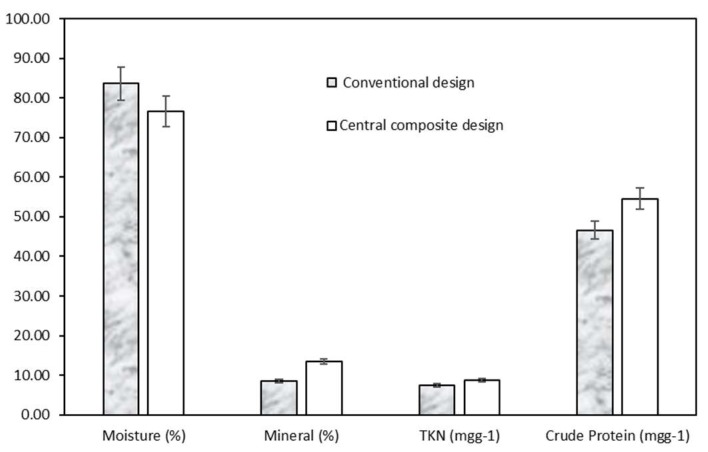
The basic components of the post-treatment sediments obtained from the two experimental design are also shown in Figure 8. It can be said that the mineral and crude protein fractions in the solid residue were higher and therefore the moisture was lower for the central composite design. With a crude protein content of up to 55 mg·g−1, the sediment can be reused for animal feeds or nutritional supplements as fertilizer.
Figure 8.
Basic components of post-treatment sediment with two experimental designs.
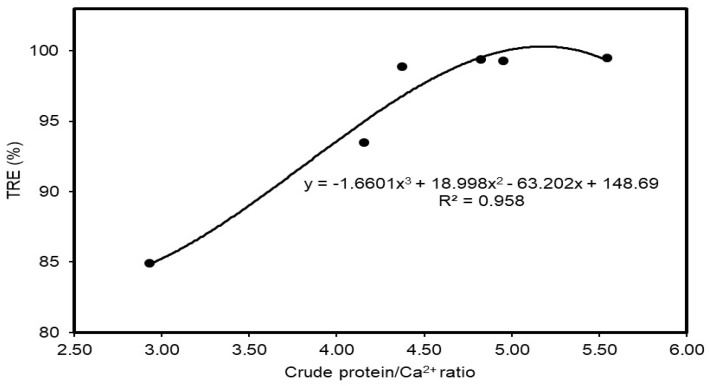
3.8. Correlation between Crude Protein and Calcium Ratio with Turbidity Removal Performances
The ratio between the contents of crude protein and calcium ion affects the charge structures of the suspended particles, and the effect of this ratio (wt) on the turbidity removal efficiency was evaluated and is shown in Figure 9. At the ratio of 3, the TRE was relatively low at about 85%. This effect tended to increase until the ratio was about 4.5; after that it did not show significant changes. Therefore, it can be asserted that the higher the crude protein content and calcium ratio in the wastewater sample, the higher the TRE. This result is based on the fact that the content of organic matters was always greater than the inorganic content (described by crude protein and calcium concentrations). Consequently, the organic components occupied a major part of suspended solids, which caused wastewater to become turbid.
Figure 9.
Effects of ratio of crude protein and calcium ion on turbidity removal efficiencies.
4. Conclusions
A pretreatment process consisting of preliminary sedimentation followed by coagulation using by-product chitosan was evaluated for the treatment of chitin production wastewater, as well as the potential for crude protein recovery. The coagulant effectiveness of by-product chitosan was also compared to those of polyaluminum chloride and polyacrylamide. The preliminary sedimentation process removed over 80% of turbidity and 93% of TSS at pH 4 after 30 min. Optimal coagulation with by-product chitosan was achieved in pH ranging from 7 to 11. The removal efficiency was also affected by the ratio between crude protein and calcium content of the sample. With this ratio at around 5, combined with a dose of chitosan 77.5 mg·L−1 and pH = 8.3, the removal efficiency for TSS was 84%, tCOD 23%, sCOD 32%, TKN and ammonium 25%, TP 90%, Ca2+ 29%, and crude protein 25%. At lower ratios, chitosan was still the most effective compared to other chemical coagulants in removing inorganic and organic substances of chitin production wastewater.
Overall, coagulation by chitosan removed up to 99.4% of turbidity at pH = 10.6 with a chitosan dose of 86.4 mg·L−1. The removal efficiencies were tCOD (59%), sCOD (10%), TKN and NH4+–N (29%), TP (90%), TSS (98%), and Ca2+ (51%). Coagulation by PAC removed up to 93.5% of turbidity at pH = 11.2 with a PAC dose of 17.6 mg·L−1. The removal efficiencies were tCOD (50%), sCOD (13%), TKN and NH4+–N (30–34%), TP (91%), TSS (97%), and Ca2+ (44%). Coagulation by PAA removed up to 99.5% of turbidity at pH = 9.8 with a PAA dose of 79.3 mg·L−1. The removal efficiencies were tCOD (46%), sCOD (23%), TKN (19%), TP (92%), TSS (98%), and Ca2+ (51%). Coagulation by PAC and PAA combined achieved up to 98.9% of turbidity removal at pH = 11.0 and a PAC dose of 48.1 mg·L−1 and PAA dose of 39.2 mg·L−1. The removal efficiencies were tCOD (56%), TKN (28%) and NH4+–N (32%), TP (92%), TSS (98%), and Ca2+ (45%).
The crude protein content in the sediment was up to 55 mg·g−1; this could be suitable for nutritional supplements for animal feed or fertilizer for crops. This study indicated that the treatment process is beneficial to chitin producers in not only minimizing the cost of the wastewater treatment systems, but also recovering a highly nutritional sediment product.
Author Contributions
S.-L.W. and T.P.N. designed the study; T.P.N. and N.V.N.T. performed the experiment; N.V.N.T., Q.J.Y., T.P.N., and S.-L.W. complied and analyzed the data; N.V.N.T., Q.J.Y., T.P.N., and S.-L.W. wrote the paper; S.-L.W. and T.P.N. acquired funding and supervised the project. All authors have read and agreed to the published version of the manuscript.
Funding
This research was supported in part with a scholarship from the Vietnamese government (Project 911) and by a grant from the Ministry of Science and Technology, Taiwan (MOST 106-2320-B-032-001-MY3).
Conflicts of Interest
The authors declare no conflict of interest.
References
- 1.Trung T.S., Bao H.N.D. Physicochemical properties and antioxidant activity of chitin and chitosan prepared from pacific white shrimp waste. Int. J. Carbohydr. Chem. 2015;2015 doi: 10.1155/2015/706259. [DOI] [Google Scholar]
- 2.Mao X., Guo N., Sun J. Cleaner production guide of chito/chitin oligosaccharides and its monomer. In: Zhao L., editor. Oligosaccharides of Chitin and Chitosan: Bio-Manufacture and Applications. Springer; Singapore: 2019. pp. 107–127. [DOI] [Google Scholar]
- 3.Su W., Yu S., Wu D., Xia M., Wen Z., Yao Z., Tang J., Wu W. A critical review of cast-off crab shell recycling from the perspective of functional ands versatile biomaterials. Environ. Sci. Pollut. Res. 2019:31581–31591. doi: 10.1007/s11356-019-06318-0. [DOI] [PubMed] [Google Scholar]
- 4.Wang S.-L., Liang T.-W. Microbial reclamation of squid pens and shrimp shells. Res. Chem. Intermed. 2017;43:3445–3462. doi: 10.1007/s11164-016-2425-y. [DOI] [Google Scholar]
- 5.Doan C.T., Tran T.N., Wen I., Nguyen V.B., Nguyen A.D., Wang S.-L. Conversion of shrimp head waste for production of a thermotolerant, detergent-stable, alkaline protease by paenibacillus sp. Catalysts. 2019;9:798. doi: 10.3390/catal9100798. [DOI] [Google Scholar]
- 6.Wang S.-L., Su Y.-C., Nguyen A.D. Reclamation of shrimp heads for the production of α-glucosidase inhibitors by Staphylococcus sp. TKU043. Res. Chem. Intermed. 2018;44:4929–4937. doi: 10.1007/s11164-018-3345-9. [DOI] [Google Scholar]
- 7.Doan C.T., Tran T.N., Vo T.P.K., Nguyen A.D., Wang S.-L. Chitin extraction from shrimp waste by liquid fermentation using an alkaline protease-producing strain, Brevibacillus parabrevis. Int. J. Biol. Macromol. 2019;131:706–715. doi: 10.1016/j.ijbiomac.2019.03.117. [DOI] [PubMed] [Google Scholar]
- 8.Wang S.-L., Chio S.-H. Deproteinization of shrimp and crab shell with the protease of Pseudomonas aeruginosa K-187. Enzym. Microb. Technol. 1998;22:629–633. doi: 10.1016/S0141-0229(97)00264-0. [DOI] [PubMed] [Google Scholar]
- 9.Nguyen V.B., Wang S.-L. Reclamation of marine chitinous materials for the production of α-glucosidase inhibitors via microbial conversion. Mar. Drugs. 2017;15:350. doi: 10.3390/md15110350. [DOI] [PMC free article] [PubMed] [Google Scholar]
- 10.Hsu C.-H., Nguyen A.D., Wang S.-L. Conversion of shrimp heads to α-glucosidase inhibitors via co-culture of Bacillus mycoides TKU040 and Rhizobium sp. TKU041. Res. Chem. Intermed. 2018;44:4597–4607. doi: 10.1007/s11164-018-3266-7. [DOI] [Google Scholar]
- 11.Nguyen V.B., Wang S.-L. Production of potent antidiabetic compounds from shrimp head powder via Paenibacillus conversion. Process Biochem. 2019;76:18–24. doi: 10.1016/j.procbio.2018.11.004. [DOI] [Google Scholar]
- 12.Doan C.T., Tran T.N., Nguyen V.B., Nguyen A.D., Wang S.-L. Production of a thermostable chitosanase from shrimp heads via Paenibacillus mucilaginosus TKU032 conversion and its application in the preparation of bioactive chitosan oligosaccharides. Mar. Drugs. 2019;17:217. doi: 10.3390/md17040217. [DOI] [PMC free article] [PubMed] [Google Scholar]
- 13.Nguyen V.B., Nguyen T.H., Doan C.T., Tran T.N., Nguyen A.D., Kuo Y.-H., Wang S.-L. Production and bioactivity-guided isolation of antioxidants with α-glucosidase inhibitory and anti-NO properties from marine chitinous materials. Mol. J. Synth. Chem. Nat. Prod. Chem. 2018;23:1124. doi: 10.3390/molecules23051124. [DOI] [PMC free article] [PubMed] [Google Scholar]
- 14.Doan C.T., Tran T.N., Nguyen V.B., Nguyen A.D., Wang S.-L. Reclamation of marine chitinous materials for chitosanase production via microbial conversion by Paenibacillus macerans. Mar. Drugs. 2018;16:429. doi: 10.3390/md16110429. [DOI] [PMC free article] [PubMed] [Google Scholar]
- 15.Doan C.T., Tran T.N., Nguyen V.B., Nguyen A.D., Wang S.-L. Conversion of squid pens to chitosanases and proteases via Paenibacillus sp. TKU042. Mar. Drugs. 2018;16:83. doi: 10.3390/md16030083. [DOI] [PMC free article] [PubMed] [Google Scholar]
- 16.Doan C.T., Tran T.N., Nguyen M.T., Nguyen V.B., Nguyen A.D., Wang S.-L. Anti-α-glucosidase activity by a protease from Bacillus licheniformis. Molecules. 2019;24:691. doi: 10.3390/molecules24040691. [DOI] [PMC free article] [PubMed] [Google Scholar]
- 17.Tran T.N., Doan C.T., Nguyen A.D., Wang S.-L. The isolation of chitinase from Streptomyces thermocarboxydus and its application in the preparation of chitin oligomers. Res. Chem. Intermed. 2019;45:727–742. doi: 10.1007/s11164-018-3639-y. [DOI] [Google Scholar]
- 18.Liang T.-W., Wang S.-L. Recent advances in exopolysaccharides from Paenibacillus spp.: Production, isolation, structure, and bioactivities. Mar. Drugs. 2015;13:1847–1863. doi: 10.3390/md13041847. [DOI] [PMC free article] [PubMed] [Google Scholar]
- 19.Liang T.-W., Wu C.-C., Cheng W.-T., Chen Y.-C., Wang C.-L., Wang I.-L., Wang S.-L. Exopolysaccharides and antimicrobial biosurfactants produced by Paenibacillus macerans TKU029. Appl. Biochem. Biotechnol. 2014;172:933–950. doi: 10.1007/s12010-013-0568-5. [DOI] [PMC free article] [PubMed] [Google Scholar]
- 20.Liang T.-W., Tseng S.-C., Wang S.-L. Production and characterization of antioxidant properties of exopolysaccharide (s) from Peanibacillus mucilaginosus TKU032. Mar. Drugs. 2016;14:40. doi: 10.3390/md14020040. [DOI] [PMC free article] [PubMed] [Google Scholar]
- 21.Wang S.-L., Li H.-T., Zhang L.-J., Lin Z.-H., Kuo Y.-H. Conversion of squid pen to homogentisic acid via Paenibacillus sp. TKU036 and the antioxidant and anti-inflammatory activities of homogentisic acid. Mar. Drugs. 2016;14:183. doi: 10.3390/md14100183. [DOI] [PMC free article] [PubMed] [Google Scholar]
- 22.Nguyen V.B., Nguyen A.D., Wang S.-L. Utilization of fishery processing by-product squid pens for α-glucosidase inhibitors production by Paenibacillus sp. Mar. Drugs. 2017;15:274. doi: 10.3390/md15090274. [DOI] [PMC free article] [PubMed] [Google Scholar]
- 23.Hsu C.-H., Nguyen A.D., Chen Y.-W., Wang S.-L. Tyrosinase inhibitors and insecticidal materials produced by Burkholderia cepacia using squid pen as the sole carbon and nitrogen source. Res. Chem. Intermed. 2014;40:2249–2258. doi: 10.1007/s11164-014-1602-0. [DOI] [Google Scholar]
- 24.Liang T.-W., Chen W.-T., Lin Z.-H., Kuo Y.-H., Nguyen A.D., Pan P.-S., Wang S.-L. An amphiprotic novel chitosanase from Bacillus mycoides and its application in the production of chitooligomers with their antioxidant and anti-inflammatory evaluation. Int. J. Mol. Sci. 2016;17:1302. doi: 10.3390/ijms17081302. [DOI] [PMC free article] [PubMed] [Google Scholar]
- 25.Wang C.-H., Doan C.T., Nguyen V.B., Nguyen A.D., Wang S.-L. Reclamation of fishery processing waste: A mini-review. Molecules. 2019;24:2234. doi: 10.3390/molecules24122234. [DOI] [PMC free article] [PubMed] [Google Scholar]
- 26.Nguyen V.B., Chen S.-P., Nguyen T.H., Nguyen M.T., Tran T.T.T., Doan C.T., Tran T.N., Nguyen A.D., Kuo Y.-H., Wang S.-L. Novel efficient bioprocessing of marine chitins into active anticancer prodigiosin. Mar. Drugs. 2020;18:15. doi: 10.3390/md18010015. [DOI] [PMC free article] [PubMed] [Google Scholar]
- 27.Tran T.N., Doan C.T., Nguyen V.B., Nguyen A.D., Wang S.-L. Anti-oxidant and anti-diabetes potential of water-soluble chitosan–glucose derivatives produced by maillard reaction. Polymers. 2019;11:1714. doi: 10.3390/polym11101714. [DOI] [PMC free article] [PubMed] [Google Scholar]
- 28.Tran T.N., Doan C.T., Nguyen M.T., Nguyen V.B., Vo T.P.K., Nguyen A.D., Wang S.-L. An exochitinase with N-Acetyl-β-glucosaminidase-like activity from shrimp head conversion by streptomyces speibonae and its application in hydrolyzing β-chitin powder to produce N-Acetyl-d-glucosamine. Polymers. 2019;11:1600. doi: 10.3390/polym11101600. [DOI] [PMC free article] [PubMed] [Google Scholar]
- 29.Wang S.-L., Yu H.-T., Tsai M.-H., Doan C.T., Nguyen A.D. Conversion of squid pens to chitosanases and dye adsorbents via Bacillus cereus. Res. Chem. Intermed. 2018;44:4903–4911. doi: 10.1007/s11164-018-3343-y. [DOI] [Google Scholar]
- 30.Dotto G.L., Rosa G.S., Moraes M.A., Weska R.F., Pinto L.A.A. Treatment of chitin effluents by coagulation–flocculation with chitin and aluminum sulfate. J. Environ. Chem. Eng. 2013;1:50–55. doi: 10.1016/j.jece.2013.03.006. [DOI] [Google Scholar]
- 31.Zhao L., Xia W. Stainless steel membrane UF coupled with NF process for the recovery of sodium hydroxide from alkaline wastewater in chitin processing. Desalination. 2009;249:774–780. doi: 10.1016/j.desal.2009.01.036. [DOI] [Google Scholar]
- 32.Chen X., Li C., Ji X., Zhong Z., Li P. Recovery of protein from discharged wastewater during the production of chitin. Bioresour. Technol. 2008;99:570–574. doi: 10.1016/j.biortech.2006.12.029. [DOI] [PubMed] [Google Scholar]
- 33.Teh C.Y., Budiman P.M., Shak K.P.Y., Wu T.Y. Recent advancement of coagulation–flocculation and its application in wastewater treatment. Ind. Eng. Chem. Res. 2016;55:4363–4389. doi: 10.1021/acs.iecr.5b04703. [DOI] [Google Scholar]
- 34.Sillanpää M., Ncibi M.C., Matilainen A., Vepsäläinen M. Removal of natural organic matter in drinking water treatment by coagulation: A comprehensive review. Chemosphere. 2018;190:54–71. doi: 10.1016/j.chemosphere.2017.09.113. [DOI] [PubMed] [Google Scholar]
- 35.Jarvis P., Sharp E., Pidou M., Molinder R., Parsons S.A., Jefferson B. Comparison of coagulation performance and floc properties using a novel zirconium coagulant against traditional ferric and alum coagulants. Water Res. 2012;46:4179–4187. doi: 10.1016/j.watres.2012.04.043. [DOI] [PubMed] [Google Scholar]
- 36.Jiang J.-Q., Lloyd B. Progress in the development and use of ferrate(VI) salt as an oxidant and coagulant for water and wastewater treatment. Water Res. 2002;36:1397–1408. doi: 10.1016/S0043-1354(01)00358-X. [DOI] [PubMed] [Google Scholar]
- 37.Zhang M., Xiao F., Xu X.Z., Wang D.S. Novel ferromagnetic nanoparticle composited PACls and their coagulation characteristics. Water Res. 2012;46:127–135. doi: 10.1016/j.watres.2011.10.025. [DOI] [PubMed] [Google Scholar]
- 38.Ahmadi M., Jorfi S., Kujlu R., Ghafari S., Soltani R.D.C., Haghighifard N.J. A novel salt-tolerant bacterial consortium for biodegradation of saline and recalcitrant petrochemical wastewater. J. Environ. Manage. 2017;191:198–208. doi: 10.1016/j.jenvman.2017.01.010. [DOI] [PubMed] [Google Scholar]
- 39.Rao L.N. Coagulation and flocculation of industrial wastewater by chitosan. IJEAS. 2015;2:50–52. [Google Scholar]
- 40.Das R. Polymeric Materials for Clean Water. Springer; Berlin, Germany: 2019. [Google Scholar]
- 41.Choy S.Y., Prasad K.M.N., Wu T.Y., Raghunandan M.E., Ramanan R.N. Utilization of plant-based natural coagulants as future alternatives towards sustainable water clarification. J. Environ. Sci. 2014;26:2178–2189. doi: 10.1016/j.jes.2014.09.024. [DOI] [PubMed] [Google Scholar]
- 42.Choy S., Prasad K., Wu T., Ramanan R. A review on common vegetables and legumes as promising plant-based natural coagulants in water clarification. Int. J. Environ. Sci. Technol. 2015;12:367. doi: 10.1007/s13762-013-0446-2. [DOI] [Google Scholar]
- 43.Zeng D., Wu J., Kennedy J.F. Application of a chitosan flocculant to water treatment. Carbohydr. Polym. 2008;71:135–139. doi: 10.1016/j.carbpol.2007.07.039. [DOI] [Google Scholar]
- 44.Renault F., Sancey B., Badot P.M., Crini G. Chitosan for coagulation/flocculation processes—An eco-friendly approach. Eur. Polym. J. 2009;45:1337–1348. doi: 10.1016/j.eurpolymj.2008.12.027. [DOI] [Google Scholar]
- 45.Sahoo D., Sahoo S., Mohanty P., Sasmal S., Nayak P.L. Chitosan: A new versatile bio-polymer for various applications. Des. Monomers Polym. 2012;12:377–404. doi: 10.1163/138577209X12486896623418. [DOI] [Google Scholar]
- 46.Muzzarelli R.A. Chitin. Elsevier; Amsterdam, The Netherlands: 2013. [Google Scholar]
- 47.Sakkayawong N., Thiravetyan P., Nakbanpote W. Adsorption mechanism of synthetic reactive dye wastewater by chitosan. J. Colloid Interf. 2005;286:36–42. doi: 10.1016/j.jcis.2005.01.020. [DOI] [PubMed] [Google Scholar]
- 48.Wan Ngah W.S., Teong L.C., Hanafiah M.A.K.M. Adsorption of dyes and heavy metal ions by chitosan composites: A review. Carbohydr. Polym. 2011;83:1446–1456. doi: 10.1016/j.carbpol.2010.11.004. [DOI] [Google Scholar]
- 49.American Public Health Association . 5220 Chemical Oxygen Demand (COD) 20th ed. American Public Health Association; Washington, DC, USA: 1999. Standard methods for the examination of water and wastewater. [Google Scholar]
- 50.American Public Health Association . Standard Methods for the Examination of Water and Wastewater. 22nd ed. American Water Works Association; Denver, CO, USA: Water Environment Federation; Virginia, VA, USA: 2012. [Google Scholar]
- 51.FAO . FAO Food and Nutrition Paper No. 77. Food and Agricultural Organazation of the United Nations; Rome, Italy: 2003. Food energy-methods of analysis and conversion factors. Report of a technical workshop. [Google Scholar]
- 52.Box G.E., Wilson K.G. On the experimental attainment of optimum conditions. J. Royal Stat. Soc. 1951;13:1–45. doi: 10.1111/j.2517-6161.1951.tb00067.x. [DOI] [Google Scholar]
- 53.Saïed N., Aider M. Zeta potential and turbidimetry analyzes for the evaluation of chitosan/phytic acid complex formation. J. Food Res. 2014;3:71–81. doi: 10.5539/jfr.v3n2p71. [DOI] [Google Scholar]
- 54.Rioyo J., Aravinthan V., Bundschuh J., Lynch M. Research on ‘high-pH precipitation treatment’ for RO concentrate minimization and salt recovery in a municipal groundwater desalination facility. Desalination. 2018;439:168–178. doi: 10.1016/j.desal.2018.04.020. [DOI] [Google Scholar]
- 55.Cui X., Zhou D., Fan W., Huo M., Crittenden J.C., Yu Z., Ju P., Wang Y. The effectiveness of coagulation for water reclamation from a wastewater treatment plant that has a long hydraulic and sludge retention times: A case study. Chemosphere. 2016;157:224–231. doi: 10.1016/j.chemosphere.2016.05.009. [DOI] [PubMed] [Google Scholar]
- 56.Subramonian W., Wu T.Y., Chai S.-P. An application of response surface methodology for optimizing coagulation process of raw industrial effluent using Cassia obtusifolia seed gum together with alum. Ind. Crop. Prod. 2015;70:107–115. doi: 10.1016/j.indcrop.2015.02.026. [DOI] [Google Scholar]


