

Abstract
Purpose
To establish a mathematical model for assessing the true ovarian reserve based on the predicted probability of poor ovarian response (POR).
Methods
In this retrospective cohort study, a total of 1523 GnRH-antagonist cycles in 2017 were firstly analyzed. The ovarian responses were calculated based on the number of retrieved oocytes. The continuous variables were converted into categorical variables according to cutoff values generated by the decision tree method. The optimal model was identified using forward stepwise multiple logistic regression with 5-fold cross-validation and further verified its performances using outer validation data.
Results
The predictors in our model were anti-Müllerian hormone (AMH), antral follicle counts (AFC), basal follicle-stimulating hormone (FSH), and age, in order of their significance, named AAFA model. The AUC, sensitivity, specificity, positive predictive value, and negative predictive value of AAFA model in inner validation and outer validation data were 0.861 and 0.850, 0.603 and 0.519, 0.917 and 0.930, 0.655 and 0.570, and 0.899 and 0.915. Ovarian reserve of 16 subgroups was further ranked according to the predicted probability of POR and further divided into 4 groups of A–D using clustering analysis. The incidence of POR in the four groups was 0.038 (0.030–0.046), 0.139 (0.101–0.177), 0.362 (0.308–0.415), and 0.571 (0.525–0.616), respectively. The order of ovarian reserve from adequate to poor followed the order of A to D.
Conclusion
We have established an easy applicable AAFA model for assessing true ovarian reserve and may have important implications in both infertile women and general reproductive women in Chinese or Asian population.
Electronic supplementary material
The online version of this article (10.1007/s10815-020-01700-1) contains supplementary material, which is available to authorized users.
Keywords: Ovarian reserve, Poor ovarian response, AMH, AFC, FSH, Mathematical model
Introduction
Ovarian reserve refers to the amount of primordial follicles in the ovaries that have the ability to develop into mature oocytes [1–3]. The human ovary contains a fixed number of primordial follicles established before birth that declines with advancing age. The size of initial ovarian reserve is strongly influenced by genetics, leading to a large variation in the follicles numbers from 35,000 to 2.5 million [4], and variation in the age of menopause.
At present, it is not possible to evaluate primordial follicles by non-invasive methods. The commonly used clinical indicators for ovarian reserve include maternal age, basal follicle-stimulating hormone (FSH) levels, ratio of basal FSH/luteinizing hormone (LH), basal estradiol (E2) levels, anti-Müllerian hormone (AMH) levels, and antral follicle counts (AFC) [5, 6]. Maternal age provides the best indicator of ovarian reserve. Ovarian reserve and oocyte competence decline when age advances; however, its reliability is not satisfactory [7]. The AFC refers to the number of recruited ovarian follicles between 2 and 10 mm in diameter at the start of the menstrual cycle [8] and is closely related to the remaining pool of ovarian primordial follicles [8, 9]. Anti-Müllerian hormone is secreted by granulosa cells of preantral and small antral follicles [10], and serum AMH levels are correlated with AFCs and the number of retrieved oocytes in controlled ovarian stimulation. Thus, AMH has recently been implicated as a valuable serum marker for ovarian reserve [9, 11, 12]. Basal FSH is the most commonly used serum biomarker to evaluate ovarian reserve. As ovarian reserve decreases, the number of small follicles recruited in each menstrual cycle diminishes, producing less inhibin-B to inhibit FSH secretion, leading to higher levels of serum FSH [13, 14]. These common ovarian reserve tests are mainly used to assess the ovarian response during controlled ovarian stimulation (COS). However, there is no acknowledged mathematical model for assessing true ovarian reserve.
One aim of evaluating true ovarian reserve is to identify decreased ovarian reserve (DOR) in women going for IVF cycle, so that individualized ovarian stimulation can be adopted. However, to date, there is no consensus on the definition of a DOR [7]. For example, a DOR was defined as AMH < 0.5–1.1 ng/ml or AFC < 5–7 in The ESHRE Bologna criteria [15], and DOR was also defined as AMH < 1.2 ng/ml combined with AFC < 5 in the POSEIDON criteria [16], indicating the discrepancy in definition of a DOR.
Sometimes the goal of a predictive model is to simply rank new samples [17]. In this study, we have established an ovarian reserve predicting model, named AAFA model, using predictor of AMH, AFC, FSH, and age, in order to rank their ovarian reserve according to their predicted probability of poor ovarian response (POR), thus benefit for clinical consultation before ovarian stimulation started and also identifying the woman with a DOR.
Materials and methods
Database design
This retrospective observational cohort study was performed from January 2017 to December 2018. Our clinical supporting group entered data into a computerized database. The database collected both basic and clinical characteristics of patients, including surname, medical record number, serial number, age, BMI, duration of infertility, number of previous in vitro fertilization/intracytoplasmic sperm injection-embryo transfer (IVF/ICSI-ET) attempts, serum basal E2, FSH and LH levels, serum AMH level, left and right ovary AFCs, the primary, secondary, third, fourth, and fifth causes of infertility, traditional or mild ovarian stimulation cycles, type of ovarian stimulation/COS protocol, starting dose and total dose of recombinant (r) FSH, duration of rFSH treatment (days), name of rFSH, endometrial thickness on the human chorionic gonadotropin (hCG) trigger day, date of oocyte retrieval, and the number of oocytes retrieved.
The initial inclusion criteria of data were (1) female aged between 20 and 45 years old; (2) BMI ≤ 30; (3) previous attempted cycles ≤ 2; (4) all hormone levels were tested in our endocrinology lab. The exclusion criteria were (1) treated or untreated ovarian cysts; (2) previous ovarian surgery; (3) PCOS; (4) previous metabolic or endocrinological disease; (5) previous tuberculosis; (6) mild ovarian stimulation protocol; (7) women with chromosomal abnormality; (8) the women with former pregnancies within 3 months. The flowchart of the subject selection process is shown in Fig. 1.
Fig. 1.

Flowchart of the study population selection strategy. OC, oral contraceptive. PCOS, polycystic ovarian syndrome. TB, tuberculosis
Definition of different causes of infertility in our study
Male infertility was defined according to the WHO manual for the standardized investigation and diagnosis of the infertile couple [18]. Endometriosis was defined as the presence of endometrial glands and stroma outside the uterine cavity, with a combination of dysmenorrhea and dyspareunia. Tubal factor infertility was diagnosed by laparoscopic examination when fallopian tube infertility was indicated by salpingography. PCOS was defined according to the Rotterdam criteria [19]. Unexplained infertility was defined as couples whose standard examinations, such as tests of ovulation, tubal patency, and semen analysis, were normal, with a repeated failed pregnancy after sexual intercourse or intra-uterine insemination.
Antral follicle count measurement, sampling, and endocrine assays
The AFC for follicles 2–10 mm in diameter in both ovaries were measured on menstrual cycle day 2 through a transvaginal ultrasound scan. On the same day, intravenous blood was collected for FSH, LH, and E2 examinations. Blood was collected for AMH assay on any day of the menstrual cycle. Blood samples were collected and immediately inverted five times; serum was collected by centrifugation and used for endocrine assessment.
Serum FSH, LH, and E2 measurements were performed using a Siemens Immulite 2000 immunoassay system (Siemens Healthcare Diagnostics, Shanghai, P. R. China). The quality controls for FSH, LH, and E2 assays were supplied by Bio-RAD Laboratories (Lyphochek Immunoassay Plus Control, Trilevel, catalog number 370, lot number 40340). Serum AMH concentrations were measured using an ultrasensitive two-site ELISA (Ansh Labs, USA), using quality controls supplied with the kit. For the Trilevel controls, the coefficients of variation for the assays were less than 6% for AMH, FSH, and LH, and less than 10% for E2.
COS treatment
Recombinant human FSH (rFSH) (Gonal-F alfa [Merck Serono, Germany], Puregon beta [MSD, USA], Urofollitropin [Livzon Pharmaceutical Group Inc., China] or Menotrophins [Livzon Pharmaceutical Group Inc., China]) administration was initiated on menstrual cycle day 2. The starting dose was selected based on the age, BMI, AMH, basal FSH, and AFC. The rFSH dose was further adjusted according to size and number of growing follicles observed by ultrasound, and serum E2 level during the monitoring of stimulation. The GnRH-antagonist treatment was initiated when the growing follicles were reached 10–12 mm in diameter. 5000–10,000 IU hCG (Choriogonadotropin alfa, Merck Serono) was injected to trigger the final oocyte maturation, when at least two dominant follicles with more than 18 mm in diameter were observed by ultrasound. Oocyte retrieval was carried out at 36–38 h after hCG administration. One to two embryos were transplanted in the same cycle or embryos were cryopreservation for future use. Luteal phase progesterone support (Progesterone Vaginal Gel, Merck Serono) was provided.
Statistical analysis
In this study, the outcome variable was poor ovarian response, which was defined as less than 5 (0–4) oocytes retrieved, and predictor variables included age, BMI, main cause of infertility, AFC, basal level of FSH, basal level of AMH, basal LH level, basal E2 level, and endometrial thickness on hCG trigger day. The data from 2017 cycles were used to establish the prediction model and the data from 2018 cycles were used as outer validation data to validate the performance of the model.
Firstly, the univariate logistic regression was performed to identify the predicting indicators for further multiple regression analysis using the dataset of 2017. Secondly, a multivariate forward selection logistic regression with a 5-fold cross-validation was performed to construct a predictive model for poor ovarian response. In this procedure, the dataset was randomly split into 5 groups, and each unique group was used as a validation set and the remaining groups as a training set, then models were fitted on the training set and evaluated on validation set. The scaled negative log-likelihood (−Log L(β)) was used to select an optimal model, with smaller values indicating models with a better fit. For the selected predictive model, outer validation data of 2018 was further used to evaluate its applicability using measurements of the area under curve (AUC), sensitivity, specificity, positive predictive value (PPV), and negative predicative value (NPV). The main effect of each predicting variable measures the variation over the distribution of xj, in the mean of poor ovarian response.
For prediction of ovarian reserve, we ranked the subgroups according to the predicted probability of poor ovarian response, and further divided the 16 subgroups into 4 groups according to the predicted probability of poor ovarian response using the clustering analysis. The 95% confidence intervals (CI) for the predicted probability of poor ovarian response and actual rate of POR in each subgroup were also calculated. All the analysis was conducted using SAS JMP Pro (version 14.2), and p < 0.05 was considered statistically significant.
Results
Univariate regression analysis to identify predictors related to POR using 2017 data
In the model building data of 2017, a total of 1523 GnRH-antagonist cycles were enrolled in our retrospective study based on inclusion and exclusion criteria. The basic and clinical characteristics are shown in Table 1. Univariate analysis was performed to evaluate each variable’s effect on poor ovarian response. Predictors included in our analysis were age, BMI, main cause of infertility, AFC, serum basal FSH, LH and E2 levels, serum AMH level, and endometrial thickness on hCG trigger day. The results are shown in Table 2. Six predicting variables were significantly related to poor ovarian response, including age, BMI, AFC, serum AMH level, basal FSH level and main cause of infertility, with p values < 0.05. If the value of parameter estimation is positive, the probability of poor ovarian response increases with an increase in the predictor, and if the value of parameter estimation is negative, the probability of poor ovarian response increases with a decrease in the predictor. As shown in Table 2, the probability of poor ovarian response increased with increasing age and FSH. The probability of poor ovarian response increased with decreasing serum AMH, AFC, and BMI (In the earlier studies BMI was not correlated with DOR outcome). Furthermore, there was greater chance of having poor ovarian response with “unexplained infertility and others” compared with “tubal factor infertility.”
Table 1.
Clinical and biological data in women undergoing GnRH-antagonist treatment
| 2017 (n = 1523) | 2018 (n = 3273) | |
|---|---|---|
| Age (years) | 33.4 ± 5.3 | 32.7 ± 4.8 |
| BMI (kg/m2) | 22.3 ± 2.9 | 22.3 ± 2.9 |
| Main cause of infertility, n (%) | ||
| Male infertility | 537 (35.3%) | 1267 (38.7%) |
| Endometriosis | 33 (2.2%) | 142 (4.3%) |
| Tubal factor | 454 (29.8%) | 1095 (33.5%) |
| Mixed, unexplained and others | 499 (32.8%) | 769 (23.5%) |
| AFC | 9.9 ± 5.3 | 10.6 ± 5.6 |
| Basal FSH (IU/L) | 7.5 ± 3.3 | 7.2 ± 3.1 |
| Basal E2 (pmol/L) | 168 (134–210) | 160 (126–204) |
| Basal LH (IU/L) | 3.5 (2.4–4.9) | 3.7 (2.6–5.1) |
| AMH (ng/ml) | 2.2 (1.1–4.0) | 2.7(1.2–4.8) |
| Endometrial thickness on hCG day (mm) | 10.5 ± 1.6 | 10.6 ± 1.7 |
Key: BMI, body mass index; AMH, anti-Müllerian hormone; FSH, follicle-stimulating hormone; LH, luteinizing hormone; E2, estradiol; AFC, antral follicle count; hCG, human chorionic gonadotropin
Table 2.
Univariate analysis of the effect of each predicting variable on POR using 2017 data
| Parameter estimation | Standard error | Wald χ2 | p value | |
|---|---|---|---|---|
| Age (years) | 0.1439079 | 0.01 | 136.37 | < .0001* |
| Basal FSH (IU/L) | 0.2361389 | 0.02 | 131.86 | < .0001* |
| Basal E2 (pmol/L) | 0.0007719 | 0.00 | 1.49 | 0.222 |
| Basal LH (IU/L) | − 0.01977745 | 0.03 | 0.60 | 0.439 |
| Main cause of infertility (1 vs. 3) | 0.130408 | 0.15 | 0.73 | 0.393 |
| Main cause of infertility (2 vs. 3) | 0.610525 | 0.54 | 1.26 | 0.262 |
| Main cause of infertility (4 vs. 3) | 0.4554349 | 0.15 | 9.38 | 0.0022* |
| AMH (ng/ml) | − 0.94338219 | 0.07 | 201.37 | < .0001* |
| AFC | − 0.28547074 | 0.02 | 208.72 | < .0001* |
| BMI (kg/m2) | 0.05885299 | 0.02 | 8.78 | 0.0030* |
Key: 1, male infertility; 2, endometriosis; 3, tubal factor infertility; 4, unexplained infertility and others; BMI, body mass index; AMH, anti-Müllerian hormone; FSH, follicle-stimulating hormone; LH, luteinizing hormone; E2, estradiol; AFC, antral follicle count; hCG, human chorionic gonadotropin
Multivariable logistic regression with 5-fold cross-validation to build the predicting model for poor ovarian response using 2017 data
The new POSEIDON concept for the diagnosis and treatment of poor ovarian response aims to classify adequate or poor ovarian reserve according to cutoff values of AFC and AMH, in order to better individualize treatment [16]. This concept gave us an idea of transforming the continuous variables into categorical variables according to defined cutoff points. Therefore, we transformed the five continuous variables of AFC, age, AMH, BMI, and FSH into dichotomous variables. The data used here were data from 2017. The decision tree method was performed to identify ideal cutoff values that distinguished individuals with or without poor ovarian response. With one partition, the best split points for five continuous variables were as follows: age was divided into two groups of ≤ 35 years old (reference) and > 35 years old, basal FSH was divided into two groups of ≤ 8 IU/L (reference) and > 8 IU/L, AMH was divided into two groups of ≥ 1.2 ng/ml (reference) and < 1.2 ng/ml, AFC was divided into two groups of ≥8 (reference) and < 8, BMI was divided into two groups of ≤ 24 (reference) and > 24. The newly transformed dichotomous predictors together with the categorical variable for the main cause of infertility were then analyzed for multiple logistic regression.
The variable screening process is shown in Fig. 2a. The scaled log-like likelihood was the lowest when the 4th variable was included. The step order of the variable selection process was AMH, FSH, AFC, and age according to the significance of each indicator. The ROC of the inner training and inner validation sets, identified by 5-fold cross-validation, are shown in Fig. 2b. The AUC for the training set and validation set were 0.849 and 0.861, respectively. Furthermore, the main effect that each variable exert in this AAFA model were AMH 62.0%, followed by AFC 17.5%, FSH 12.4%, and age 8.1%; thus, we call this categorical model of AAFA model.
Fig. 2.

Continuous mode-1 and categorical model-2 to predict POR by multivariable logistic regression. a Forward regression with 5-fold cross-validation to identify the ideal model for predicting POR, using predicting variables as categorical variables. b The ROC curve of categorical model-2 in training set and validation set, respectively
Assess the performance of the AAFA model
To further evaluate the performance of this AAFA model, we calculate the AUC, sensitivity, specificity, PPV, and NPV in the inner training set, inner validation set, and outer validation dataset, which we further collected another 4168 GnRH-antagonist cycles (Fig. 1b and Table 1). The AUC in the inner training data, inner validation data, and outer validation data was 0.849 (0.829–0.869), 0.861 (0.822–0.9), and 0.850 (0.838–0.862), respectively. The sensitivity in the inner training data, inner validation data, and outer validation data was 0.540 (0.478–0.600), 0.603 (0.480–0.715), and 0.519 (0.475–0.563), respectively. The specificity, PPV, and NPV were also indicated in Table 3.
Table 3.
The performance of AAFA model
| AAFA model | |||
|---|---|---|---|
| Inner training set (95% CI) | Inner validation set (95% CI) | Outer validation set (95% CI) | |
| AUC | 0.849 (0.829–0.869) | 0.861 (0.822–0.9) | 0.850 (0.838–0.862) |
| Sensitivity | 0.540 (0.478–0.600) | 0.603 (0.480–0.715) | 0.519 (0.475–0.563) |
| Specificity | 0.914 (0.895–0.930) | 0.917 (0.876–0.946) | 0.930 (0.920–0.939) |
| PPV | 0.621 (0.555–0.683) | 0.655 (0.527–0.764) | 0.570 (0.525–0.615) |
| NPV | 0.884 (0.863–0.902) | 0.899 (0.855–0.931) | 0.915 (0.904–0.925) |
AAFA model, logistic regression using predictors as categorical variables; AMH model, logistic regression using AMH as continuous variable; AUC, area under ROC curve; PPV, positive predictive value; NPV, negative predictive value; CI is short for confidential interval
Ranking the ovarian reserve based on the predicted probability of poor ovarian response
Given that DOR is closely related to poor ovarian response, and the number of oocytes retrieved was closely related to the number of primordial follicles in the ovarian cortex [9, 18, 19], we further assessed ovarian reserve according to the predicted probability of poor ovarian response. The hormone levels measured in the GnRH-antagonist protocol reflect the basal levels of reproductive-age women. For women undergoing GnRH-antagonist ovarian stimulation, we could therefore predict their ovarian reserve using the predicted probability of poor ovarian response.
The predicted ovarian reserve was ranked according to the predicted probability of poor ovarian response calculated by AAFA model. The 16 groups were further divided into 4 groups according using the clustering analysis according to the predicted probability of poor ovarian response, indicated in Fig. 3. The length of the line in the figure reflects the distance between each other. The actual incidence of poor ovarian response in the 4 groups were shown in Table 4. The order of ovarian reserve from adequate to poor followed the order of predicted probability of poor ovarian response from low to high. For convenience, age and FSH less than the cutoff points were classified favorable (green), otherwise unfavorable (red); AMH and AFC higher than the cutoff points were classified favorable (green), otherwise unfavorable (red).
Fig. 3.
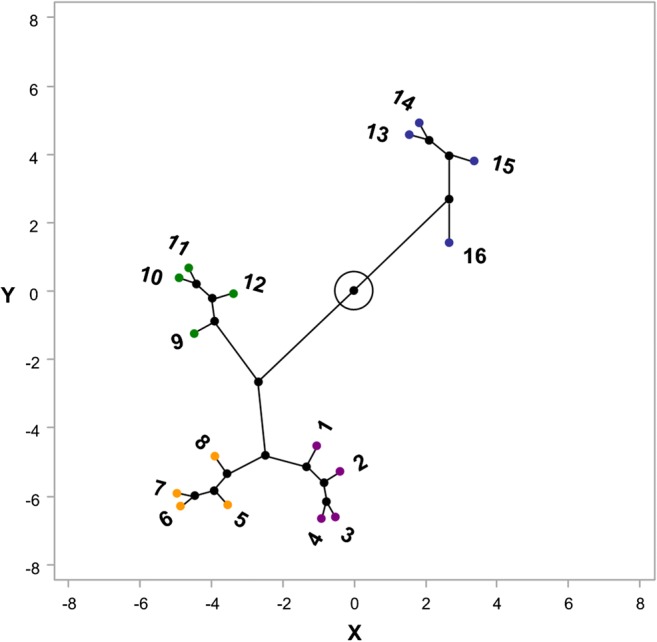
Clustering analysis to discover the best way on how to divide the 16 subgroups into 4 groups
Table 4.
Ranking the ovarian reserve based on predicted probability and actual probability of poor ovarian response in outer validation data

Prob. is short for probability; Num. is short for number; OR is short for ovarian reserve; CI is short for confidential interval
The women with predicted probability of more than 50% were classified into the DOR population, which include the subgroup of 13–16. Subgroup 16 had all four unfavorable predictors. Subgroups 13–15 each had three unfavorable predictors and one favorable predictor of either AFC, age, or FSH. The actual incidence of poor ovarian response in subgroup 13–16 was over 50% either. The predicted probability and actual incidence of poor ovarian response in each subgroup were shown in Table 4. The clinical pregnancy rates and live birth rates in A–D groups were also indicated in Table 5.
Table 5.
The clinical pregnancy rate and live births rate in the four ovarian reserve groups
| Ovarian reserve group | CP per starting cycles (95% CIs) | CP per ET cycles (95% CIs) | LB per starting cycles (95% CIs) | LB per ET cycles (95% CIs) |
|---|---|---|---|---|
| A | 0.212 (0.195–0.229) | 0.439 (0.409–0.469) | 0.174 (0.158–0.190) | 0.360 (0.331–0.388) |
| B | 0.210 (0.166–0.254) | 0.370 (0.300–0.439) | 0.167 (0.126–0.207) | 0.294 (0.228–0.359) |
| C | 0.140 (0.101–0.179) | 0.402 (0.309–0.495) | 0.124 (0.087–0.161) | 0.355(0.265–0.446) |
| D | 0.126 (0.095–0.156) | 0.268 (0.208–0.327) | 0.077 (0.053–0.102) | 0.164 (0.114–0.213) |
Key: CP, clinical pregnancy; LB, live birth; ET, embryo transfer
Discussion
The aim of an ovarian reserve test is to identify those who are at risk of having a DOR. However, there is no consensus on the definition of DOR [15], and no acknowledged mathematical model for assessing ovarian reserve either. Here, for the first time, we propose an AAFA model to predict ovarian reserve using AMH, AFC, FSH, and age as categorical variables to predict poor ovarian response. We classified the women predicted to be poor ovarian responders (with predicted probability of more than 50%) in IVF cycles as the DOR population, including favorable AFC but unfavorable age, AMH, and FSH (subgroup 13); and favorable FSH but unfavorable AFC, age, and AMH (subgroup 14); and favorable age but unfavorable AFC, AMH, and FSH (subgroup 15); as well as unfavorable AFC, age, AMH, and AFC (subgroup 16).
Nowadays, multiple regression models were used to predict a poor ovarian response [6, 18, 20–26]. The main differences between our results and the previous findings are the following: First, previous studies were focused on determining whether each predictor was meaningful by multivariate analysis in order to find the most important predictors and their cutoff points for discriminate poor responder from others. But, our study further ranks the predicted ovarian reserve of the subjects according to the calculated predicted probability of poor ovarian response. Secondly, in our study, only the GnRH-antagonist protocol was included. In previous studies, GnRH agonist protocol was frequently used. Under the hypothalamic inhibition status, the predictor was not the subject’s basic hormone level or the basic level of AFCs, so the predicting model could not be extended to the general population. Third, previous studies have included each ovarian reserve marker as a continuous variable, but there is a strong correlation between each other. This may be the reason why combination of ovarian reserve markers is not superior to a single ovarian reserve index [6, 26]. Nowadays, different ovarian reserve markers are still used in most of the reproductive centers, indicating that multiple indicators are not completely replaced by a single indicator. Considering the correlation between the ovarian reserve indicators, we have transformed the continuous variables of different ovarian reserve markers into categorical variables in order to avoid collinearity of the independent variables.
There have been models for predicting low or poor ovarian response. A AMH cutoff value of 1.5 ng/mL has been used to predict ≤ 6 mature oocytes during ovarian stimulation, with sensitivity of 0.86 and specificity of 0.78 [27]. A AMH cutoff of 1.0 ng/mL was reported to have 87% sensitivity and 67% specificity in predicting poor ovarian response [28]. We also previously reported a AMH cutoff of 1.2 ng/mL for predicting poor ovarian response, with sensitivity of 70.7% and specificity of 72.0% [18]. The specificity of our AAFA model was 93% in outer validation data, significantly higher than the previous studies, indicating that combination of different categorical predictor significantly increase the proportion of (predicted and also turned out to be actual non-poor-responders)/(all the actual non-poor-responders). Furthermore, the actual incidences of poor ovarian response, clinical pregnancy, and live birth we showed in Table 4 and Table 5 are helpful for clinical consultation and also for choosing the proper dose of recombinant FSH prior to ovarian stimulation.
Since the number of primordial follicles is not measurable non-invasively, what can be used as an outcome variable for evaluation of ovarian reserve is a tough decision. A suitable outcome variable must be closely related to the number of primordial follicles. We have initially considered the duration of infertility or pregnancy outcome as outcome variables. However, ovarian reserve is not the only factor affecting the duration of infertility or outcome of pregnancy; other factors, such as male infertility, and fallopian tube factor-, uterine cavity-, or endometriosis-induced infertility, may all affect the duration of infertility and pregnancy outcomes. Since the number of follicles in the ovarian cortex is closely related to the number of oocytes retrieved during COS, we attempted to assess an individual’s ovarian reserve by establishing a mathematic model for predicting poor ovarian response.
Selection of a suitable population that represents the normal distribution of most reproductive-aged women was a key consideration. The included population is only subjects undergoing GnRH-antagonist ovarian stimulation. The most important reason for choosing GnRH-antagonist protocol is that the hormone levels in this population is actually women’s’ basic hormone levels, therefore, our model would be applied to general assessment for ovarian reserve for any women in the future.
Although the AUC confirmed the statistical stability of our AAFA model, bias from different clinical centers using different immunoassay platforms or different populations from different areas or ethnic groups may still compromise the cutoff points of AFC, age, AMH, and FSH, potentially reducing the predictive accuracy of this model in different reproductive centers. Therefore, different reproductive centers should use their own data to calibrate the cutoff points of AFC, age, AMH, and FSH in predicting poor ovarian response, in order to increase the reliability of this AAFA model.
To avoid selection bias, we set relatively broad limitations on age and body mass index (BMI) for inclusion criteria. Moreover, we exclude individuals whose ovarian reserve were potentially not correlated to the number of oocytes retrieved during COS, including those exhibiting PCOS or other untreated metabolic or endocrine abnormalities, patients with ovarian cysts or previous ovarian surgery, or receiving preimplantation genetic diagnosis/screening (PGD/PGS). Factors affecting hormone levels, such as previous pregnancy or oral contraceptives, were also excluded. The above inclusion and exclusion criterion was used to obtain satisfactory homogeneity of the population and more practical clinical application. Furthermore, since the main cause of infertility was not of significance in the 2017 data, we did not rule out PCOS patients in the 2018 data, and the model effect was still satisfactory, suggesting the good efficacy of our model in outer validation data.
Considering possible limitations of our study, we believe that the best representation is to include the population represents the majority of reproductive-aged women. We initially thought to include the normal community-based population, but without ovarian stimulation in this study, we were not able to find an outcome variable that was closely related to ovarian reserve. Secondly, the aim of our study was to rank the ovarian reserve; thus, we believe that selection bias from different population was acceptable. Thirdly, the GnRH-antagonist protocol is the most widely used protocol in our reproductive center (one of the largest centers in China), accounting for more than 50% of all COSs; thus, there is no strict limit on the selection of patients undergoing GnRH-antagonist protocol, avoiding selection bias. Therefore, it is likely that our result is more aligned to the normal population with normal ovarian responses in their corresponding reproductive ages. Fourthly, our patients are all Asian cohort, no other races were included in our study. We believe that after adjusting the platform variation in AMH and FSH level, our model should be applicable for other Asian population. However, for people from different races, the cutoff values of the four predictors could be adjusted using their own data. We believe that our AAFA model should be of clinical significance in assessing their ovarian reserve either, while this requires further verification using data from other races. Fifthly, our AAFA model is design to predict poor ovarian response. Discriminating high ovarian reserve from normal ovarian reserve is not our purpose of this study, which is the drawback of our AAFA model.
Conclusion
We established an easy applicable mathematical model for ranking ovarian reserve according to the predicted probability of poor ovarian response. It will be of great importance for pre-assessment of individualized ovarian stimulation and for Chinese or even Asian women who intended to evaluate their own ovarian reserve in order to arrange their childbirth plans according to their ovarian reserve status. Larger samples are needed to verify the accuracy of the model between different reproductive centers and different examination platforms.
Electronic supplementary material
(RTF 8194 kb)
(RTF 8312 kb)
(RTF 8214 kb)
(XLSX 137 kb)
Author contributions
Huiyu Xu: data collection and manuscript writing. Guoshang Feng: statistical analysis and manuscript writing. Haiyan Wang: data collection and manuscript writing. Yong Han: editing of this manuscript. Rui Yang: data collection and clinical consultation. Ying song: data collection and clinical consultation. Lixue Chen: data collection. Li Shi: data collection. Mengqian Zhang: data collection. Rong Li: resources, study design, supervision, and finally manuscript approval. Jie Qiao: resources, study design
Funding
This study was supported by the National Key Research and Development Program of China (Grant No. 2018YFC1002100, 2016YFC1000302, 2016YFC1000201); the capital health research and development of special project (Grant No. 2018-1-4091); National Natural Science Foundation of China (Grant No. 81771650); and Major National R&D Projects of China (Grant No. 2017ZX09304012-012).
Compliance with ethical standards
The dataset used in this study contains de-identified data; thus, the informed consent by the patients was waived and the institutional review board approval was exempted, which conform to the Helsinki declaration.
Conflict of interest
The authors declare that they have no conflict of interest.
Footnotes
Publisher’s note
Springer Nature remains neutral with regard to jurisdictional claims in published maps and institutional affiliations.
Huiyu Xu, Guoshuang Feng and Haiyan Wang contributed equally to this work.
References
- 1.Qiao J, Wang ZB, Feng HL, Miao YL, Wang Q, Yu Y, Wei YC, Yan J, Wang WH, Shen W, et al. The root of reduced fertility in aged women and possible therapentic options: current status and future perspects. Mol Asp Med. 2014;38:54–85. doi: 10.1016/j.mam.2013.06.001. [DOI] [PubMed] [Google Scholar]
- 2.Lass A. Assessment of ovarian reserve: is there still a role for ovarian biopsy in the light of new data? Hum Reprod. 2004;19:467–469. doi: 10.1093/humrep/deh118. [DOI] [PubMed] [Google Scholar]
- 3.Broekmans FJ, Kwee J, Hendriks DJ, Mol BW, Lambalk CB. A systematic review of tests predicting ovarian reserve and IVF outcome. Hum Reprod Update. 2006;12:685–718. doi: 10.1093/humupd/dml034. [DOI] [PubMed] [Google Scholar]
- 4.Wallace WH, Kelsey TW. Human ovarian reserve from conception to the menopause. PLoS One. 2010;5:e8772. doi: 10.1371/journal.pone.0008772. [DOI] [PMC free article] [PubMed] [Google Scholar]
- 5.Roudebush WE, Kivens WJ, Mattke JM. Biomarkers of ovarian reserve. Biomark Insights. 2008;3:259–268. doi: 10.4137/BMI.S537. [DOI] [PMC free article] [PubMed] [Google Scholar]
- 6.Gynecologists TACoOa Committee opinion no. 618: ovarian reserve testing. Obstet Gynecol. 2015;125:268–273. doi: 10.1097/01.AOG.0000459864.68372.ec. [DOI] [PubMed] [Google Scholar]
- 7.Medicine PCotASfR Testing and interpreting measures of ovarian reserve: a committee opinion. Fertil Steril. 2015;103:e9–e17. doi: 10.1016/j.fertnstert.2014.12.093. [DOI] [PubMed] [Google Scholar]
- 8.de Carvalho BR, Rosa e Silva AC, Rosa e Silva JC, dos Reis RM, Ferriani RA, Silva de Sa MF. Ovarian reserve evaluation: state of the art. J Assist Reprod Genet. 2008;25:311–322. doi: 10.1007/s10815-008-9241-2. [DOI] [PMC free article] [PubMed] [Google Scholar]
- 9.Broer SL, van Disseldorp J, Broeze KA, Dolleman M, Opmeer BC, Bossuyt P, Eijkemans MJ, Mol BW, Broekmans FJ. Added value of ovarian reserve testing on patient characteristics in the prediction of ovarian response and ongoing pregnancy: an individual patient data approach. Hum Reprod Update. 2013;19:26–36. doi: 10.1093/humupd/dms041. [DOI] [PubMed] [Google Scholar]
- 10.Durlinger AL, Gruijters MJ, Kramer P, Karels B, Ingraham HA, Nachtigal MW, Uilenbroek JT, Grootegoed JA, Themmen AP. Anti-Mullerian hormone inhibits initiation of primordial follicle growth in the mouse ovary. Endocrinology. 2002;143:1076–1084. doi: 10.1210/endo.143.3.8691. [DOI] [PubMed] [Google Scholar]
- 11.Eldar-Geva T, Ben-Chetrit A, Spitz IM, Rabinowitz R, Markowitz E, Mimoni T, Gal M, Zylber-Haran E, Margalioth EJ. Dynamic assays of inhibin B, anti-Mullerian hormone and estradiol following FSH stimulation and ovarian ultrasonography as predictors of IVF outcome. Hum Reprod. 2005;20:3178–3183. doi: 10.1093/humrep/dei203. [DOI] [PubMed] [Google Scholar]
- 12.van Rooij IA, Broekmans FJ, Scheffer GJ, Looman CW, Habbema JD, de Jong FH, Fauser BJ, Themmen AP, te Velde ER. Serum antimullerian hormone levels best reflect the reproductive decline with age in normal women with proven fertility: a longitudinal study. Fertil Steril. 2005;83:979–987. doi: 10.1016/j.fertnstert.2004.11.029. [DOI] [PubMed] [Google Scholar]
- 13.Yding Andersen C. Inhibin-B secretion and FSH isoform distribution may play an integral part of follicular selection in the natural menstrual cycle. Mol Hum Reprod. 2017;23:16–24. doi: 10.1093/molehr/gaw070. [DOI] [PubMed] [Google Scholar]
- 14.Santoro N. The menopausal transition. Am J Med. 2005;118(Suppl 12B):8–13. doi: 10.1016/j.amjmed.2005.09.008. [DOI] [PubMed] [Google Scholar]
- 15.Ferraretti AP, La Marca A, Fauser BC, Tarlatzis B, Nargund G, Gianaroli L. ESHRE consensus on the definition of 'poor response' to ovarian stimulation for in vitro fertilization: the Bologna criteria. Hum Reprod. 2011;26:1616–1624. doi: 10.1093/humrep/der092. [DOI] [PubMed] [Google Scholar]
- 16.Alviggi C, Andersen CY, Buehler K, Conforti A, De Placido G, Esteves SC, Fischer R, Galliano D, Polyzos NP, Sunkara SK, et al. A new more detailed stratification of low responders to ovarian stimulation: from a poor ovarian response to a low prognosis concept. Fertil Steril. 2016;105:1452–1453. doi: 10.1016/j.fertnstert.2016.02.005. [DOI] [PubMed] [Google Scholar]
- 17.Johnson MKK. Applied predictive modeling, measuring performance in regresssion model. Berlin: Springer; 2013. [Google Scholar]
- 18.Xu H, Zeng L, Yang R, Feng Y, Li R, Qiao J. Retrospective cohort study: AMH is the best ovarian reserve markers in predicting ovarian response but has unfavorable value in predicting clinical pregnancy in GnRH antagonist protocol. Arch Gynecol Obstet. 2017;295:763–770. doi: 10.1007/s00404-016-4274-8. [DOI] [PubMed] [Google Scholar]
- 19.Qiao J, Wang ZB, Feng HL, Miao YL, Wang Q, Yu Y, Wei YC, Yan J, Wang WH, Shen W, et al. The root of reduced fertility in aged women and possible therapentic options: current status and future perspects. Mol Asp Med. 2013;38:54–85. doi: 10.1016/j.mam.2013.06.001. [DOI] [PubMed] [Google Scholar]
- 20.Heidar Z, Bakhtiyari M, Mirzamoradi M, Zadehmodarres S, Sarfjoo FS, Mansournia MA. Prediction of different ovarian responses using anti-Mullerian hormone following a long agonist treatment protocol for IVF. J Endocrinol Investig. 2015;38:1007–1015. doi: 10.1007/s40618-015-0297-4. [DOI] [PubMed] [Google Scholar]
- 21.La Marca A, Sunkara SK. Individualization of controlled ovarian stimulation in IVF using ovarian reserve markers: from theory to practice. Hum Reprod Update. 2014;20:124–140. doi: 10.1093/humupd/dmt037. [DOI] [PubMed] [Google Scholar]
- 22.Jayaprakasan K, Campbell B, Hopkisson J, Johnson I, Raine-Fenning N. A prospective, comparative analysis of anti-Mullerian hormone, inhibin-B, and three-dimensional ultrasound determinants of ovarian reserve in the prediction of poor response to controlled ovarian stimulation. Fertil Steril. 2010;93:855–864. doi: 10.1016/j.fertnstert.2008.10.042. [DOI] [PubMed] [Google Scholar]
- 23.Muttukrishna S, Suharjono H, McGarrigle H, Sathanandan M. Inhibin B and anti-Mullerian hormone: markers of ovarian response in IVF/ICSI patients? Bjog-an Int J Obstetrics Gynaecol. 2004;111:1248–1253. doi: 10.1111/j.1471-0528.2004.00452.x. [DOI] [PubMed] [Google Scholar]
- 24.Kotanidis L, Nikolettos K, Petousis S, Asimakopoulos B, Chatzimitrou E, Kolios G, Nikolettos N. The use of serum anti-Mullerian hormone (AMH) levels and antral follicle count (AFC) to predict the number of oocytes collected and availability of embryos for cryopreservation in IVF. J Endocrinol Investig. 2016;39:1459–1464. doi: 10.1007/s40618-016-0521-x. [DOI] [PubMed] [Google Scholar]
- 25.La Marca A, Argento C, Sighinolfi G, Grisendi V, Carbone M, D'Ippolito G, Artenisio AC, Stabile G, Volpe A. Possibilities and limits of ovarian reserve testing in ART. Curr Pharm Biotechnol. 2012;13:398–408. doi: 10.2174/138920112799361972. [DOI] [PubMed] [Google Scholar]
- 26.Medicine TPCotASfR Testing and interpreting measures of ovarian reserve: a committee opinion. Fertil Steril. 2012;98:1407–1415. doi: 10.1016/j.fertnstert.2012.09.036. [DOI] [PubMed] [Google Scholar]
- 27.Riggs R, Kimble T, Oehninger S, Bocca S, Zhao Y, Leader B, Stadtmauer L. Anti-Mullerian hormone serum levels predict response to controlled ovarian hyperstimulation but not embryo quality or pregnancy outcome in oocyte donation. Fertil Steril. 2011;95:410–412. doi: 10.1016/j.fertnstert.2010.07.1042. [DOI] [PubMed] [Google Scholar]
- 28.Nardo LG, Gelbaya TA, Wilkinson H, Roberts SA, Yates A, Pemberton P, Laing I. Circulating basal anti-Mullerian hormone levels as predictor of ovarian response in women undergoing ovarian stimulation for in vitro fertilization. Fertil Steril. 2009;92:1586–1593. doi: 10.1016/j.fertnstert.2008.08.127. [DOI] [PubMed] [Google Scholar]
Associated Data
This section collects any data citations, data availability statements, or supplementary materials included in this article.
Supplementary Materials
(RTF 8194 kb)
(RTF 8312 kb)
(RTF 8214 kb)
(XLSX 137 kb)