

Abstract
Despite numerous biosensors currently available, the routine biomarker detection still largely relies on traditional ELISA and western blot. Those standard techniques are labor intensive and time consuming. Herein we introduce a fast affinity induced reaction sensor (FARIS) that overcomes a few limitations of traditional and emerging biosensors. FAIRS is a general, one-step method and is naturally specific in detection. FAIRS probes are composed of sandwich ELISA antibody pair that is conjugated with two fluorogenic click chemicals. This technology leverages significant differences of antibody affinity and chemical reaction rate, which are characterized to guide probe design. The stability, sensitivity, detection range and response time are fully characterized. Application to IL-6 detection using blood serum and cell culture medium demonostrates that FAIRS can quantify IL-6 with high sensitivity in one step. With the unique features, FAIRS probes may find broad applications in medical sciences and clinical diagnostics where quick detection of biomarkers is demanded.
INTRODUCTION
Simple, high-performance sensing technologies for the detection of protein biomarkers are critical for disease diagnosis. Conventional protein detection techniques largely rely on antibody-based, multi-step enzyme-linked immunosorbent assay (ELISA) and western blotting, which are usually time and labor consuming. In recent years, many emerging biosensors are introduced that feature the combination of high sensitivity and specificity, one step without washing, low-end instrument or device free, and fast response. Among them nanotechnology-based biosensors power the field to a new level. Surface plasmon resonance (SPR) in gold films with localized SPR and microring resonators has been developed to sense cytokine in real time.1–3 Plasmonic nanohole array further achieves label-free detection of biomarkers with large field of view for high-throughput assays.4–6 Nanoparticles and graphene have also been demonstrated for one-step detection of proteins when coupled with various mechanisms of surface enhanced Raman scattering, chemiluminescence, light scattering, and Förster resonance energy transfer (FRET).7–11 Many of those sensors need assistance of special instruments that a typical biomedical laboratory does not have, or they are only applicable in limited circumstances. A more general biosensor possessing multiple merits is highly demanded to fit the needs of clinical diagnosis, drug discovery, and biomarker screening.
Proximity response has been exploited to detect biomolecules simply in one step. For example, when DNAs are brought closely in space, thermodynamics of DNA hybridization can trigger binding or separation of DNA strands selectively. This property has been widely used to design DNA devices for molecular diagnostics, sensing and imaging applications.12–16 However, the sensor design generally involves a few DNAs and thus the unprocessed biological samples may interfere the assay accuracy. FRET occurs when fluorophores or quantum dots are in proximity due to affinity between biomolecules.17–19 But, the FRET based sensors usually have limited signal-to-noise ratio. The commercially available Alpha bead-based proximity immunoassay overcomes that limitation. It requires a special signal reading instrument that is not available in most research institutions.20 There are other proximity triggered biochemical reactions that have been applied in DNA detection. Split fluorescent proteins become fluoresce after re-assembly from two nonfluorescent fragments driven by additional DNA hybridization. The restoration of fluorescence takes only a few minutes when the tagged DNAs find their complementary parts.21,22 The similar idea for DNA detection is proximity fluorogenic click reaction.23,24 Click chemistry is fast, simple to use, stable in aqueous solution, and orthogonal to biochemical processes.25 It has shown remarkable value in molecular imaging, medicinal chemistry, drug development and discovery, and chemical biology.26–28 Fluorophore can be inactivated by click chemicals on the same molecule, and the fluorescence is restored after click reaction.24,29 Therefore, no washing step is required for sensing biomolecules.
Here we introduce a wash-free, fast-response biosensor that takes advantage of differential kinetics of antibody-antigen affinity and click reaction. Tetrazine (TZ)-BODIPY is covalently linked with capture antibody via long chain polyethylene glycol (PEG), and azabenzonorbornadiene (AN) is conjugated with detection antibody via the same PEG linker. This fast affinity induced reaction sensor (FAIRS) respond rapidly with t1/2=6.5 min, once IL-6 as antigen is present in a solution. Without IL-6 recombinant protein, the FAIRS probes can be stable for > 24 h without significant change of background or signal. Sensitivity and response time have been thoroughly studied. We have investigated the kinetics of the sensor and conclude the general design rule for proximity sensing. The FAIRS probes have been applied to detect IL-6 in human blood serum as well as in supernatants of stimulated microglial cells. Through quantification, we found the IL-6 concentrations detected by FAIRS probes are consistent with those by spiking and conventional ELISA. The combination of fast response, simple detection, high sensitivity and specificity, and high stability makes FAIRS superior to many proximity sensors, and thus FAIRS probes and the similar kind may find wide application in various fields when protein detection is concerned.
EXPERIMENTAL SECTION
Chemicals and reagents
tert-butyl 11-azatricyclo [6.2.1.02,7] undeca-2,4,6,9-tetraene-11-carboxylate (ChemScene), BODIPY-TZ-NHS ester (MW 613.24; WuXi AppTec), Biotin-PEG-SVA (MW 3400; Laysan Bio), NH2-PEG-COOH (MW 3400; Laysan Bio), Streptavidin (ProSpec), biotin (Sigma-Aldrich), 1-ethyl-3-(3-dimethylaminopropyl) carbodiimide (EDC; Pierce), N-hydroxysulfosuccinimide (Sulfo-NHS; Thermo Fisher Scientific), aliphatic amine latex beads (2% w/v, 0.4 μm; Thermo Fisher Scientific), Phosphate Buffered Saline Tablets (PBS; MP Biomedicals), 0.2M carbonate buffers (Alfa Aesar), ELISA MAX Standard Set Human IL-6 (BioLegend), TMB reagents (BioLegend), Amicon 100K cellulose centrifugal filter Unit (Thermo Fisher Scientific), Zeba 7K MWCO Spin Desalting Columns (Thermo Fisher Scientific), HyClone Iscove’s Modified Dulbecco’s Medium (IMDM; GE Healthcare Bio-Sciences), Fetal Bovine Serum (FBS; GE Healthcare Bio-Sciences), trifluoroacetic acid (Sigma-Aldrich), Off-clot human Serum (ZenBio), and Dulbecco’s Modified Eagle Medium/Ham’s F-12 (DMEM/F12; GE Healthcare Bio-Sciences), 1% penicillin/streptomycin (Thermo Fisher Scientific), LPS (E. coli K12, 1 μg/mL; Invitrogen).
Cell culture and stimulation
Human C20 microglial cell line is a gift from David Alvarez-Carbonell at Case Western Reserve University. C20 cells were cultured in DMEM/F-12 medium supplemented with 10% FBS at 37 °C in humidified 5% CO2 incubator. Before collection of supernatants, the cells were plated at a density of 2 × 10⁵ cells/well on a 96-well plate. They were either stimulated by 1 μg/ml LPS for 24 h or kept in medium without stimulation as control. Culture medium from wells were collected and centrifuged at 3,000 rpm for 10 min to remove debris. The supernatants were obtained for measurement of IL-6 concentration by various approaches.
Preparation of AN-PEG3400-detection antibody
Tert-butyl 11-azatricyclo [6.2.1.02,7] undeca-2,4,6,9-tetraene-11-carboxylate (200mg) was deprotected first in Trifluoroacetic acid (TFA; 2ml) to generate 7- azabenzonorbornadiene (AN). The reaction mixture was stirred for 1 h at RT, and then the solvent was evaporated in vacuum. The crude product was purified by crystallization with ethyl acetate. To prepare AN-PEG3400-Biotin, the purified AN (50 mM in anhydrous DMF, 100 μL) was reacted directly with NHS-PEG3400-Biotin (10 mM in anhydrous DMF, 100 μL) for 1 h at room temperature, catalyzed by triethylamine (0.25 μL). The product was filtered with 7K Zeba spin column to remove excess AN.
200 μL of biotinylated detection antibody at 0.5 mg/mL was conjugated with 1 mg/mL streptavidin at the molar ratio of 1:1 for 0.5 h. The excess streptavidin was removed by 100K centrifugal filter (Amicon). Then 5 μL of AN-PEG3400-Biotin at 1 mM was added to streptavidin-detection antibody conjugate, and the mixture was incubated for 1 h at room temperature. The excess AN-PEG3400-Biotin was removed by 2 μm microbeads coated with streptavidin. The AN conjugated detection antibody was further purified and concentrated by 100K centrifugal filter. To validate the final product, TZ (17.7μM, 100 μL in DMSO) were added in the final product (1mg/mL, 5 μL) and 100 μL PBS on 96-wells plates. The enhancement of fluorescence was used to determine whether the final conjugate was correctly produced. Fluorescence intensity was read by a microplate reader (Synergy H1 Hybrid Multi-Mode; BioTek) with excitation at 488 nm and emission at 525 nm.
Preparation of TZ-PEG3400-capture antibody
Synthesis of fluorogenic BODIPY-TZ-NHS ester is assisted by WuXi AppTec (Figure S2 and S3). 300 μL of this chemical at 16.3 mM in anhydrous DMSO was mixed with 0.6 mg NH2-PEG3400-COOH at molar ratio of 25 to 1, and the mixture was stirred for 1 h at room temperature. The product was purified by 10k cellulose filter and washed 3 times with MES (pH=6) buffer. The solution was centrifuged at 10,000 rpm for three times to remove excess insoluble Tz-NHS ester, and adjust the concentration of TZ-PEG3400-COOH to 0.1 mM.
2 mg EDC and 5 mg sulfo-NHS in MES buffer (1 mL, pH=6) were mixed and incubated for 15 min, before taking 100 μL of the mixture into 50 μL TZ-PEG3400-COOH at 0.1 mM. After 1 h incubation, 1.2μL 2-mercaptoethanol was added to quench the unreacted EDC. The solution was desalted by 7K zeba desalting column to remove small chemicals including byproducts and collect TZ-PEG3400-NHS.
IL-6 capture antibody was concentrated to 1 mg/mL in 20 mM carbonate buffer, measured by UV-Vis Spectrophotometer (Nanodrop ND-1000; Thermo Fisher Scientific). 100 μL IL-6 antibody was mixed with 100 μL freshly made TZ-PEG3400-NHS for 1 h, before purification by Fast protein liquid chromatography (FPLC; BioRad) equipped with Superdex 200 10/300 GL column (GE Healthcare). The collected conjugate was further concentrated by 10K centrifugal filter, and the concentration was measured by UV-Vis Spectrophotometer. To validate the final product, 100 μL of AN at 10 μM in PBS was added to 5 μL of the conjugate. The fluorescence was monitored in real time, and >20 times increase of signal passed the validation.
Calculation of reaction rate
AN-PEG3400-detection antibody and TZ-PEG3400-capture antibody were mixed directly with IL-6 recombinant protein in PBS for determination of the reaction constant. The measurements were performed under pseudo 1st order condition, using fixed amount of IL-6 protein (8,000 pg/mL) and an excess of antibody conjugates at 0.5, 0.1, 0.05 and 0.01 mg/mL. Once the mixtures were loaded to wells of a 96 well plate, fluorescence signals were collected intermittently at select time points (0, 10, 20, 30, 40 50, and 60 min). Fluorescence intensity vs. time was fitted to a 1st order exponential equation , where the pseudo 1st order rate constant (kobs) equals 1/t. The obtained kobs values were then plotted against antibody conjugate concentrations. The slope of fitted straight line corresponds to the 2nd order rate constant (k2). Each measurement was repeated in triplicate.
One-step cytokine detection
AN-PEG3400-detection antibody and TZ-PEG3400-capture antibody as FAIRS probes at final concentration of 0.05 mg/mL were mixed with human serum or cell supernatants in a 96 well plate. The fluorescence intensities were recorded in real time using a microplate reader. The fluorescence intensity of wells without sample or standard were used as blank. Off-clot human blood serum from healthy donors was purchased from ZenBio. Before measurement of IL-6 in human sample, standard IL-6 recombinant protein (Biolegend) was spiked into serum with final concentration at 100 μg/mL. The serum was further diluted 2 times and 3 times for FAIRS detection and conventional ELISA assay.
For conventional ELISA assay, capture antibody at 10 μg/mL in PBS was incubated in a 96 well plate overnight at 4 °C. After three washes with 3% BSA in PBS, various concentrations of IL-6 recombinant proteins were added to wells and incubated for 2 h. The unbound proteins were washed three times, and detection antibody with 100 times dilution was added to each well and incubated for 1 h. The wells were washed for another three times, followed by incubation with diluted streptavidin-HRP conjugate with 500 times dilution for 30 min. TMB reagents were transferred to wells to develop colors for reading of optical density with a microplate reader.
Statistical analysis
Fluorescence intensity data were analyzed using GraphPad Prism-6 (GraphPad Software). The same program was used to fit curves and find rate constants. Data points on plots were expressed as mean ± S.D., with each repeated for at least three times experimentally. Significant differences between groups were determined using a one-way analysis of variance (ANOVA) with Dunnet’s multiple comparisons test, considering P < 0.05 as significant differences.
RESULTS AND DISCUSSION
2nd order kinetics of antibody-antigen affinity is normally above 1×10⁶ M−1S−1,30 while even the fastest TZ-trans-cyclooctene (TCO) click reaction can barely reach that rate. Such large discrepancy of reaction rates underlies the design of FAIRS probes for one-step detection. The sandwich ELISA antibody pair that is purchased from Biolegend and is validated by conventional well-plate based ELISA has been conjugated with their respective fluorogenic click chemicals to be FAIRS probes. When the probes are mixed together in a low concentration, click chemicals won’t react significantly due to the relatively slow reaction rate. Once the antigen is present, the antibodies rapidly form a sandwich structure due to fast binding kinetics, which physically move click chemicals in proximity, leading to higher local concentration and click reaction to restore fluorescence.
Synthesis of FAIRS probes is shown in Figure 1. AN is conjugated with detection antibody through long chain PEG3400 mediated with streptavidin-biotin interaction. Possible steric hindrance has not been found to influence the binding affinity of detection antibody (Figure S4). Such a long arm is designed to ensure AN is approachable by TZ from capture antibody. TZ chemical contains BODIPY dye which fluorescence is suppressed by the unreacted TZ. AN as a strained dienophile reacts with TZ through irreversible inverse-electron-demand Diels-Alder reaction and release dinitriogen and release the product.23 TZ and capture antibody are also spaced by the same PEG3400 to free TZ from spatial hindrance. The conjugation protocol has been optimized to have 3–5 PEG3400 spaced click chemicals on both capture antibody and detection antibody. Such ratio for capture antibody is controlled by the stochiometric chemical modification of antibody and is validated by FPLC spectrum (Figure S5), and the ratio for detection antibody is managed by the amount of streptavidin and biotinylated chemicals. In our previous studies, this ratio of modification with long chain oligonucleotide is the optimal one without significantly impairing antibody binding capability.31
Figure 1.

Synthesis of FAIRS conjugates and fluorogenic click reaction. (a) Synthesis of AN conjugated detection antibody with PEG3400 spacer arm. (b) Synthesis of TZ conjugated capture antibody with PEG3400 spacer arm. (c) Schematic of fluorogenic click reaction with AN conjugated detection antibody and Tz conjugated capture antibody in the presence of antigen.
The long chain PEG3400 is a hydrophilic, flexible polymer that facilitates solubility and exposure of AN and TZ in aqueous solutions or culture media. It is chemically inert and does not have nonspecific binding to most biomolecules. Once the PEG3400 is stretched, it can reach a length between 25 nm and 35 nm, which is longer than a typical monoclonal antibody at 10–15 nm.32 Thus, even if AN and TZ are on the far ends of formed antibody sandwich structure, they still have a chance to physically contact and react to each other.
We have fully characterized the FAIRS probes in terms of turn-on fold, stability, response time and kinetics. Figure 2a shows 23-fold fluorescence turn-on signal when TZ-BODIPY is reacted with AN. The peak emission wavelength is measured to be 535 nm. Excellent stability has been found for both reacted and unreacted FAIRS probes. The control sample without antigen IL-6 marginally increases the signal by 5.1 % over 24 h, and the signal after detection of IL-6 keeps stable for the same period. When IL-6 recombinant protein is added to the FAIRS probes, they immediately respond by increasing fluorescence signal within minutes (Figure 2b & 2c). Various probe concentrations have been tested to characterize the response time and 2nd reaction kinetics (Figure S1). All the curves completely reach plateaus after ~20 min. The fastest response was observed at 0.5 mg/ml (3.3 μM) concentration of probes; however, this condition is not recommended for practical application due to high cost of reagents. Despite different probe concentration used, the characteristic t1/2 of half height is uniformly at about 6.5 min with standard deviation of 1.0 min, which is comparable to other available one-step technologies for protein detection.
Figure 2.

(a) Fluorescence emission spectra of TZ in the inactivated state and TZ-AN. The inset picture shows both solutions under LED light at 480 nm. (b) Stability of FAIRS detection signal for 24 h. Sample: FAIRS detection of IL-6 protein at 8,000 pg/mL; Control: FAIRS detection without IL-6; Blank: background signal of PBS. (c) Real-time detection signal at various FAIRS probe concentrations from 0.01 mg/mL to 0.5 mg/mL with 8 ng/ml IL-6 antigen. (d) Linear regression of kobs vs. probe concentration. The vertical bars indicate the SDs (n=3).
The 2nd order rate constant of FAIRS detection is calculated to be 52,633 M−1S−1 (Figure 2d). It is lower than the rate constant of most antibody-antigen binding, possibly because the aforementioned 106 M−1S−1 rate corresponds to single antibody-antigen binding instead of two antibody binding to the same antigen, and chemical modification of antibody may also influence the binding affinity to certain degree. We have also measured and obtained the 2nd order rate constant of AN-TZ click reaction only at 51.5 M−1S−1.24,33 This indicates the proximity brought by antibody-antigen binding enhances AN-TZ reaction by ~1,022 times. Theoretically, the FAIRS probes at 0.05 mg/ml are equivalent to 200 molecules/μm3. When in proximity, 3–5 molecules with average 25 nm separation distance result in between 1.9×10⁵ to 3.2×10⁵ molecules/μm3, assuming all chemicals are accessible for the reaction. Or, the local concentration of AN or TZ has been theoretically boosted by 960 to 1600 times, which is not far away from the calculated 1,022 times increase of reaction rate. Therefore, significant increased local concentration is the main factor contributing to the fast response of FAIRS.
Figure 3 shows sensor response at various concentrations of recombinant IL-6 proteins. Except for 10 pg/mL, all fluorescence intensities rise with time and reach plateau between 12.5 min and 20 min. The fluorescence data at 30 min were used to generate calibration curve (Figure 3b), which shows linearity over 102 dynamic range (the higher concentration was not measured due to significant deviation from the physiological condition). The limit of detection (LOD) is calculated to be 29 pg/mL, higher than LOD by standard sandwich ELISA at <10 pg/ml. This tradeoff is saved by the fast response and simple procedure of our sensor. Better sensitivity could be achievable by other design of fluorogenic chemicals to improve signal-to-noise ratio and brightness.
Figure 3.

(a) Real-time detection by FAIRS probes with IL-6 recombinant protein at various concentrations from 10 pg/mL to 10,000 pg/mL. FAIRS probe concentration was fixed at 0.05 mg/mL. The control curve shows the background signal from probes without IL-6 protein. The vertical bars indicate the SDs from three repeats. (b) Fluorescence intensities of FAIRS detection at various IL-6 protein concentration. Data at 30 min from (a) were generalized to produce this plot.
The FAIRS probes have been applied to measure cytokine IL-6 in human blood samples that were spiked with 100 pg/mL IL-6 recombinant proteins. IL-6 is an important marker for diagnosis of inflammatory diseases such as sepsis where IL-6 level in blood can be elevated to a range of ~150 pg/mL to >1000 pg/mL.34 Blood serum was diluted 2 times or 3 times to lower autofluorescence background before FAIRS detection. In both diluted serum samples, fluorescence signals are increasing over time, while they are significantly higher than background noise. After quantification using calibration curves, signal are converted to the diluted concentration, which is further multiplied by the dilution times to calculate the original concentration. The sample of 2x dilution was calculated to contain 111.0 pg/mL IL-6 before dilution, and the 3x dilution sample has 72.8 pg/mL IL-6 before dilution. When the 3x dilution sample was analyzed, the real IL-6 concentration was only 33.3 pg/mL close to detection limit. That may cause the significant deviation from the actual amount. Nevertheless, there is no statistical difference of IL-6 concentration measured by these two dilutions.
The FAIRS probes have been applied to the medium supernatant of cultured cells without stimulation (control) and the supernatant after lipopolysaccharide (LPS) stimulation for 24 h. C20 cell line is derived from immortalized human primary microglia, and it maintains microglial morphology, surface markers, and immune responses of microglia.35,36 Upon stimulation, C20 cells produce an array of inflammatory factors including IL-1β, IL-6, CCL2 and CXCL10.37 Our results in Figure 4c show IL-6 is detectable in the stimulated supernatant, while the control sample has negligible amount of IL-6. The quantified concentrations of IL-6 by FAIRS method and by conventional well-plate based method were compared in Figure 4d. In both control samples and LPS stimulated samples, the quantified IL-6 is consistent between the two methods as they don’t have significant differences statistically.
Figure 4.
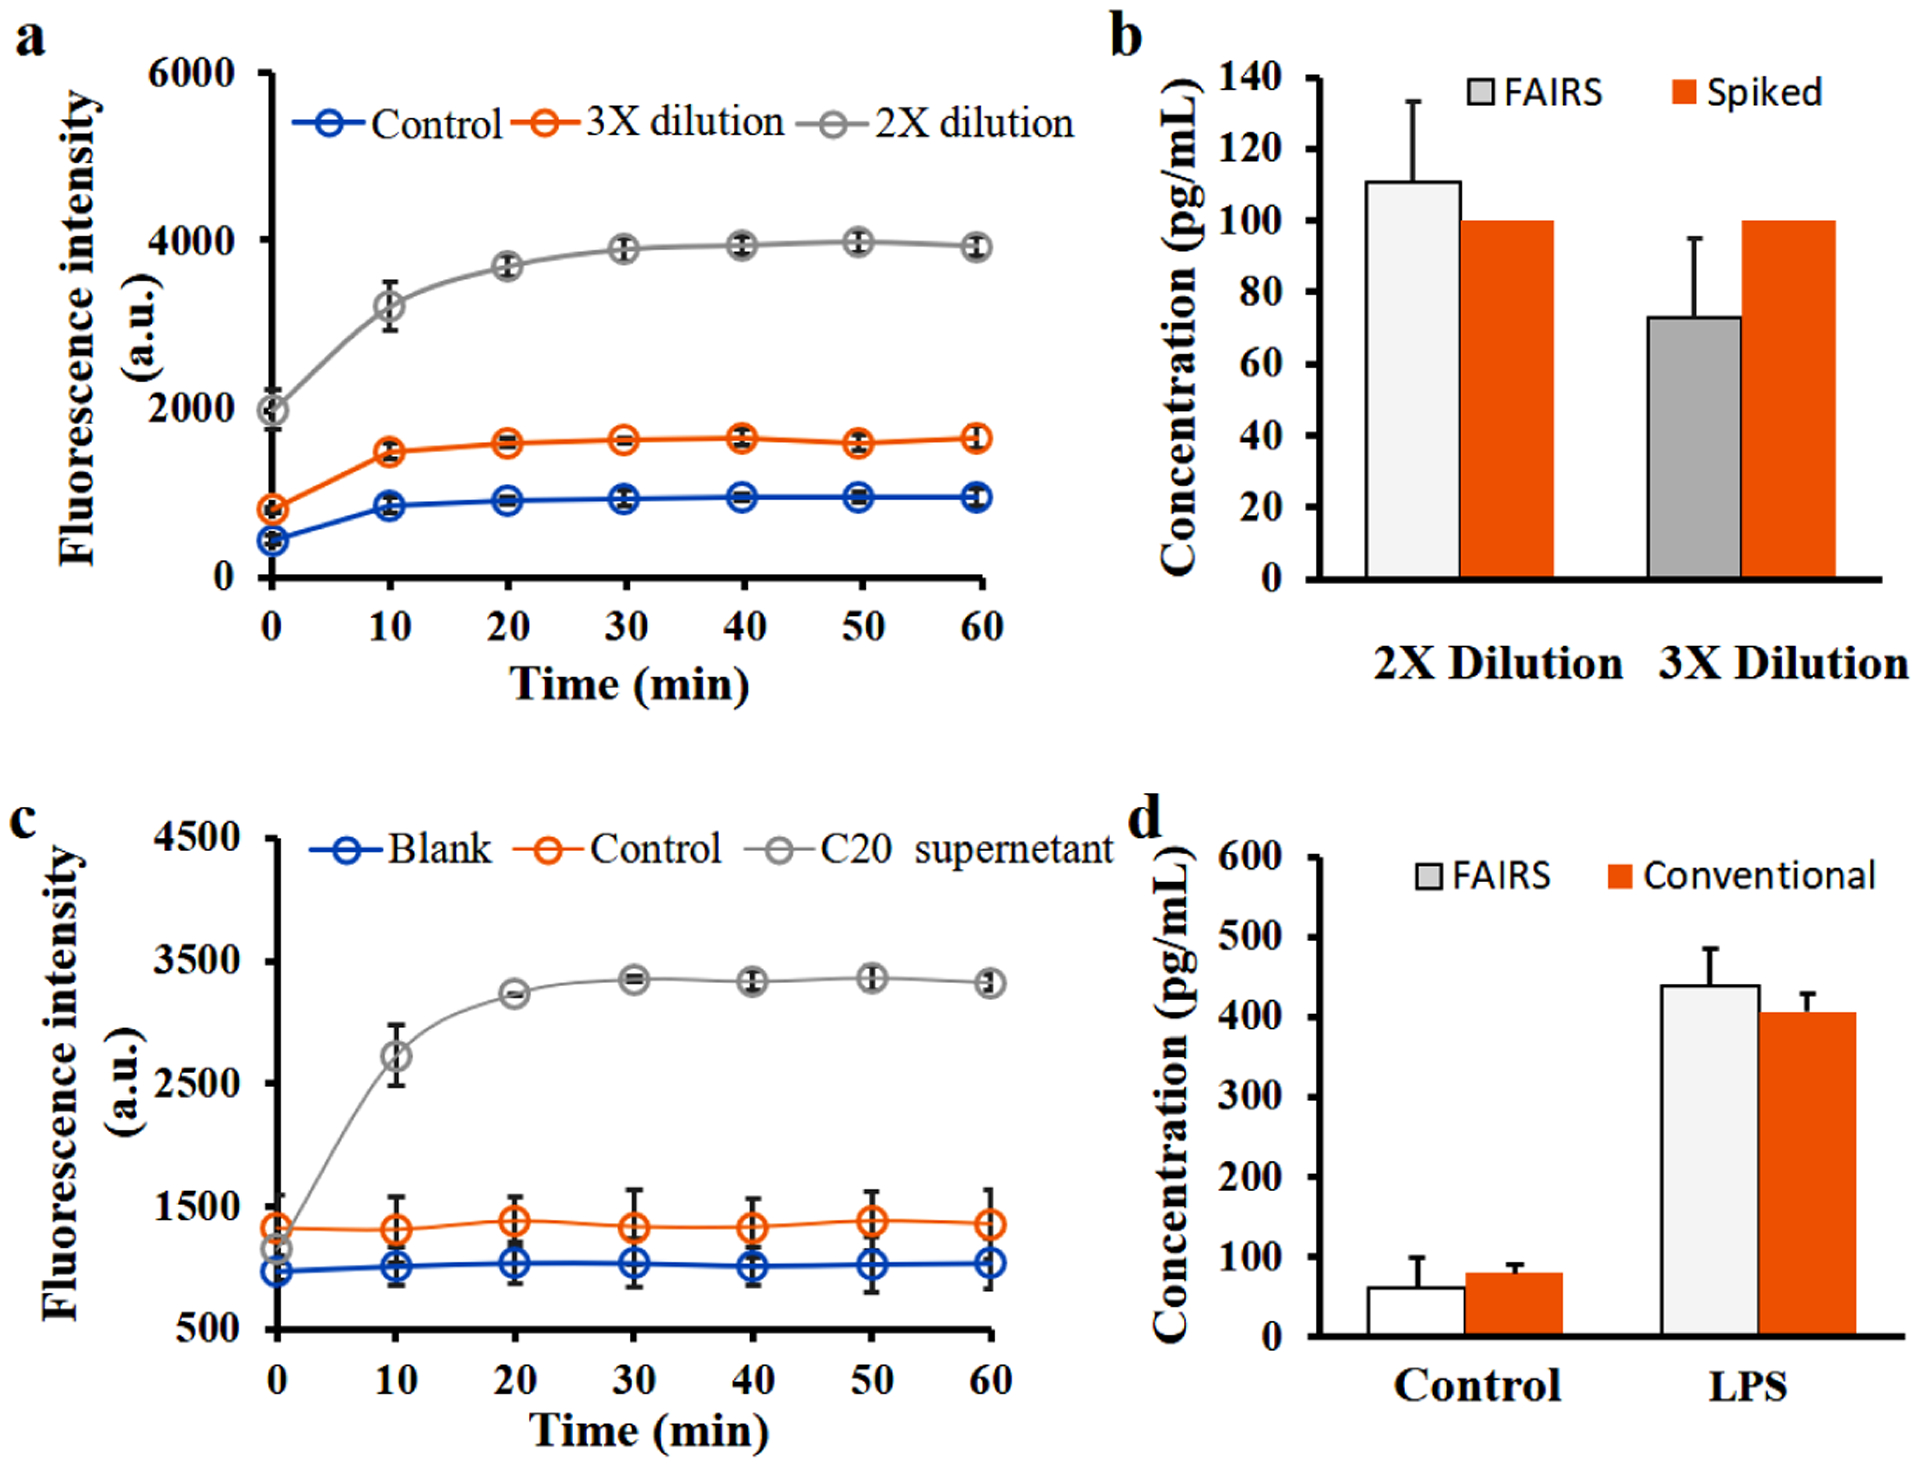
One-step detection of IL-6 protein in spiked human serum and cell culture medium. (a) Real-time fluorescence intensities of FAIRS detection in diluted serum samples. Control: no spike of IL-6 protein in the serum sample. (b) Measured and calibrated IL-6 concentrations in 2x dilution sample and 3x dilution sample using calibration curve, and the comparison with spiked IL-6 amount in serum. (c) Real-time fluorescence intensities of FAIRS detection of IL-6 protein in C20 cell culture supernatants. C20 supernatant: LPS stimulated samples; Control: no stimulation; Blank: DMEM/F-12 medium only. (d) Comparison of measured IL-6 concentrations in stimulated cell supernatants by FAIRS method and by conventional ELISA method. Both measured data were converted to pg/mL using calibration curves. Error bars correspond to SDs of three repeats. P values are 0.05 (*) and 0.01 (**) with 0.05 considered statistically significant.
CONCLUSION
In summary, we have developed a differential kinetics driven FAIRS technique for rapid, one-step detection of antigens. The FAIRS detection is based on fast affinity of antibody and antigen and slow reaction of fluorogenic click chemistry. The sensor has been fully characterized, and the response time is found to be 6.5±1.0 min. Our study discovered that the significant increase of local concentration of click chemicals due to tagged antibody-antigen binding quantitatively match the differences of the intrinsic 2nd order rate constants. This provides a guideline for further design of such sensors taking advantage of kinetics discrepancy. The FAIRS probes have been applied to real samples and are found accurate in measuring IL-6 concentrations. With the multiple values including simple procedure of detection and high specificity and sensitivity, we envision that FAIRS can find broad applications in diagnosis of inflammatory diseases, drug and biomarker discovery, and those in a field setting.
Supplementary Material
ACKNOWLEDGEMENT
We would like to thank Dr. David Alvarez-Carbonell at Case Western Reserve University for providing C20 cell line, and Dr. Feng Li at Brock University for discussion. This research was supported by National Institute of Health (R01GM12898401) and NYSTEM (C32574GG) to J.W.
Footnotes
Supporting Information
The Supporting Information is available free of charge on the ACS Publications website at DOI: https://pubs.acs.org/doi/10.1021/acs.analchem.9b04502.
Curve fitting for kinetics calculation; synthesis route of chemicals; NMR spectrum of chemical; influence of steric hindrance; FPLC and nanodrop result of conjugation.
The authors declare no competing financial interest.
REFERENCES:
- (1).Luchansky MS; Bailey RC J. Am. Chem. Soc 2011, 133, 20500–20506. [DOI] [PMC free article] [PubMed] [Google Scholar]
- (2).Milgram S; Cortes S; Villiers MB; Marche P; Buhot A; Livache T; Roupioz Y Biosens. Bioelectron 2011, 26, 2728–2732. [DOI] [PubMed] [Google Scholar]
- (3).Wu SH; Lee KL; Chiou A; Cheng X; Wei PK Small 2013, 9, 3532–3540. [DOI] [PubMed] [Google Scholar]
- (4).Li X; Soler M; Ozdemir CI; Belushkin A; Yesilkoy F; Altug H Lab chip 2017, 17, 2208–2217. [DOI] [PubMed] [Google Scholar]
- (5).Li X; Soler M; Szydzik C; Khoshmanesh K; Schmidt J; Coukos G; Mitchell A; Altug H Small 2018, 14, e1800698. [DOI] [PubMed] [Google Scholar]
- (6).Park J; Im H; Hong S; Castro CM; Weissleder R; Lee H ACS photonics 2018, 5, 487–494. [DOI] [PMC free article] [PubMed] [Google Scholar]
- (7).Huang X; Liu Y; Yung B; Xiong Y; Chen X ACS nano 2017, 11, 5238–5292. [DOI] [PubMed] [Google Scholar]
- (8).Kokko T; Liljenback T; Peltola MT; Kokko L; Soukka T Anal Chem 2008, 80, 9763–9768. [DOI] [PubMed] [Google Scholar]
- (9).Lee JS; Joung HA; Kim MG; Park CB ACS nano 2012, 6, 2978–2983. [DOI] [PubMed] [Google Scholar]
- (10).Liu X; Dai Q; Austin L; Coutts J; Knowles G; Zou J; Chen H; Huo QJ Am. Chem. Soc 2008, 130, 2780–2782. [DOI] [PubMed] [Google Scholar]
- (11).Wu BY; Wang HF; Chen JT; Yan XP J. Am. Chem. Soc 2011, 133, 686–688. [DOI] [PubMed] [Google Scholar]
- (12).Ge B; Huang YC; Sen D; Yu HZ Angew. Chem. Int. Ed. Engl 2010, 49, 9965–9967. [DOI] [PubMed] [Google Scholar]
- (13).Li F; Lin Y; Le XC Anal. Chem 2013, 85, 10835–10841. [DOI] [PubMed] [Google Scholar]
- (14).Seemann IT; Singh V; Azarkh M; Drescher M; Hartig JS J. Am. Chem. Soc 2011, 133, 4706–4709. [DOI] [PubMed] [Google Scholar]
- (15).Tang Y; Lin Y; Yang X; Wang Z; Le XC; Li F Anal. Chem 2015, 87, 8063–8066. [DOI] [PubMed] [Google Scholar]
- (16).Thomas JM; Chakraborty B; Sen D; Yu HZ J. Am. Chem. Soc 2012, 134, 13823–13833. [DOI] [PubMed] [Google Scholar]
- (17).Chen MJ; Wu YS; Lin GF; Hou JY; Li M; Liu TC Anal. Chim. Acta 2012, 741, 100–105. [DOI] [PubMed] [Google Scholar]
- (18).Li H; Shi L; Sun DE; Li P; Liu Z Biosens. Bioelectron 2016, 86, 791–798. [DOI] [PubMed] [Google Scholar]
- (19).Qiu X; Wegner KD; Wu Y-T; van Bergen en Henegouwen PMP; Jennings TL; Hildebrandt N Chem. Mater 2016, 28, 8256–8267. [Google Scholar]
- (20).Yu ZT; Guan H; Cheung MK; McHugh WM; Cornell TT; Shanley TP; Kurabayashi K; Fu J Sci. Rep 2015, 5, 11339. [DOI] [PMC free article] [PubMed] [Google Scholar]
- (21).Demidov VV; Dokholyan NV; Witte-Hoffmann C; Chalasani P; Yiu HW; Ding F; Yu Y; Cantor CR; Broude NE Proc. Natl. Acad. Sci. U.S.A 2006, 103, 2052–2056. [DOI] [PMC free article] [PubMed] [Google Scholar]
- (22).Romei MG; Boxer SG Ann. Rev. Biophys 2019, 48, 19–44. [DOI] [PMC free article] [PubMed] [Google Scholar]
- (23).Wu H; Alexander SC; Jin S; Devaraj NK J. Am. Chem. Soc 2016, 138, 11429–11432. [DOI] [PubMed] [Google Scholar]
- (24).Wu H; Devaraj NK Acc. Chem. Res 2018, 51, 1249–1259. [DOI] [PMC free article] [PubMed] [Google Scholar]
- (25).Hein CD; Liu XM; Wang D Pharm. Res 2008, 25, 2216–2230. [DOI] [PMC free article] [PubMed] [Google Scholar]
- (26).Jiang X; Hao X; Jing L; Wu G; Kang D; Liu X; Zhan P Expert Opin. Drug Discov 2019, 14, 779–789. [DOI] [PubMed] [Google Scholar]
- (27).Moses JE; Moorhouse AD Chem. Soc. Rev 2007, 36, 1249–1262. [DOI] [PubMed] [Google Scholar]
- (28).Thirumurugan P; Matosiuk D; Jozwiak K Chem. Rev 2013, 113, 4905–4979. [DOI] [PubMed] [Google Scholar]
- (29).Shieh P; Dien VT; Beahm BJ; Castellano JM; Wyss-Coray T; Bertozzi CR J. Am. Chem. Soc 2015, 137, 7145–7151. [DOI] [PMC free article] [PubMed] [Google Scholar]
- (30).Northrup SH; Erickson HP Proc. Natl. Acad. Sci. U. S. A 1992, 89, 3338–3342. [DOI] [PMC free article] [PubMed] [Google Scholar]
- (31).Ramirez LS; Wang JJ Visual. Exp 2016, e53644–e53645. [Google Scholar]
- (32).Ikai A; Wang T Protein Stretching IV: Analysis of Force-Extension Curves, 2000; Vol. 39, p 3784–3788. [Google Scholar]
- (33).Wu H; Cisneros BT; Cole CM; Devaraj NK J. Am. Chem. Soc 2014, 136, 17942–17945. [DOI] [PMC free article] [PubMed] [Google Scholar]
- (34).Harbarth S; Holeckova K; Froidevaux C; Pittet D; Ricou B; Grau GE; Vadas L; Pugin J Am. J. Respir. Crit. Care Med 2001, 164, 396–402. [DOI] [PubMed] [Google Scholar]
- (35).Alvarez-Carbonell D; Garcia-Mesa Y; Milne S; Das B; Dobrowolski C; Rojas R; Karn J Retrovirology 2017, 14, 9. [DOI] [PMC free article] [PubMed] [Google Scholar]
- (36).Garcia-Mesa Y; Jay TR; Checkley MA; Luttge B; Dobrowolski C; Valadkhan S; Landreth GE; Karn J; Alvarez-Carbonell DJ Neurovirol. 2017, 23, 47–66. [DOI] [PMC free article] [PubMed] [Google Scholar]
- (37).Davis RL, Buck DJ, McCracken K, Cox GW & Das S. Neuroimmunol. Neuroinflammation 2018, 60, 1–11. [Google Scholar]
Associated Data
This section collects any data citations, data availability statements, or supplementary materials included in this article.