

Abstract
Poor adherence to pre-exposure prophylaxis (PrEP) and antiretroviral therapy (ART) can lead to human immunodeficiency virus (HIV) acquisition and emergence of drug resistant infections, respectively. Measurement of antiviral drug levels provides objective adherence information that may help prevent adverse health outcomes. Gold standard drug-level measurement by liquid chromatography/mass spectrometry is centralized, heavily instrumented, and expensive and is thus unsuitable and unavailable for routine use in clinical settings. We developed the REverse TranscrIptase Chain Termination (RESTRICT) assay as a rapid and accessible measurement of drug levels indicative of long-term adherence to PrEP and ART. The assay uses designer single stranded DNA templates and intercalating fluorescent dyes to measure complementary DNA (cDNA) formation by reverse transcriptase in the presence of nucleotide reverse transcriptase inhibitor drugs. We optimized the RESTRICT assay using aqueous solutions of tenofovir diphosphate (TFV-DP), a metabolite that indicates long-term adherence to ART and PrEP, at concentrations over two orders of magnitude above and below the clinically relevant range. We used dilution in water as a simple sample preparation strategy to detect TFV-DP spiked into whole blood and accurately distinguished TFV-DP drug levels corresponding to low and high PrEP adherence. The RESTRICT assay is a fast and accessible test that could be useful test for patients and clinicians to measure and improve ART and PrEP adherence.
Keywords: Human Immunodeficiency Virus (HIV), Pre-exposure prophylaxis (PrEP), Adherence, Enzymatic Assay, Tenofovir Diphosphate, Drug Level Measurement, Antiretroviral
For nearly 40 million people living with HIV (PLHIV) and millions more at risk of acquiring HIV,1 antiretroviral therapy (ART) and pre-exposure prophylaxis (PrEP) can extend the length and quality of life and prevent HIV infection.2 As access to ART and PrEP improves globally, medication adherence increasingly becomes a challenge in HIV treatment and prevention.3 Poor ART adherence leads to viral rebound, emergence of drug-resistance, and treatment failure.4 Poor PrEP adherence reduces individual and community-level HIV prevention benefits. Roughly 30% of PLHIV receiving ART do not maintain sufficient adherence,25–7 and non-adherence rates were higher in several PrEP trials.38 Poor adherence occurs for several reasons including: barriers to care or medication, medication side effects, psychological problems, and poor provider-patient relationships.9 Clinicians, patients, and patient advocates need tools to accurately measure antiretroviral drug levels and assess interventions to improve health outcomes.3,10
There are several approaches for measuring ART and PrEP adherence. Subjective measures of adherence, such as self-reports and surveys,3,11 pill counts and tracking of pharmacy refills,3,12,13 and wireless pill containers,14,15 do not provide proof of pill ingestion limiting their accuracy.3 Digital pills with radio frequency transmitters embedded in gel caps provide proof of pill ingestion and information about short and long-term adherence patterns.16 Digital pills require an individual to wear an RFID receiver that transmits the signal to a cloud-based server, and require modification of the medication which may trigger additional regulatory review and may be cost prohibitive in global health settings.3
Quantifying concentrations of antiretroviral drugs and their metabolites is an objective approach to measure ART and PrEP adherence.3 Tenofovir disoproxil fumarate (TDF) is used in PrEP regimens currently recommended by health organizations (e.g. WHO and US Centers for Disease Control) and tenofovir-based treatment regimens are used in over 90% of all ART regimens.17 TDF is hydrolyzed into tenofovir (TFV) and phosphorylated intracellularly by nucleotide kinases into tenofovir diphosphate (TFV-DP).18 TFV-DP is a nucleotide reverse transcriptase inhibitor (NRTI) that terminates the DNA chain when HIV reverse transcriptase (HIV RT) synthesizes complementary DNA (cDNA). TFV has a short half-life (15 hours) in plasma and is detectable for up to 7 days.18,19 TFV measurement is susceptible to the “white coat” effect, where one is unable to correctly identify patients who take their medications just before a doctor’s office visit.20 Conversely, TFV-DP has a longer half-life (17 days) and accumulates 25-fold in red blood cells (RBCs) and thus provides adherence information over one to two months.19 TFV-DP drug levels are associated with health outcomes such as viral suppression21 and PrEP efficacy.22
Immunoassays were recently developed to measure TFV.23–26 Competitive immunoassays accurately classified recent dosage (≤ 24 hours)27 and identified non-adherence that was sustained for more than 7 days.26 However, all the HIV adherence monitoring immunoassays developed so far have targeted TFV and as such are susceptible to the white coat effect.25,28
TFV-DP drug levels can be measured accurately by liquid chromatography/mass spectrometry (LC/MS).19,29 Median TFV-DP concentrations ranged from 15 – 170 fmol/106 RBCs depending on adherence.19 Pharmacokinetic studies with LC/MS demonstrated that PrEP clients taking ≥4 doses/week are considered to maintain long-term adherence and are protected from HIV infection.29 Nevertheless, LC/MS requires significant capital investment, extensive sample preparation, trained personnel, cold reagent storage, and is unsuitable for routine clinical use.28
In this paper, we develop an enzymatic assay, termed REverSe TRanscrIptase Chain Termination (RESTRICT), for ART and PrEP long-term adherence monitoring. The assay is inspired by the mechanism of action of TFV-DP on HIV RT and infers drug levels from DNA polymerization. Enzyme inhibition assays targeting RT were originally developed in the context of HIV detection,30 enzyme characterization,31,32 drug screening,33–35 and drug resistance monitoring.33,36,37 Enzyme inhibition assays have also been used to evaluate the effectiveness of reverse transcription inhibitors and new drug candidates.33,35 There are a few reports describing the use of enzyme inhibition assays to measure metabolites of antiretroviral drugs for therapeutic drug monitoring.38–40 These early assays all measured incorporation of radio-labeled nucleotides into RNA templates in the presence of antiretroviral drugs extracted from peripheral blood mononuclear cells (PBMCs) which requires labor-intensive and heavily instrumented sample preparation and assay readout that are difficult to implement in routine clinical use. Early enzymatic assays for therapeutic drug monitoring also only targeted metabolites with short half-lives (hours) in PBMCs that were not indicative of long-term adherence.
Building on recent reports of the accumulation of TFV-DP in red blood cells (RBCs) and pharmacokinetic data about drug levels corresponding to ART and PrEP adherence,19,41,42 we designed the RESTRICT assay to measure antiretroviral drug levels in RBCs with whole blood dilution as a simple sample preparation strategy. We developed and optimized the RESTRICT assay using designer single-stranded DNA templates, primers, and intercalating fluorescence dyes to measure TFV-DP spiked in buffer and blood at clinically relevant concentrations. The RESTRICT assay accurately distinguished TFV-DP concentrations in blood corresponding to low and high long-term PrEP adherence in a simple four-step process in less than 1 hour.
EXPERIMENTAL SECTION
RT activity characterization
We determined optimal assay conditions for RT activity in order to minimize assay time and reagent concentration, using RT enzyme obtained through the NIH AIDS Reagent Program, Division of AIDS, NIAID, NIH: HIV-1 p66/p51 Reverse Transcriptase Recombinant Protein from Dr. Stuart Le Grice and Dr. Jennifer T. Miller.43 Reactions were carried out in a buffer containing: 60 mM Tris (77-86-1, Sigma), 30 mM KCl (7447-40-7, Sigma), 8 mM MgCl2 (7786-30-3, Sigma), and 10 mM dithiothreitol (20-265, Sigma) buffered to pH 8.0 using HCl (7647-01-0, Acros Organics).
The DNA template has a 20 nt primer binding site complementary to the M13 phage DNA primer AGA GTT TGA TCC TGG CTC AG (Catalog, Integrated DNA Technologies, Coralville, IA) followed by TTCA repeats with a total template length of 200 nt. The DNA template was designed using NUPACK software44 to preferentially include T bases because TFV-DP is a deoxyadenosine triphosphate (dATP) analog and thus will bind to T’s in the DNA template. The template was also designed to be free from secondary structures that could lead to unwanted pausing of the RT enzyme.45
To characterize RT activity, master mixes consisting of final concentrations of 5 nM DNA template, 5 nM primer, 50 μM deoxynucleotides (dNTPs) (D7295, Sigma), and RT enzyme concentrations of 25, 50, 100, and 200 nM were prepared in black, flat bottom polystyrene 384-well plates with non-binding surfaces (3575, Corning). RT enzyme was added last after which microwell plates were immediately incubated at 37°C in a microplate reader (SpectraMax iD3, Molecular Devices). Assays were stopped by manual addition of 40 μL of PicoGreen intercalating dye (P7581, ThermoFisher Scientific) diluted 1:400 in 1xTE (10128-588, VWR). Reactions were quenched at 16-min intervals up to a total time of 128 minutes. PicoGreen was incubated for 1 min before reading out the assay signal with the microplate reader. Assays were run in triplicate unless otherwise specified.
Data was analyzed using GraphPad Prism 8.1 software (GraphPad Software Inc.). The fluorescence intensity from the RT activity assay as a function of time was fit to an exponential curve. Fluorescence intensity as a function of RT enzyme concentration was fit to a four-parameter logistic regression curve that follows the familiar symmetrical sigmoidal shape of enzymatic assays. The four-parameter logistic curve fits take the form:
| (1) |
For RT activity assays, y represented the fluorescence intensity while x represented the enzyme concentration.
RESTRICT assay in buffer
We conducted RESTRICT assays with TFV-DP (166403-66-3, BOC Sciences Inc.) using 5 μL of DNA template, 5 μL of primer, 20 μL of dNTPs solution, 5 μL of TFV-DP, and 5 μL of HIV-1 RT. We varied reagent concentrations to optimize experimental conditions (see Table S1 in the supplementary information). Serial dilutions of TFV-DP in buffer spanning a concentration range of 1 – 10,000 nM were prepared to span two orders of magnitude above and below the clinically relevant range for adherence measurement as described in pharmacokinetic studies.19,41 RESTRICT assay optimization experiments were completed at 100, 300, 1560, and 6250 nM dNTP concentration.
Fluorescence from RESTRICT assay data was normalized to allow comparison of data points gathered at different dNTP concentrations as follows,
| (2) |
where the subscripts max and min denote the maximum and minimum measured fluorescence values from each inhibition curve. RESTRICT assay data were fit to four-parameter logistic regression curves. The 50% inhibition concentration (IC50) – the concentration of the drug required to achieve 50% inhibition of its target enzyme in vitro was obtained using equation 1 where the parameter x is the TFV-DP concentration and the parameter C represents the IC50.
RESTRICT assay in blood
HIV-negative, human whole blood (BioIVT, Westbury, NY) was diluted in nuclease-free water (3098, Sigma) to lyse RBCs and reduce unwanted RT inhibition by blood components such as immunoglobulins. Blood was mixed with the water by vortexing and incubating for 5 minutes to lyse RBCs.
Determining optimal blood dilution for RESTRICT
Serial dilutions of blood in water had final blood concentrations ranging from 2% to 10.0%. 5 μL of diluted whole blood at each final concentration was added to 35 μL of master mix (at 500 nM dNTP) to measure RT activity in the presence of diluted blood. Assays were stopped by adding PicoGreen and read out with the plate reader as described previously. Baseline correction was carried out by subtracting the average fluorescence from negative controls (with no RT enzyme) from the fluorescence obtained from each of the RT activity assays.
RESTRICT assays in 0.25% blood
We added 5 μL of TFV-DP spiked in 2% blood to 35 μL of master mix so that the final concentration of blood in the RESTRICT assay was 0.25%. We prepared serial dilutions of TFV-DP in diluted blood to correspond with a concentration range of 5.7 – 11,000 fmol/106 RBCs in whole blood, and thus cover the clinical range for TFV-DP adherence measurement (see Table S2 in the supplementary information). Master mixes for the RESTRICT assay in blood contained 2 nM DNA template, 20 nM primer, 100 nM dNTP, and 100 nM of HIV-1 RT. Data corresponding to high and low TFV-DP concentrations within the clinical range for adherence measurement were compared using an unpaired t-test in GraphPad Prism.
RESULTS & DISCUSSION
The RESTRICT assay measures the average length of cDNA synthesized by RT enzyme in the presence of nucleotide reverse transcriptase inhibitor (NRTI) drugs (Figure 1). RT forms double-stranded DNA (dsDNA) by polymerizing free nucleotides complementary to a nucleic acid template starting from a region of the template that is hybridized to a primer. At low NRTI concentrations relative to dNTP concentration, RT is unlikely to incorporate NRTIs into the cDNA chain and polymerizes the single-stranded template into full-length dsDNA strands that bind to many intercalating dye molecules and provide a high assay signal. Conversely, at high NRTI concentrations, RT is very likely to incorporate NRTIs into the cDNA chain early, resulting in chain termination and formation of short DNA fragments that bind to fewer intercalating dye molecules and provide a low assay signal. At moderate levels of NRTI, the length of the dsDNA product varies and follows a sigmoidal relationship characteristic of enzyme inhibition assays as shown in Figure 1. In this way, the fluorescence readout from the RESTRICT assay is used to distinguish low, medium, and high NRTI concentrations.
Figure 1.
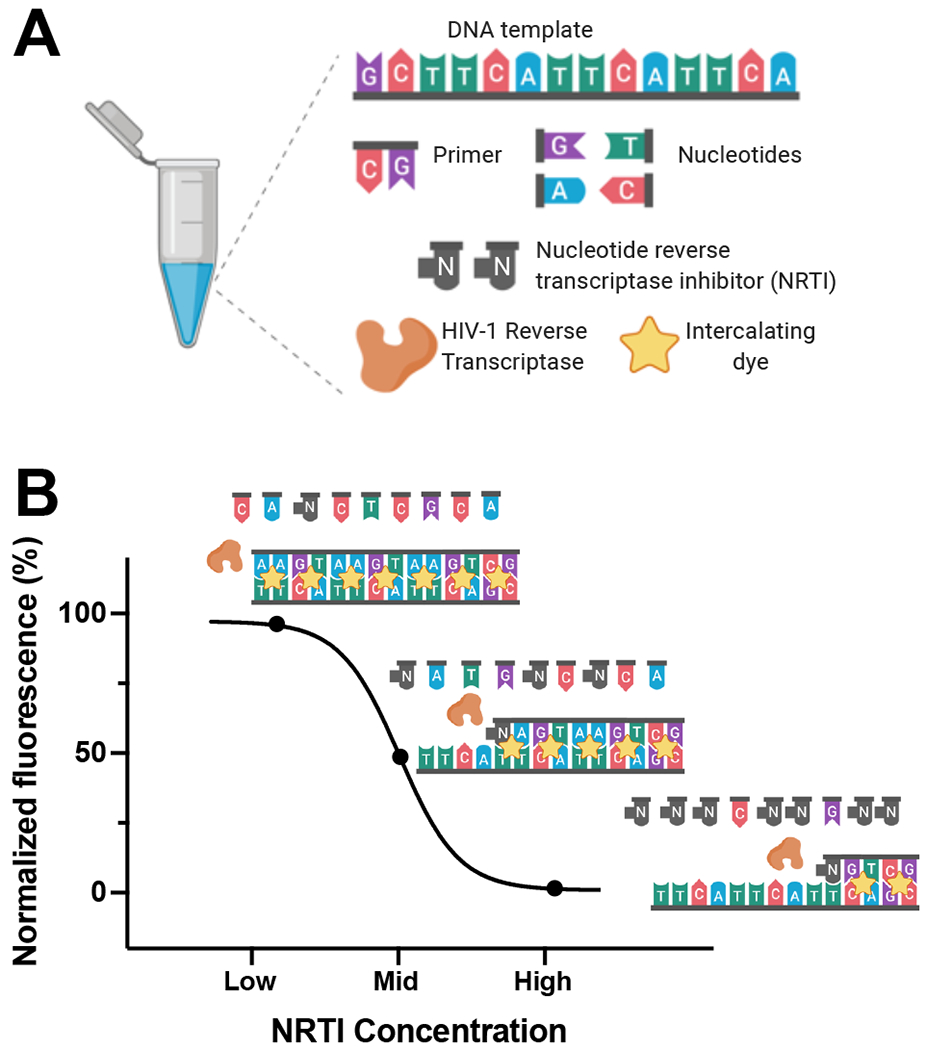
Overview of RESTRICT Assay. (A) The RESTRICT assay requires nucleic-acid templates, primers, nucleotides, nucleotide reverse transcriptase inhibitors (NRTIs), reverse transcriptase enzyme (RT), and intercalating dye. (B) The assay measures complementary DNA (cDNA) synthesis by RT. At low NRTI concentrations, RT forms full-length double-stranded DNA (dsDNA) products that provide high fluorescence with intercalating dye. At intermediate NRTI concentrations, RT forms dsDNA fragments that provide intermediate fluorescence, while at high NRTI concentrations, very little (if any) dsDNA is formed resulting in low fluorescence.
RT activity characterization
To characterize RT activity, we determined the effect of RT concentration and assay time on the rate of cDNA production as measured by the output fluorescence of an RT activity assay (Figure 2A). At final concentrations of 50, 100, and 200 nM of RT enzyme, the fluorescence intensity increases with time until ~60 min, when it plateaus. The fluorescence intensity remains flat over time at 25 nM RT. When optimizing enzyme inhibition assays it is desirable to choose an assay time where RT activity provides measurable fluorescence over baseline levels. The 30 min incubation time provided a strong signal over background levels.
Figure 2.
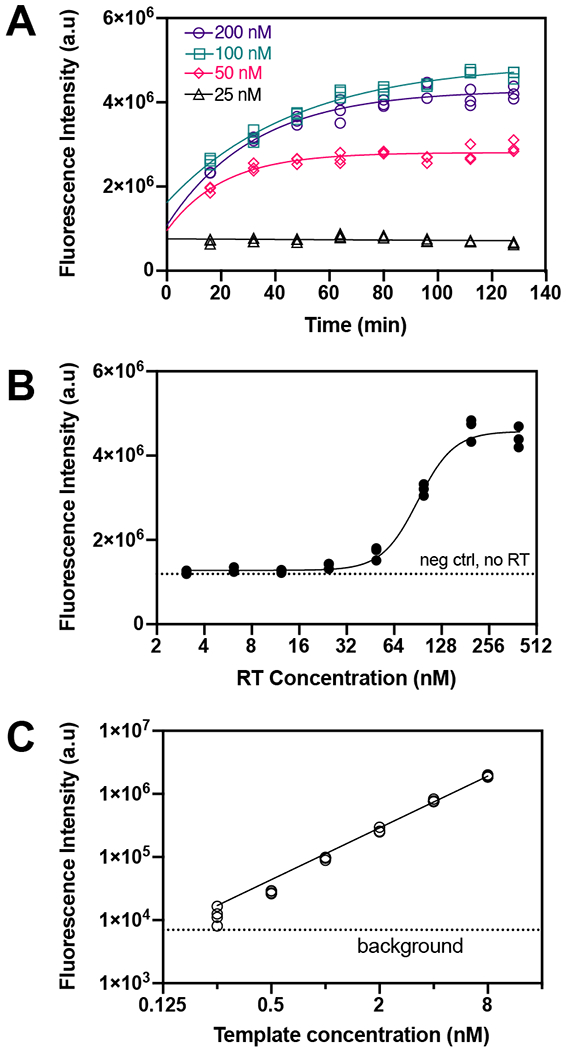
RT activity characterization. (A) Fluorescence intensity over time at different RT concentrations. Lines are exponential fits. N = 3. (B) Effect of RT concentration on fluorescence intensity at 30 min incubation time. Fluorescence intensity plateaus above 100 nM RT. The line is a four-parameter logistic regression fit. N = 3. (C) Effect of template concentration on fluorescence intensity at 100 nM RT and 30 min incubation time. N = 4.
We measured the fluorescence intensity at 8 RT enzyme concentrations to characterize the effect of RT concentration on assay output fluorescence (Figure 2B). The fluorescence intensity remains at the same level as the negative control (no RT) until ~25 nM RT when it begins to increase significantly, and then plateaus above ~200 nM RT. A concentration of 100 nM RT provides an optimal signal over background levels without using excess RT.
The fluorescence output as a function of DNA template concentration was used to determine the lowest template and dNTP concentrations required to measure fluorescence (Figure 2C). There is a linear relationship between template concentration and fluorescence intensity. The lowest detectable concentration, above background signal, was 0.25 nM of the DNA template.
RESTRICT assays in buffer
We performed RESTRICT assays with TFV-DP in buffer at concentrations spanning two orders of magnitude above and below the clinical range for PrEP adherence. The RESTRICT assay generates sigmoidal-shaped curves representative of enzyme inhibition assays as a function of TFV-DP concentration (Figure 3A). As dNTP concentration increases, the fluorescence intensity from the RESTRICT assay increases. This shift in the vertical direction is because we kept a fixed 50 to 1 ratio of dNTP to DNA template in all our experiments conducted at 100, 300, 1560, and 6250 nM dNTP. As shown in Figure 2C, there is a linear relationship between fluorescence intensity and DNA template concentration since more intercalating dyes molecules can be incorporated when there are higher DNA template concentrations.
Figure 3.
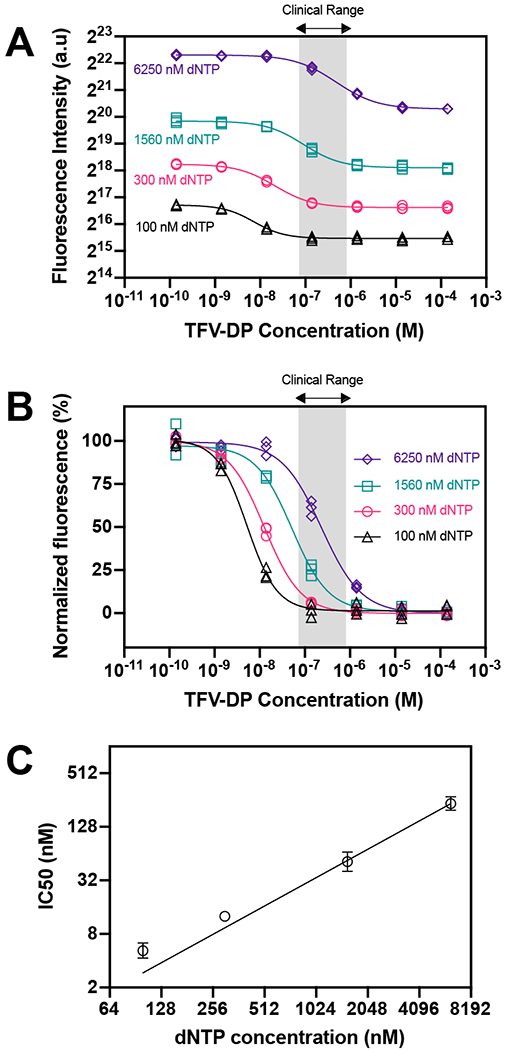
RESTRICT assay in buffer. (A) RESTRICT assays with TFV-DP at different dNTP concentrations. Fluorescence intensity increases and curve shift towards larger TFV-DP concentration with dNTP concentration. (B) Normalized data showing that inhibition curves shift right towards higher TFV-DP as dNTP concentration increases. Grey shaded region indicates clinical range for PrEP adherence. (C) Graph of dNTP concentration versus IC50 values. N = 3, error bars indicate 95% confidence intervals.
We also see a shift in the horizontal direction as dNTP concentration increases. We normalized the RESTRICT assay data to more easily compare inhibition curves at different dNTP concentrations (Figure 3B). As dNTP concentration increases the inhibition curves shift right, towards higher IC50 values. The IC50 shifts to higher IC50 because dNTP and TFV-DP compete for incorporation into the growing DNA strand and inhibition by lower TFV-DP concentrations can only be detected when there are lower dNTP concentrations.
Figure 3C shows the measured IC50 values as a function of dNTP concentration and indicates that IC50 values increase linearly as a function of dNTP concentration. This linear relationship allows us to design and optimize the RESTRICT assay to have a target IC50 value within the clinically relevant concentration range. We designed and optimized the RESTRICT assay to operate at concentration ranges up to two orders of magnitude lower than the clinical range (Figure 3B), allowing us to dilute complex samples (like blood) while still retaining the ability to detect clinically relevant concentrations.
RESTRICT assay in blood
We chose dilution in water as a simple and user-friendly strategy for sample preparation46 because it both lyses RBCs and also reduces the concentration of confounding blood matrix components that may suppress reverse transcriptase activity.46,47
Determining optimal blood dilution for RESTRICT
The net fluorescence intensity, i.e. the difference between fluorescence from each RT activity assay and the background signal from no enzyme controls, decreases as blood fraction increases and is indistinguishable from the background at 1.88% final concentration of blood (Figure 4A). The non-specific inhibition of RT enzyme by blood matrix components also decreases with the concentration of blood in the assay. Thus, diluting blood reduces non-specific inhibition of RT enzyme by blood matrix components (Figure 4A). However, the trade-off is that greater dilution also decreases the concentration of analyte (TFV-DP) in the sample.
Figure 4.
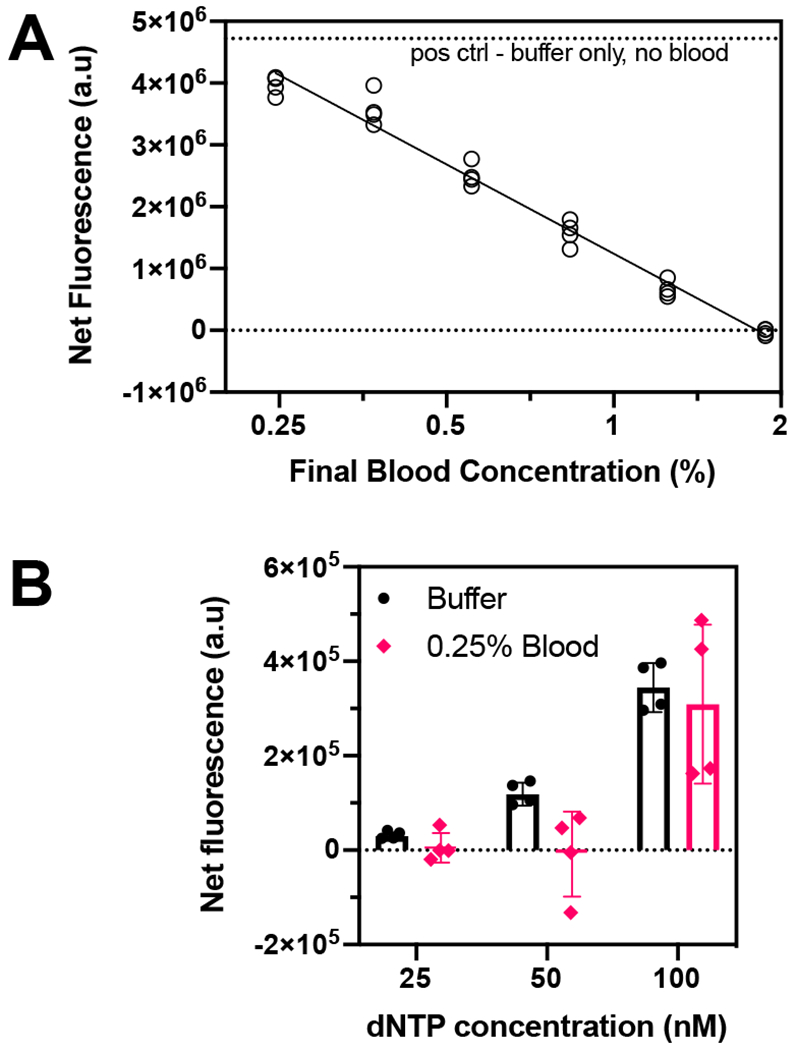
Determining optimal blood dilution for RESTRICT assay. (A) RT activity assay with 500 nM dNTP and diluted whole blood spiked into the assay at various final concentrations to determine how much dilution was required to minimize non-specific RT inhibition by blood matrix components. (B) RT activity assay with 0.25% final blood concentration at low dNTP concentrations to determine the lowest dNTP concentration at which RT activity was detectable in blood.
To detect TFV-DP in diluted blood, RESTRICT assays need to be performed at lower IC50 values compared to buffer. The inhibition curve is shifted to lower TFV-DP concentrations by decreasing dNTP concentration (Figures 3B and 3C). Figure 2C shows that the lowest dNTP concentration at which we could detect RT activity in buffer was 25 nM. Anticipating that RT activity in blood would be more variable than in buffer, we ran RT activity assays in diluted blood to determine the lowest dNTP concentration at which we could perform RT activity assays. We chose a final concentration of 0.25% blood (dilution factor 400x) to minimize non-specific inhibition (Figure 4A) where there was only a 20% decrease in fluorescence intensity in blood compared with buffer.
The net fluorescence intensity was measured in aqueous buffer and in 0.25% blood at dNTP concentrations of 25, 50, and 100 nM (Figure 4B). Here the net fluorescence is the difference between the fluorescence measured from each data point minus the signal from a “no RT enzyme” control at the same conditions to account for variations in background signal. Figure 4B shows that there is a measurable fluorescence signal at 25 nM dNTP in buffer that increases gradually as the dNTP concentration is increased to 50 nM and 100 nM, consistent with Figure 2C. Conversely, the variation in RT activity when 0.25% blood is introduced means that the net fluorescence is zero at both 25 nM and 50 nM dNTP and a measurable signal from RT activity in 0.25% blood is only measurable at 100 nM. Thus, we determined that the lowest dNTP concentration that we could work with in 0.25% whole blood was 100 nM.
RESTRICT assays in 0.25% blood
We evaluated the RESTRICT assay for semi-quantitative measurement of clinically relevant TFV-DP concentrations spiked in diluted whole blood. Figure 5A shows the steps required to complete the RESTRICT assay in blood. The entire assay, from sample collection to assay readout, was completed in less than 1 hour and required < 5 μL of blood. Figure 5B shows data from a RESTRICT assay with 0.25% blood, 100 nM dNTP, at various TFV-DP concentrations around the clinical range for PrEP adherence. The RESTRICT assay data in diluted blood (Figure 5B) followed the expected sigmoidal shape of enzyme inhibition assays seen in buffer (Figure 3B); however, there was greater variation for a given TFV-DP in fluorescence intensities in blood compared with buffer. The coefficient of variation of normalized fluorescence from the RESTRICT assay was 11% in blood and only 4% in buffer. This is expected given that blood is a complex sample that contains inhibitors that can suppress reverse transcriptase activity and auto-fluorescent components that can confound intercalating dye signal.
Figure 5.
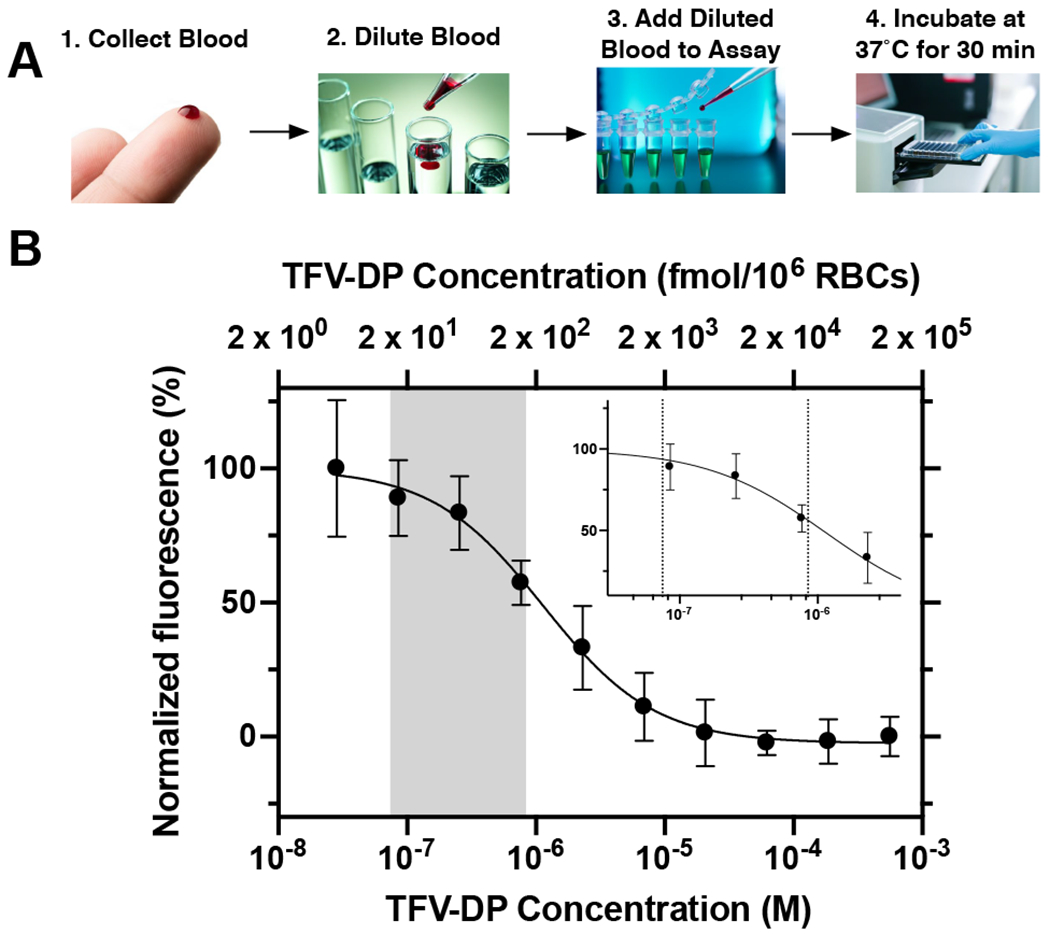
RESTRICT assay in diluted whole blood. (A) Flowchart for RESTRICT assay in blood. (B) Inhibition curve with TFV-DP spiked in diluted whole blood (0.25% final concentration) and 100 nM dNTP. Grey shaded region and inset show clinical range for TFV-DP adherence. N = 4, error bars indicate one standard deviation.
The RESTRICT assay in Figure 5B overlaps with the clinical range for TFV-DP adherence, although the IC50 of the curve is not located exactly at the center of the clinical range which would maximize the ability to distinguish low and high TFV-DP concentrations within the clinical range. Improved sample preparation to remove unwanted RT inhibition by blood components could allow the use of greater amounts of blood in the assay and enable further optimization of the RESTRICT assay to shift the inhibition curve to the center of the clinical range and reduce the variation when the assay is carried out with blood samples.
Nevertheless, the RESTRICT assay in blood could distinguish drug levels within the clinical range for PrEP adherence measurement. Median TFV-DP concentrations in RBCs range from 15 – 170 fmol/106 RBCs depending on adherence.19 As shown in Table 1, the p-value is 0.013 for the unpaired t-test comparing fluorescence at 16.9 fmol/106 RBCs TFV-DP, corresponding to low adherence (1 dose per week), with the fluorescence at 152.3 fmol/106 RBCs TFV-DP, corresponding to high adherence (7 doses per week). These data demonstrate that the RESTRICT assay accurately distinguishes TFV-DP drug levels in blood corresponding to low and high PrEP adherence with high statistical confidence.
Table 1.
Comparison between RESTRICT assay results at low and high concentrations within the clinical range for TFV-DP adherence measurement. N = 4.
| TFV-DP Concentration (nM) | 85.4 | 768 |
| TFV-DP Concentration (fmol/106 RBCs) | 16.9 | 152.3 |
| Corresponding Dosage Per Week | 1 | 7 |
| Corresponding TFV-DP Adherence Level | Low | High |
| Normalized fluorescence (%) | 89.0 | 57.5 |
| 95% confidence interval | 66.4 – 111.5 | 44.1 – 70.6 |
| P-value for Unpaired T-Test | 0.013 |
Potential use cases for the RESTRICT assay
The RESTRICT assay could provide information on antiretroviral drug levels prior to treatment failure and thus could be a useful and objective tool for monitoring long-term adherence to ART and PrEP in clinical practice and implementation studies. For example, the RESTRICT assay could be used to identify patients with low antiretroviral drug levels (< 2 doses per week)29,41 who are at risk of treatment failure. Objective measures of ART adherence could be used to compare the effectiveness of behavioral interventions designed to improve medication adherence and HIV treatment and prevention outcomes.3 The RESTRICT assay could also be used in conjunction with HIV viral load tests to identify patients at risk of viral rebound or development of drug resistance. Recent work shows that patients with high viral loads and moderately high TFV-DP drug levels are likely to have drug resistant infections.48 In low- and middle-income countries, where drug resistance tests are inaccessible, HIV positive ART patients who exhibit high viral load levels are often switched to more expensive second or third line drug regimens.49 The RESTRICT assay could be a useful tool to determine if poor adherence is a contributor to high viral load, and prevent unnecessary use of the second and third line drugs. Furthermore, in settings where viral load measurements are expensive and inaccessible, the RESTRICT assay could be a rapid and inexpensive test that could be performed regularly to determine the risk of treatment failure.
Limitations of the RESTRICT assay
The assay has some limitations that might preclude its use in particular contexts. For example, the assay does not yet distinguish between inhibition by NRTIs like TFV-DP and non-nucleoside reverse transcriptase inhibitors (NNRTIs) like efavirenz that are sometimes included in ART regimens. For example, a patient may falsely appear adherent if they took a recent dose of NNRTIs even though they have not been regularly taking their NRTIs. This limitation is not a typical concern in PrEP clients since NNRTIs are not used in PrEP. Furthermore, as first line ART regimens in most low- and middle-income countries are switching from NNRTIs to dolutegravir (an integrase inhibitor),50 this limitation might not be a long-term concern. Also, false positive results might be encountered as a result of impaired drug clearance, such as in renal/hepatic impairment. ART drug doses are usually set based on a patient’s creatinine clearance (CrCl) which is an indicator of renal function in patients.51 Clinicians would be able to identify false positive results that arise due to impaired drug clearance by checking patient’s CrCl levels.
SUMMARY
We showed that the RESTRICT enzymatic assay can be used to measure HIV drug levels indicative of long-term PrEP and ART adherence. The assay measures cDNA formation by RT in the presence of TFV-DP. At high TFV-DP concentrations, cDNA chain termination occurs resulting in lower fluorescence signals from intercalating dye. We developed and optimized the RESTRICT assay at TFV-DP concentrations two orders of magnitude above and below the clinical range for PrEP adherence. We showed that there is a linear relationship between dNTP concentration and the IC50 of the RESTRICT assay and that decreasing dNTP concentration shifts the RESTRICT assay to lower TFV-DP concentrations. We spiked TFV-DP into hemolyzed whole blood at concentrations within the clinical range for adherence measurement and demonstrated that the assay could distinguish concentrations corresponding to low and high PrEP adherence in less than 1 hour. The RESTRICT assay could be a useful test for rapid and accessible measurement of long-term antiretroviral drug levels to identify patients at risk of treatment failure. This work is innovative because it develops a new category of adherence measurement test that could allow patients and clinicians to monitor and improve long-term ART and PrEP adherence and healthcare outcomes. Ongoing work is aimed at testing clinical samples and benchmarking the RESTRICT assay against drug level measurement by LC/MS.
Supplementary Material
ACKNOWLEDGMENTS
We are grateful for funding from the NIH (R01AI136648, R21AI127200, R01EB022630) and the M. J. Murdock Charitable Trust. Dr. Olanrewaju thanks the Mistletoe Research Foundation for funding and support. We are also grateful for helpful conversations with Jay Rutherford, Bob Atkinson, and Enos Kline at the University of Washington, as well as Dr Rebecca Sandlin and Dr Mehmet Toner at Harvard Medical School. Research reported in this publication was supported by the University of Washington / Fred Hutch Center for AIDS Research, an NIH-funded program under award number AI027757 which is supported by the following NIH Institutes and Centers: NIAID, NCI, NIMH, NIDA, NICHD, NHLBI, NIA, NIGMS, NIDDK. Figure 1 was created with BioRender.com.
Footnotes
Supporting Information
Tables providing further additional details on the experimental conditions (master mix preparation for RESTRICT assays and TFV-DP dilutions in blood) are provided in the supplementary information.
REFERENCES
- (1).UNAIDS Data 2019; UNAIDS, 2019; pp 1–476. [Google Scholar]
- (2).WHO Expands Recommendation on Oral Pre-Exposure Prophylaxis of HIV Infection (PrEP); WHO/HIV/2015.48; World Health Organization (WHO), 2015. [Google Scholar]
- (3).Castillo-Mancilla JR; Haberer JE Adherence Measurements in HIV: New Advancements in Pharmacologic Methods and Real-Time Monitoring. Curr. HIV/AIDS Rep 2018, 15 (1), 49–59. 10.1007/s11904-018-0377-0. [DOI] [PMC free article] [PubMed] [Google Scholar]
- (4).Hamers RL; Kityo C; Lange JMA; Wit T. F. R. de; Mugyenyi P Global Threat from Drug Resistant HIV in Sub-Saharan Africa. BMJ 2012, 344, e4159 10.1136/bmj.e4159. [DOI] [PubMed] [Google Scholar]
- (5).Mills EJ; Nachega JB; Buchan I; Orbinski J; Attaran A; Singh S; Rachlis B; Wu P; Cooper C; Thabane L; et al. Adherence to Antiretroviral Therapy in Sub-Saharan Africa and North America: A Meta-Analysis. JAMA 2006, 296 (6), 679–690. 10.1001/jama.296.6.679. [DOI] [PubMed] [Google Scholar]
- (6).Ortego C; Huedo-Medina TB; Llorca J; Sevilla L; Santos P; Rodriguez E; Warren MR; Vejo J Adherence to Highly Active Antiretroviral Therapy (HAART): A Meta-Analysis. AIDS Behav. 2011, 15 (7), 1381–1396. 10.1007/s10461-011-9942-x. [DOI] [PubMed] [Google Scholar]
- (7).O’Connor JL; Gardner EM; Mannheimer SB; Lifson AR; Esser S; Telzak EE; Phillips AN Factors Associated With Adherence Amongst 5295 People Receiving Antiretroviral Therapy as Part of an International Trial. J. Infect. Dis 2013, 208 (1), 40–49. 10.1093/infdis/jis731. [DOI] [PMC free article] [PubMed] [Google Scholar]
- (8).Fonner VA; Dalglish SL; Kennedy CE; Baggaley R; O’Reilly KR; Koechlin FM; Rodolph M; Hodges-Mameletzis I; Grant RM Effectiveness and Safety of Oral HIV Preexposure Prophylaxis for All Populations. AIDS 2016, 30 (12), 1973–1983. 10.1097/QAD.0000000000001145. [DOI] [PMC free article] [PubMed] [Google Scholar]
- (9).Osterberg L; Blaschke T Adherence to Medication. N. Engl. J. Med 2005, 353 (5), 487–497. 10.1056/NEJMra050100. [DOI] [PubMed] [Google Scholar]
- (10).Amico KR; Stirratt MJ Adherence to Preexposure Prophylaxis: Current, Emerging, and Anticipated Bases of Evidence. Clin. Infect. Dis 2014, 59 (suppl_1), S55–S60. 10.1093/cid/ciu266. [DOI] [PMC free article] [PubMed] [Google Scholar]
- (11).Simoni JM; Kurth AE; Pearson CR; Pantalone DW; Merrill JO; Frick PA Self-Report Measures of Antiretroviral Therapy Adherence: A Review with Recommendations for HIV Research and Clinical Management. AIDS Behav. 2006, 10 (3), 227–245. 10.1007/s10461-006-9078-6. [DOI] [PMC free article] [PubMed] [Google Scholar]
- (12).Abaasa A; Hendrix C; Gandhi M; Anderson P; Kamali A; Kibengo F; Sanders EJ; Mutua G; Bumpus NN; Priddy F; et al. Utility of Different Adherence Measures for PrEP: Patterns and Incremental Value. AIDS Behav. 2018, 22 (4), 1165–1173. 10.1007/s10461-017-1951-y. [DOI] [PMC free article] [PubMed] [Google Scholar]
- (13).McMahon JH; Jordan MR; Kelley K; Bertagnolio S; Hong SY; Wanke CA; Lewin SR; Elliott JH Pharmacy Adherence Measures to Assess Adherence to Antiretroviral Therapy: Review of the Literature and Implications for Treatment Monitoring. Clin. Infect. Dis 2011, 52 (4), 493–506. 10.1093/cid/ciq167. [DOI] [PMC free article] [PubMed] [Google Scholar]
- (14).Haberer JE; Kahane J; Kigozi I; Emenyonu N; Hunt P; Martin J; Bangsberg DR Real-Time Adherence Monitoring for HIV Antiretroviral Therapy. AIDS Behav. 2010, 14 (6), 1340–1346. 10.1007/s10461-010-9799-4. [DOI] [PMC free article] [PubMed] [Google Scholar]
- (15).Garrison LE; Haberer JE Technological Methods to Measure Adherence to Antiretroviral Therapy and Preexposure Prophylaxis: Curr. Opin. HIV AIDS 2017, 12 (5), 467–474. 10.1097/COH.0000000000000393. [DOI] [PubMed] [Google Scholar]
- (16).Chai PR; Castillo-Mancilla J; Buffkin E; Darling C; Rosen RK; Horvath KJ; Boudreaux ED; Robbins GK; Hibberd PL; Boyer EW Utilizing an Ingestible Biosensor to Assess Real-Time Medication Adherence. J. Med. Toxicol 2015, 11 (4), 439–444. 10.1007/s13181-015-0494-8. [DOI] [PMC free article] [PubMed] [Google Scholar]
- (17).Saag MS; Benson CA; Gandhi RT; Hoy JF; Landovitz RJ; Mugavero MJ; Sax PE; Smith DM; Thompson MA; Buchbinder SP; et al. Antiretroviral Drugs for Treatment and Prevention of HIV Infection in Adults: 2018 Recommendations of the International Antiviral Society–USA Panel. JAMA 2018, 320 (4), 379–396. 10.1001/jama.2018.8431. [DOI] [PMC free article] [PubMed] [Google Scholar]
- (18).Kearney BP; Flaherty JF; Shah J Tenofovir Disoproxil Fumarate. Clin. Pharmacokinet 2004, 43 (9), 595–612. 10.2165/00003088-200443090-00003. [DOI] [PubMed] [Google Scholar]
- (19).Castillo-Mancilla JR; Zheng J-H; Rower JE; Meditz A; Gardner EM; Predhomme J; Fernandez C; Langness J; Kiser JJ; Bushman LR; et al. Tenofovir, Emtricitabine, and Tenofovir Diphosphate in Dried Blood Spots for Determining Recent and Cumulative Drug Exposure. AIDS Res. Hum. Retroviruses 2012, 121010062750004 10.1089/aid.2012.0089. [DOI] [PMC free article] [PubMed] [Google Scholar]
- (20).Spinelli MA; Glidden DV; Anderson PL; Gandhi M; Cohen S; Vittinghoff E; Coleman ME; Scott H; Bacon O; Elion R; et al. Short-Term Adherence Marker to PrEP Predicts Future Nonretention in a Large PrEP Demo Project: Implications for Point-of-Care Adherence Testing. J Acquir Immune Defic Syndr 2019, 81 (2), 158–162. [DOI] [PMC free article] [PubMed] [Google Scholar]
- (21).Castillo-Mancilla JR; Morrow M; Coyle RP; Coleman SS; Gardner EM; Zheng J-H; Ellison L; Bushman LR; Kiser JJ; Mawhinney S; et al. Tenofovir Diphosphate in Dried Blood Spots Is Strongly Associated With Viral Suppression in Individuals With Human Immunodeficiency Virus Infections. Clin. Infect. Dis 2019, 68 (8), 1335–1342. 10.1093/cid/ciy708. [DOI] [PMC free article] [PubMed] [Google Scholar]
- (22).Grant RM; Anderson PL; McMahan V; Liu A; Amico KR; Mehrotra M; Hosek S; Mosquera C; Casapia M; Montoya O; et al. Uptake of Pre-Exposure Prophylaxis, Sexual Practices, and HIV Incidence in Men and Transgender Women Who Have Sex with Men: A Cohort Study. Lancet Infect. Dis 2014, 14 (9), 820–829. 10.1016/S1473-3099(14)70847-3. [DOI] [PMC free article] [PubMed] [Google Scholar]
- (23).Pratt GW; Fan A; Melakeberhan B; Klapperich CM A Competitive Lateral Flow Assay for the Detection of Tenofovir. Anal. Chim. Acta 2018, 1017, 34–40. 10.1016/j.aca.2018.02.039. [DOI] [PMC free article] [PubMed] [Google Scholar]
- (24).Gandhi M; Bacchetti P; Rodrigues WC; Spinelli M; Koss CA; Drain PK; Baeten JM; Mugo NR; Ngure K; Benet LZ; et al. Development and Validation of an Immunoassay for Tenofovir in Urine as a Real-Time Metric of Antiretroviral Adherence. EClinicalMedicine 2018, 2–3, 22–28. 10.1016/j.eclinm.2018.08.004. [DOI] [PMC free article] [PubMed] [Google Scholar]
- (25).Spinelli MA; Glidden DV; Rodrigues WC; Wang G; Vincent M; Okochi H; Kuncze K; Mehrotra M; Defechereux P; Buchbinder SP; et al. Low Tenofovir Level in Urine by a Novel Immunoassay Is Associated with Seroconversion in a Preexposure Prophylaxis Demonstration Project: AIDS 2019, 33 (5), 867–872. 10.1097/QAD.0000000000002135. [DOI] [PMC free article] [PubMed] [Google Scholar]
- (26).Koenig HC; Mounzer K; Daughtridge GW; Sloan CE; Lalley‐Chareczko L; Moorthy GS; Conyngham SC; Zuppa AF; Montaner LJ; Tebas P Urine Assay for Tenofovir to Monitor Adherence in Real Time to Tenofovir Disoproxil Fumarate/Emtricitabine as Pre-Exposure Prophylaxis. HIV Med. 2017, 18 (6), 412–418. 10.1111/hiv.12518. [DOI] [PMC free article] [PubMed] [Google Scholar]
- (27).Gandhi MM; Bacchetti P; Spinelli M. A. M. a; Okochi H; Baeten JM; Siriprakaisil O. M. e; Klinbuayaem V. M. e; Rodrigues W. C. M. f; Wang G; Vincent M. M. f; et al. Validation of a Urine Tenofovir Immunoassay for Adherence Monitoring to PrEP and ART and Establishing the Cutoff for a Point-of-Care Test. J. Acquir. Immune Defic. Syndr 2019, 81 (1), 72–77. 10.1097/QAI.0000000000001971. [DOI] [PMC free article] [PubMed] [Google Scholar]
- (28).Anderson PL What Can Urine Tell Us About Medication Adherence? EClinicalMedicine 2018, 2, 5–6. 10.1016/j.eclinm.2018.09.003. [DOI] [PMC free article] [PubMed] [Google Scholar]
- (29).Anderson PL; Glidden DV; Liu A; Buchbinder S; Lama JR; Guanira JV; McMahan V; Bushman LR; Casapia M; Montoya-Herrera O; et al. Emtricitabine-Tenofovir Concentrations and Pre-Exposure Prophylaxis Efficacy in Men Who Have Sex with Men. Sci. Transl. Med 2012, 4 (151), 151ra125–151ra125. 10.1126/scitranslmed.3004006. [DOI] [PMC free article] [PubMed] [Google Scholar]
- (30).Porstmann T; Meissner K; Glaser R; Döpel S-H; Sydow G A Sensitive Non-Isotopic Assay Specific for HIV-1 Associated Reverse Transcriptase. J. Virol. Methods 1991, 31 (2), 181–188. 10.1016/0166-0934(91)90156-T. [DOI] [PubMed] [Google Scholar]
- (31).Balzarini J; Perez-Perez MJ; San-Felix A; Camarasa MJ; Bathurst IC; Barr PJ; Clercq ED Kinetics of Inhibition of Human Immunodeficiency Virus Type 1 (HIV-1) Reverse Transcriptase by the Novel HIV-1-Specific Nucleoside Analogue [2’,5’-Bis-O-(Tert-Butyldimethylsilyl)-Beta-D-Ribofuranosyl]-3’-Spiro-5“-(4”-Amino-1”,2”-Oxathiole-2”,2”-Dioxide)Thymine (TSAO-T). J. Biol. Chem 1992, 267 (17), 11831–11838. [PubMed] [Google Scholar]
- (32).Cheng YC; Dutschman GE; Bastow KF; Sarngadharan MG; Ting RY Human Immunodeficiency Virus Reverse Transcriptase. General Properties and Its Interactions with Nucleoside Triphosphate Analogs. J. Biol. Chem 1987, 262 (5), 2187–2189. [PubMed] [Google Scholar]
- (33).Kokkula C; Palanisamy N; Ericstam M; Lennerstrand J SYBR Green II Dye-Based Real-Time Assay for Measuring Inhibitor Activity Against HIV-1 Reverse Transcriptase. Mol. Biotechnol 2016, 58 (10), 619–625. 10.1007/s12033-016-9961-y. [DOI] [PubMed] [Google Scholar]
- (34).Frezza C; Balestrieri E; Marino‐Merlo F; Mastino A; Macchi B A Novel, Cell-Free PCR-Based Assay for Evaluating the Inhibitory Activity of Antiretroviral Compounds against HIV Reverse Transcriptase. J. Med. Virol 2014, 86 (1), 1–7. 10.1002/jmv.23748. [DOI] [PubMed] [Google Scholar]
- (35).Marino-Merlo F; Frezza C; Papaianni E; Valletta E; Mastino A; Macchi B Development and Evaluation of a Simple and Effective RT-QPCR Inhibitory Assay for Detection of the Efficacy of Compounds towards HIV Reverse Transcriptase. Appl. Microbiol. Biotechnol 2017, 101 (22), 8249–8258. 10.1007/s00253-017-8544-6. [DOI] [PubMed] [Google Scholar]
- (36).Boyer PL; Tantillo C; Jacobo-Molina A; Nanni RG; Ding J; Arnold E; Hughes SH Sensitivity of Wild-Type Human Immunodeficiency Virus Type 1 Reverse Transcriptase to Dideoxynucleotides Depends on Template Length; the Sensitivity of Drug-Resistant Mutants Does Not. Proc. Natl. Acad. Sci 1994, 91 (11), 4882–4886. 10.1073/pnas.91.11.4882. [DOI] [PMC free article] [PubMed] [Google Scholar]
- (37).Marino-Merlo F; Macchi B; Armenia D; Bellocchi MC; Ceccherini-Silberstein F; Mastino A; Grelli S Focus on Recently Developed Assays for Detection of Resistance/Sensitivity to Reverse Transcriptase Inhibitors. Appl. Microbiol. Biotechnol 2018, 102 (23), 9925–9936. 10.1007/s00253-018-9390-x. [DOI] [PubMed] [Google Scholar]
- (38).Robbins BL; Rodman J; McDonald C; Srinivas RV; Flynn PM; Fridland A Enzymatic Assay for Measurement of Zidovudine Triphosphate in Peripheral Blood Mononuclear Cells. Antimicrob. Agents Chemother 1994, 38 (1), 115–121. 10.1128/AAC.38.1.115. [DOI] [PMC free article] [PubMed] [Google Scholar]
- (39).Kewn S; Hoggard PG; Sales SD; Jones K; Maher B; Khoo SH; Back DJ Development of Enzymatic Assays for Quantification of Intracellular Lamivudine and Carbovir Triphosphate Levels in Peripheral Blood Mononuclear Cells from Human Immunodeficiency Virus-Infected Patients. Antimicrob. Agents Chemother 2002, 46 (1), 135–143. 10.1128/AAC.46.1.135-143.2002. [DOI] [PMC free article] [PubMed] [Google Scholar]
- (40).Kewn S; Wang LH; Hoggard PG; Rousseau F; Hart R; MacNeela JP; Khoo SH; Back DJ Enzymatic Assay for Measurement of Intracellular DXG Triphosphate Concentrations in Peripheral Blood Mononuclear Cells from Human Immunodeficiency Virus Type 1-Infected Patients. Antimicrob. Agents Chemother 2003, 47 (1), 255–261. 10.1128/AAC.47.1.255-261.2003. [DOI] [PMC free article] [PubMed] [Google Scholar]
- (41).Anderson PL; Liu AY; Castillo-Mancilla JR; Gardner EM; Seifert SM; McHugh C; Wagner T; Campbell K; Morrow M; Ibrahim M; et al. Intracellular Tenofovir-Diphosphate and Emtricitabine-Triphosphate in Dried Blood Spots Following Directly Observed Therapy. Antimicrob. Agents Chemother 2018, 62 (1), e01710–17. 10.1128/AAC.01710-17. [DOI] [PMC free article] [PubMed] [Google Scholar]
- (42).Durand-Gasselin L; Silva DD; Benech H; Pruvost A; Grassi J Evidence and Possible Consequences of the Phosphorylation of Nucleoside Reverse Transcriptase Inhibitors in Human Red Blood Cells. Antimicrob. Agents Chemother 2007, 51 (6), 2105–2111. 10.1128/AAC.00831-06. [DOI] [PMC free article] [PubMed] [Google Scholar]
- (43).Le Grice SFJ; Cameron CE; Benkovic SJ [13] Purification and Characterization of Human Immunodeficiency Virus Type 1 Reverse Transcriptase. In Methods in Enzymology; DNA Replication; Academic Press, 1995; Vol. 262, pp 130–144. 10.1016/0076-6879(95)62015-X. [DOI] [PubMed] [Google Scholar]
- (44).Zadeh JN; Steenberg CD; Bois JS; Wolfe BR; Pierce MB; Khan AR; Dirks RM; Pierce NA NUPACK: Analysis and Design of Nucleic Acid Systems. J. Comput. Chem 2011, 32 (1), 170–173. 10.1002/jcc.21596. [DOI] [PubMed] [Google Scholar]
- (45).Huber HE; McCoy JM; Seehra JS; Richardson CC Human Immunodeficiency Virus 1 Reverse Transcriptase. Template Binding, Processivity, Strand Displacement Synthesis, and Template Switching. J. Biol. Chem 1989, 264 (8), 4669–4678. [PubMed] [Google Scholar]
- (46).Cai D; Behrmann O; Hufert F; Dame G; Urban G Direct DNA and RNA Detection from Large Volumes of Whole Human Blood. Sci. Rep 2018, 8 (1), 3410 10.1038/s41598-018-21224-0. [DOI] [PMC free article] [PubMed] [Google Scholar]
- (47).Higuchi R Simple and Rapid Preparation of Samples for PCR In PCR Technology: Principles and Applications for DNA Amplification; Erlich HA, Ed.; Palgrave Macmillan UK: London, 1989; pp 31–38. 10.1007/978-1-349-20235-5_4. [DOI] [Google Scholar]
- (48).Yager JL; Coyle RP; Coleman SS; Ellison L; Zheng J-H; Bushman L; Gardner EM; Morrow M; MaWhinney S; Anderson PL; et al. Moderately High Tenofovir Diphosphate in Dried Blood Spots Indicates Drug Resistance in Viremic Persons Living with HIV. J. Int. Assoc. Provid. AIDS Care JIAPAC 2019, 18, 1–5. 10.1177/2325958219888457. [DOI] [PMC free article] [PubMed] [Google Scholar]
- (49).Eholie SP; Moh R; Benalycherif A; Gabillard D; Ello F; Messou E; Zoungrana J; Diallo I; Diallo M; Bado G; et al. Implementation of an Intensive Adherence Intervention in Patients with Second-Line Antiretroviral Therapy Failure in Four West African Countries with Little Access to Genotypic Resistance Testing: A Prospective Cohort Study. Lancet HIV 2019, 6 (11), e750–e759. 10.1016/S2352-3018(19)30228-0. [DOI] [PubMed] [Google Scholar]
- (50).Dorward J; Lessells R; Drain PK; Naidoo K; de Oliveira T; Pillay Y; Abdool Karim SS; Garrett N Dolutegravir for First-Line Antiretroviral Therapy in Low-Income and Middle-Income Countries: Uncertainties and Opportunities for Implementation and Research. Lancet HIV 2018, 5 (7), e400–e404. 10.1016/S2352-3018(18)30093-6. [DOI] [PMC free article] [PubMed] [Google Scholar]
- (51).Shavadia J; Tesfaldet G; Twahir M Antiretroviral Therapy Dose Adjustments Based On Calculated Creatinine Clearance. East Afr. Med. J 2009, 86 (4), 186–189. 10.4314/eamj.v86i4.46950. [DOI] [PubMed] [Google Scholar]
Associated Data
This section collects any data citations, data availability statements, or supplementary materials included in this article.