

Abstract
We describe the use of a microfabricated cell culture substrate, consisting of a uniform array of closely spaced, vertical, elastomeric microposts, to study the effects of substrate rigidity on cell function. Elastomeric micropost substrates are micromolded from silicon masters comprised of microposts of different heights to yield substrates of different rigidities. The tips of the elastomeric microposts are functionalized with extracellular matrix via microcontact printing to promote cell adhesion. These substrates, therefore, present the same topographical cues to adherent cells while varying substrate rigidity only through manipulation of micropost height. This protocol will describe how to fabricate the silicon micropost array masters (2 weeks to complete) and elastomeric substrates (3 days), as well as how to perform cell culture experiments (1-14 days), immunofluorescence imaging (2 days), traction force analysis (2 days), and stem cell differentiation assays (1 day) on these substrates in order to examine the effect of substrate rigidity on stem cell morphology, traction force generation, focal adhesion organization, and differentiation.
Keywords: Stem cells, BioMEMS, traction force, cell mechanics
INTRODUCTION
Mounting evidence suggests that physical signals in the cellular microenvironment, particularly matrix rigidity, can mediate stem cell differentiation 1–8. In early studies, mouse mammary epithelial cells were observed to increase differentiation when grown on soft collagen gels, as opposed to tissue culture plastic 9. Tubulogenesis of human umbilical vein endothelial cells (HUVECs) was also shown to depend on the underlying substrate rigidity 10. Recent studies have directly shown that matrix rigidity may regulate stem cell differentiation 11–16. Human mesenchymal stem cells (hMSCs) grown on polyacrylamide (PAA) gels alter their properties in relation to substrate rigidity 11,12. This landmark work further demonstrated that substrate rigidity defines lineage commitment of hMSCs 12. Similarly, substrate rigidity has recently been shown to regulate neural and skeletal muscle stem cell function including differentiation 13,15. Another recent study also suggests that hMSCs are quiescent when grown on PAA gels with properties similar to bone marrow 17. These cells are arrested in their progression through cell cycle but can be induced to re-enter cell cycle and differentiate when presented with a more rigid substrate.
It remains elusive how mechanical signals in cell microenvironments are transduced into biochemical and cellular functional responses, a process known as mechanotransduction. Mechanotransduction is believed to depend in part on myosin-based cytoskeletal (CSK) tension and the integrin-based transcellular focal adhesions (FAs) that physically tether the CSK to the extracellular matrix (ECM) 6,18–26. Indeed, the CSK structure and tension depend on matrix rigidity 27–32. Fibroblasts grown on stabilized collagen gels generate contractile traction forces within the gels, form stress fibers, and assemble fibronectin into fibrils; however, fibroblasts cultured on freely floating gels do not demonstrate these behaviors 32. In another study, magnetic beads coated with RGD, a peptide sequence that binds integrins, were deposited on cells and magnetically twisted to apply a shear stress to the cell surface. The resultant observation was that cell stiffness increases with bead deformation 30,31. A recent study using optical tweezers further suggests that cells sense ECM rigidity at individual adhesion sites, and that CSK tension at these adhesion contacts responds proportionally to ECM rigidity 21. Together, these studies support the involvement of CSK tension in the mechanotransduction process.
The CSK tension-mediated mechanotransduction process may involve integrin-based FA stress signaling 25,26,33–36. Integrins physically tether the CSK to the ECM, and further cluster to activate biochemical signaling networks by nucleating FA signaling proteins 37–42. Because FAs provide both the mechanical linkage between the CSK and the ECM, and a scaffold for intracellular signaling, it is thought that FAs provide a conduit to sense mechanical stimuli and transduce them into biochemical responses important for regulation of stem cell differentiation 5,7. Indeed, both externally applied and intracellular CSK forces at integrins have been shown to alter FA assembly and downstream FA signaling 27,43–46. Thus, it is plausible that ECM mechanics regulate hMSC differentiation by increasing CSK tension, which is then transduced into biochemical signals through increased FA stress and modified FA signaling.
Accordingly, numerous methods have been developed to examine how forces, both sensed and exerted at FAs, regulate biochemical responses and ultimately, cell function. In particular, deformable substrates with precisely engineered mechanical properties have been used extensively. The first substrates of this kind consisted of ultrathin silicone films, which are compliant to the extent that adherent cells are able to induce wrinkles within the film when they contract 47. However, it is inherently difficult to quantify the traction forces exerted by cells from the wrinkling patterns. Consequently, more advanced techniques to quantify traction forces have been engineered, such as gelatin and PAA gel-based traction force microscopy (TFM), microfabricated horizontal cantilevers and elastomeric substrates 48–53.
Among these approaches, PAA gel-based TFM and microfabricated elastomeric micropost arrays are the two most widely adopted techniques for measuring traction forces. In TFM, fluorescent beads are embedded near the surface of a ligand-functionalized PAA gel that has been pre-stressed against a rigid surface 49,50. Cells cultured on this substrate exert traction stresses that deform the gel principally in the plane of the surface. These deformations are generally orders of magnitudes smaller than the thickness of the gel and can be tracked by observing the displacements of the embedded beads. Consequently, by treating the PAA gel as an incompressible, linearly elastic material of semi-infinite thickness, the traction field F(r) and displacement field u(r) are related by the Fredholm integral equation of the first kind:
| (1) |
where G(r-r’) is the tensorial Green’s function representing the displacement at r caused by the application of a point force at r’. Given u(r), which is measured from the bead displacements, eq. 1 must be inverted to solve for F(r). This is a computationally intensive, ill-posed problem. Moreover, in order to achieve stable unique solutions, regularization schemes must be implemented, such as restricting traction forces to specific sites of adhesion and imposing constraints on the deformation field of the cell 50,54,55 Despite these limitations, TFM has been continually refined with the development of faster solvers such as Fourier-transform traction cytometry and improved methods for computing the displacement field from beads 54,56,57.
Elastomeric micropost arrays represent a drastically different approach to measuring traction forces 53,58 Here, a substrate consisting of arrays of uniformly spaced, vertical, elastomeric posts is fabricated using photolithography and replica molding with the silicone elastomer polydimethylsiloxane (PDMS). After ECM proteins are microcontact printed across the tips of these posts, cells are able to adhere, spread out and exert contractile forces that deflect underlying posts. Each post, therefore, functions as a cantilever. For tip deflections that are small compared to the height of the posts, the posts can be conveniently modeled as linearly elastic beams subjected to pure bending. The force F applied at the tip and the resultant deflection x are described by
| (2) |
where E is the elastic modulus, I is the area moment of inertia, and L is the height of the post. The term contained within the parentheses, referred to as the spring constant, is therefore a measure of the stiffness of the post. Compared to TFM, traction forces are relatively simple to compute with the micropost arrays. The first generation of micropost arrays had relatively wide post-to-post spacing that constrained cell spreading and movement 53. However, this concern has been mitigated with the development of more closely spaced micropost arrays 58–60.
In addition to traction force measurement, deformable substrates are also used to modulate substrate stiffness and thereby affect the traction stresses generated by adherent cells. Gels composed of natural ECMs such as collagen-I, fibrin, Matrigel or synthetic materials such as PAA and polyethylene glycol (PEG) have been created with defined stiffness 28,61. Gels derived from natural ECMs more closely mimic the in vivo-like environment for cells, as they present adhesive ligands in native conformations and may sequester other components such as growth factors 62. However, the bulk mechanical properties of these gels are difficult to control. Changes in stiffness cannot be decoupled from other parameters such as ligand density and fiber thickness 61. Moreover, gels composed of filamentous, semi-flexible biopolymers like collagen and fibrin exhibit non-linear elasticity in that they stiffen when subjected to low strains 63,64. In contrast, gels derived from synthetic materials are chemically inert and must be functionalized with adhesive peptides and proteins using linker chemistry. The advantage is that synthetic gels have well-defined bulk mechanical properties. PAA gels, for example, are linearly elastic over a broad range of strains and have been formulated to exhibit elastic moduli ranging from 2 Pa up to 55 kPa 28,49. Yet, synthetic and natural gels alike are not immune to molecular-scale changes in porosity, wettability, hydration, polymer-chain mobility, and binding properties of immobilized adhesive ligands, that accompany changes in bulk stiffness 65,66. A recent study using synthetic gels for human pluripotent stem cells indicates that these molecular-scale changes can have profound effects on stem cell function67.
Like synthetic and natural gels, elastomeric micropost arrays can also be used to control substrate stiffness. However, as we describe in this protocol, the stiffness of micropost arrays can be controlled independently without affecting bulk or nanoscale mechanics, and adhesive ligand topography. This is achieved by exploiting the fact that the spring constant of a micropost is inversely proportional to the height of the post to the third power. By fixing the micropost cross-sectional area and changing only the height, micropost arrays of varying stiffness can be fabricated 58–60,68,69. The bulk and nanoscale properties of the PDMS remain unchanged as does the amount of ECM functionalized onto the tips of the microposts.
To demonstrate the utility of the elastomeric micropost array as an effective means for both traction force measurement and substrate rigidity modulation, we describe in detail our protocol for studying of the effect of micropost rigidity on stem cell function including differentiation. This protocol, which is presented in a modular manner, will cover the steps required to generate a micropost array substrate with minimum functionality (Fig. 1), as well as a number of optional applications, focusing on traction force imaging and analysis and stem cell differentiation assays. As this protocol accompanies a recent Nature Methods publication by Fu et al., the protocol indicates where the user can bypass steps that require special equipment, by requesting micropost array substrates from our group (www.seas.upenn.edu/~chenlab/micropostform.html) 60. Furthermore, to inform the reader as to the suitability of this protocol for his/her particular system of study, we also discuss the applications of this method, the advantages and disadvantages of this method compared to similar methods as well as technical insights for adapting the protocol for a broad range of applications.
Figure 1 |.
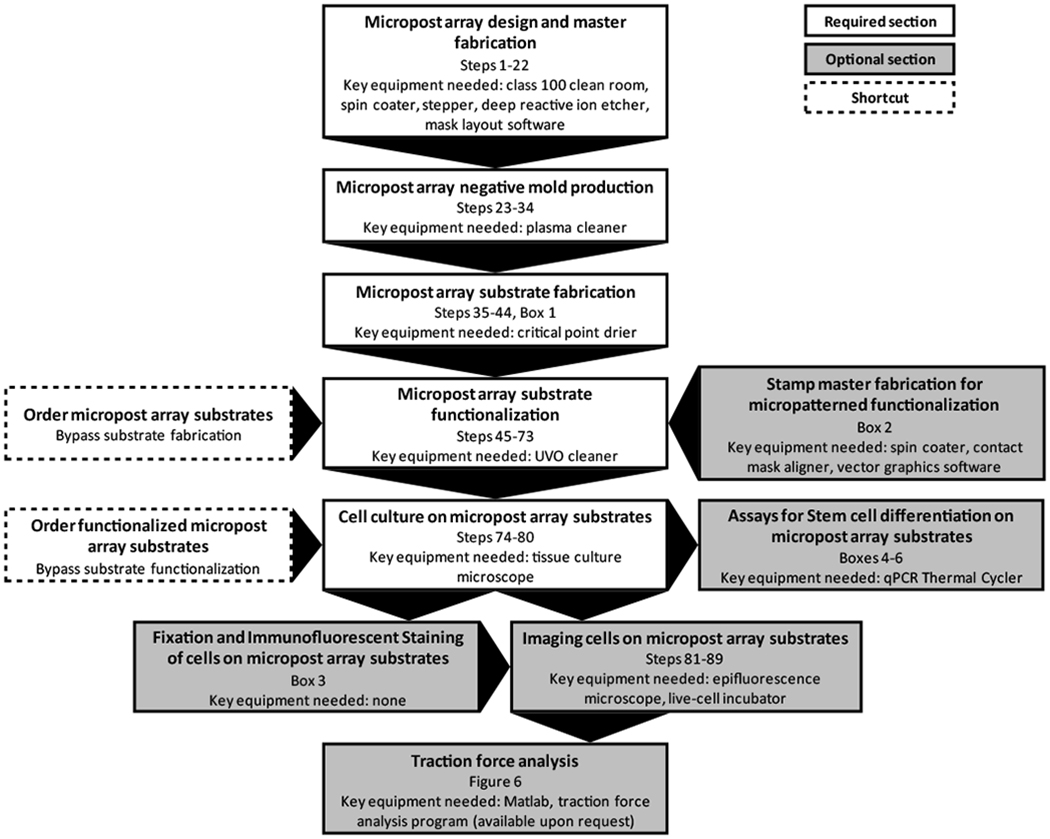
Flow diagram of the different sections of the protocol. The required and optional sections are color-coded white and gray, respectively, with arrows indicating the order in which the sections are performed. Note that some sections require key equipment, such as a plasma cleaner, critical point drier or UVO cleaner, in order to be executed. If these machines are not available, limited quantities of either non-functionalized or functionalized micropost array substrates can be ordered through our online service (www.seas.upenn.edu/~chenlab/micropostform.html). These respective shortcuts are indicated by boxes with dashed borders on the flow chart.
Applications of micropost array substrates
Deformable substrates have traditionally been used to study single cell-substrate interactions such as cell locomotion, traction force generation, focal adhesion dynamics, and cytoskeletal mechanics 50,52,53,70,71. However, the elastomeric micropost arrays have also been used to study a broader range of biological questions, illustrating the versatility of this tool 58,72–82. One notable application has been in the study of multicellular systems. Using an array of cylindrical microposts similar to the ones described in this protocol, du Roure et al. measured the forces generated by migrating sheets of epithelial cells 58. Saez et al. modified the microposts to have an oval cross-section and therefore exhibit stiffer properties along their major axis than along the minor one. On micropost arrays of anisotropic stiffness, epithelial sheets were observed to grow and migrate along the direction of greatest rigidity. 76. In studies where unfettered migration is not desired, multicellular constructs have been constrained on the microposts using patterned microcontact printing. Nelson et al. used this approach to grow a monolayer of endothelial cells on the microposts in the shape of an asymmetric annulus and observed that regions of high tractional stress, such as along the convex, outer boundary of the annular monolayer, correlated with regions of greater proliferation 72. Similarly, Ruiz and Chen found that hMSCs patterned in various multicellular geometries preferentially expressed osteogenic markers in regions of greater stress and adipogenic markers in regions with lower stress 73.
Other studies have used micropost arrays to measure the forces transmitted through cell-cell contacts. The micropost array substrate differs from continuous, deformable substrates in that forces exerted on each post normally are not transmitted to neighboring posts through the substrate. Liu et al. exploited this feature to examine the role of cell-cell tugging force on adherens junction growth 74. To increase the occurrence of two cells forming a single contact, endothelial cells were seeded on bowtie-shaped micropatterns on the microposts, such that only one cell could occupy each half of a bowtie. Paired cells exist in a state of quasi-static equilibrium where the net traction force sums to zero. As such, intercellular tugging force could be calculated from the vector sum of the traction forces exerted by each cell. Using this approach, Liu et al. observed a positive correlation between junction size and tugging force. Ganz et al. examined adherens junction-mediated forces in a different manner by immobilizing an N-cadherin-Fc chimera, which mimicks the adherens junction protein N-cadherin, onto the microposts. C2 myogenic cells grown on these substrates exerted forces on the cadherin contacts that were similar in magnitude to those observed at focal adhesions 79.
A third broad application of the microposts has been in the development of models of biological processes. Two similar but distinct approaches have been developed to study the mechanics of leukocyte transmigration through an endothelial monolayer. Rabodzey et al. cultured an unpatterned monolayer of endothelial cells on microposts, subjected these cells to laminar shear flow in a parallel plate flow chamber and observed the effects of neutrophil adhesion and transmigration on traction forces generated within the monolayer 77. Liu et al. patterned “mini” monolayers of 5-10 endothelial cells and titrated the monocyte concentration to isolate the effects of individual monocytes on each monolayer 78. Both studies observed that firm adhesion and transmigration of leukocytes triggered increases in endothelial traction force that were greatest at the site of leukocyte attachment. In yet another unique implementation, micropost arrays have been used to examine the mechanics of platelet-mediated clotting, or thrombus formation. Single platelets are too small to culture on micron-scale microposts. Instead, Liang et al. formed micro-thrombi, comprised of many platelets, on top of the microposts and were able to obtain dynamic measurements of the clotting force as a function of thrombin activity80.
Aside from its applications for passively reporting traction force, the micropost array substrate has been integrated with actuation technologies as a means to both apply forces to cells and measure responses of traction forces. Studies have shown that application of tangential forces at integrin-mediated adhesions leads to reinforcement of the cytoskeletal-ECM linkages 27,43. Motivated by this finding, Sniadecki et al. engineered micropost array substrates in which magnetic nanowires were embedded in a sparse number of microposts 75. These select microposts can then be actuated under a uniform magnetic field to impart nanonewton forces to individual adhesions of adherent cells. The surrounding passive microposts are able to report changes in global traction force induced by local force application. Interestingly, Sniadecki et al. observed enhanced focal adhesion assembly only at the site of force application and found that local forces could induce long-range relaxation of traction forces.
The most insightful studies with micropost array substrates have taken advantage of the ability to do paired analyses of the traction forces with a functional output such as proliferation or adherens junction assembly. Fu et al. have taken this approach a step farther by showing that the early contractile state of single hMSCs that have been exposed to differentiation media, can predict later onset of their differentiation 60. Here, individual cells were constrained to micropatterns on the micropost arrays and monitored daily for changes in their traction forces. After one week, the cells were stained for differentiation markers. Subsequently, Bayesian classifier analysis was used to determine whether the traction forces measured on different days could predict the differentiation outcome for each cell.
Advantages and disadvantages of micropost array substrates
The existing applications of micropost array substrates highlight a number of advantages and disadvantages for adapting this tool for new applications. One positive attribute of the micropost arrays is that they have been used to study diverse types of cells, such as epithelial cells, endothelial cells, fibroblasts, leukocytes and mesenchymal stem cells in well-defined adhesive and mechanical contexts. In addition to mesenchymal stem cells, it is likely that other mechanosensitive stem cell types, such as hematopoietic, skeletal muscle, and embryonic stem cells, can also be studied on the micropost arrays 15,83–86. Moreover, the ability to microcontact print defined patterns of different types of proteins on the micropost arrays provides a level of control over the adhesive topography that is difficult to achieve on gel-based substrates. Another advantage of the micropost arrays is that they are very amenable for paired analyses of traction forces and a second functional output that is not directly linked to traction force. Whereas cells cultured on PAA gels must be detached in order to measure their traction forces, cells cultured on micropost arrays do not and can be fixed and stained for cellular components such as differentiation markers or cytoskeletal and adhesion proteins.
Despite all of their advantages, the micropost array substrates cannot completely replace other approaches for measuring traction forces or modulating substrate rigidity. One potential limitation is generating ultra-compliant micropost arrays that are equivalent to the softest PAA gels. Neural differentiation, for example, has been observed on PAA gels with elastic moduli ranging from 0.1-1 kPa 12. In comparison, the softest microposts that have been used to study stem cell differentiation have an equivalent stiffness of 1.5 kPa 60. It is possible to generate ultra-compliant microposts, either by fabricating taller microposts or using a lower ratio of crosslinking agent to PDMS prepolymer to cast substrates. However, there are significant technical issues such as preventing very soft microposts from sticking to each other during substrate fabrication and functionalization. As such, PAA gels are currently better suited than micropost arrays for culturing cells on ultra-compliant substrates.
The discrete topography of the microposts can be either an advantage or disadvantage depending on the application. In the studies of cell-cell tugging force, localized force actuation and transmigration, the discrete topography is beneficial in that it either prevented transmission of forces through the substrate or provided space for cells to move vertically 74,75,77,78. However, if the goal is to understand how cells mechanically interact with each other through the substrate or respond to global substrate deformations, then continuous deformable substrates may be more suitable than micropost arrays 87,88. The discrete topography of the micropost array raises another potential issue in that altering post density and adhesive area can influence the distribution of cellular adhesions, which can possibly affect cellular behavior59,68. Therefore, it is paramount to utilize knowledge of how the cell types of interest adhere and spread in tissue culture when designing the geometric parameters of a micropost array.
Experimental Design
Special equipment needs for fabricating micropost array masters.
This protocol describes the fabrication of silicon micropost array masters with a micropost diameter of approximately 2 μm and center-to-center spacing of 4 μm. In order to fabricate features with these dimensions, one must first have access to an advanced microfabrication facility such as the Massachusetts Institute of Technology (MIT) Microsystems Technology Laboratory or Cornell Nanofabrication Facility. There are two special pieces of equipment at these facilities that are required to achieve high-density micropost arrays. The first is a lithographic stepper to pattern the photoresist that will define the post diameter and spacing in the micropost array. The stepper patterns photoresist by projecting ultraviolet (UV) light through a reticle photomask and reduction lens onto the wafer. The reduction lens focuses the collimated light on a region of the wafer smaller than the reticle, such that the features on the reticle are scaled down. This not only allows the stepper to pattern features in the photoresist as small as 500 nm, but is also economically advantageous as photomasks with increasingly smaller features become prohibitively expensive. The second piece of equipment is a deep reactive ion etcher (DRIE) that can etch silicon microstructures with very high aspect ratios. It accomplishes this feat by iteratively passivating and etching the wafer, also known as the Bosch process 89. During the passivation step, the wafer is uniformly coated with C4F8, a chemically inert Teflon-like polymer. This polymer is then removed by a nearly isotropic plasma etch containing SF6 ions. Rapid cycling between the two steps minimizes lateral etching resulting in a very directional etch. Previously, the Bosch process has been used to fabricate arrays of holes in silicon that can be used to cast PDMS microposts 58. Here, we use the same process to fabricate the inverse structure consisting of arrays of silicon microposts (Fig. 2a). This subtle but significant difference confers technical advantages in replica micromolding of the PDMS micropost substrates, which will be elaborated upon below.
Figure 2 |.
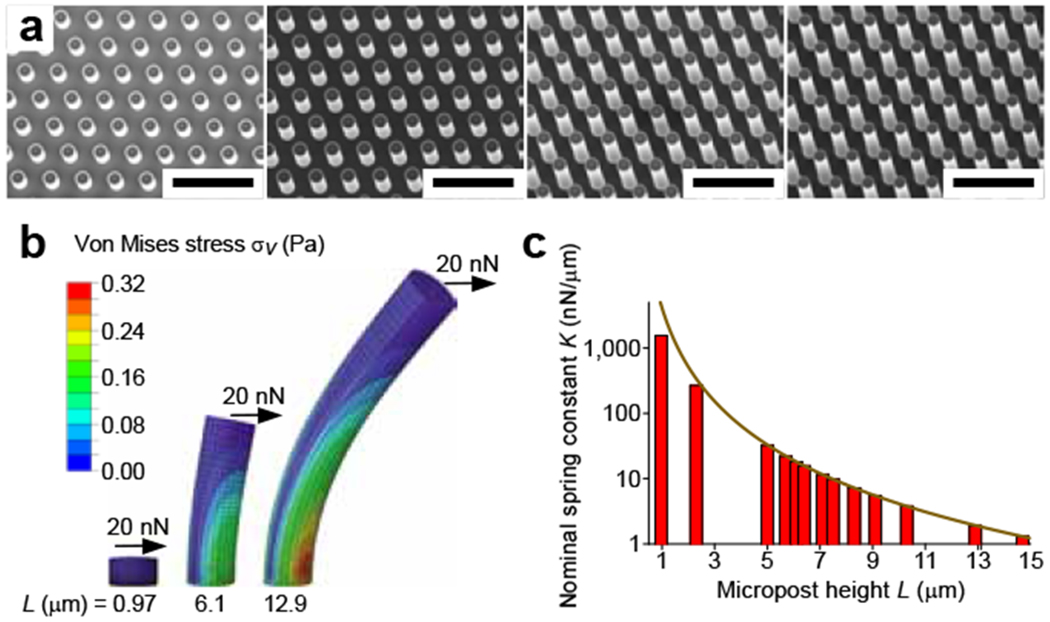
Characterization of micropost array masters and substrates, (a) Scanning electron micrographs of silicon micropost array masters of four different heights. From left to right, the heights of the microposts are 2.3, 5, 8.3 and 12.9 μm. The scale bar is 20 μm. (b) Finite element model (FEM) simulations of the deflection of PDMS microposts in response to an applied force at the tip. (c) The nominal spring constant (K), as computed from FEM analysis (bars) and Eq. 2 (curve), is plotted for PDMS microposts of different heights L. Reprinted with permission 60.
If access to an advanced microfabrication facility is not practical, micropost array masters with larger micropost diameters and spacings can be fabricated with more basic microfabrication equipment. A detailed protocol for such approaches is described elsewhere 90. Briefly, a master is generated by spin coating a layer of SU-8 photoresist, approximately 7 to 12 μm thick, on silicon wafer, and then exposing the photoresist to UV light through a photomask on a contact mask aligner. Development of the unexposed photoresist will then leave behind an array of SU-8 photoresist microposts that can be used for replica molding of the PDMS micropost array substrates. This approach obviates the need for a stepper and DRIE machine. However, the theoretical resolution R of the contact photolithography is
| (3) |
where λ is the wavelength of light and z is the photoresist thickness 91. SU-8 maximally absorbs UV light with a wavelength of 365 nm. Thus, to fabricate microposts with a diameter of 2 μm, the thickness of SU-8 photoresist cannot exceed 9.7 μm. Such posts are shorter than several of the taller silicon micropost array masters that we have generated. Moreover, the theoretical resolution is rarely achieved due to defects such as uneven photoresist coating and mask damage.
Design considerations for fabrication of reticle photomask and silicon micropost arrays.
The critical parameters to consider when designing the reticle photomask for patterning the micropost array master are the center-to-center spacing and diameter of the microposts. These two parameters are interdependent and should be optimized for the cell types of interest. For example, closely spaced arrays with a center-to-center spacing of 2 μm are well-suited to measure forces in small cells such as epithelial cells 58. An even smaller spacing in the submicron range may be necessary for smaller cellular bodies such as platelets 80. We have found that, below a center-to-center spacing of 4 μm, there is no noticeable difference in the spread area or morphology of intermediate-to-large-sized cells such as mesenchymal stem cells, fibroblasts and endothelial cells when compared to cells on continuous substrates 59,60. However, spacings ranging from 6 to 9 μm adversely affect the ability of cells to spread and migrate on micropost arrays as they would on continuous substrates 92. Once the post spacing has been chosen, a suitable post diameter must be used such that adjacent posts do not stick to each other. We and others have observed that using a post diameter that is equal to half the center-to-center spacing provides excellent spatial resolution while mitigating excessive post collisions and stiction 60,92,93. Posts with a diameter larger than half the center-to-center spacing can still be used to measure traction forces. However, the sensitivity of the measurement will be lower due to the smaller distances over which adjacent posts can deflect before they collide. Decreasing the post diameter too much may also produce problems with measurement sensitivity. We found that for post diameters ranging from 0.67-0.83 μm, cells exerted constant strain energies on micropost arrays of different post densities, such that post deflections were almost indistinguishable from noise at the highest post densities 59. Thus, for practical purposes, it is recommended that a post diameter of at least 1 μm be used, which will yield an adhesive area per post that is at the lower bound of the focal adhesion areas reported in literature 18. Taking these variables into consideration, the reticle photomask that we use in this protocol is designed to pattern micropost arrays with a center-to-center spacing of 4 μm and a micropost diameter of 2 μm.
In addition to optimizing the micropost array geometry, a number of other issues must be addressed in the design of the reticle photomask. First, to facilitate microcontact printing of fibronectin onto the micropost arrays, large flat structures should be placed around the arrays to serve as weight-bearing structures that prevent the stamp from collapsing the microposts. In our design, we divided the micropost array into four 2 x 2 mm quadrants, separated by rectangular flat structures. Second, the lithographic stepper used in this protocol is equipped with a 5x reduction lens. Therefore, the scale of the array of micropost circles in our reticle photomask is five times larger than it would be on the photoresist. This will be different for a stepper with a different reduction lens. Lastly, the micropost masters described in this protocol are comprised of cylindrical pillars as opposed to cylindrical pits that have also been used elsewhere 58,76. There are two main advantages to using cylindrical pillars. First, negative replica molds can be cast from pillar-based silicon masters in batches and then used repeatedly to generate large numbers of PDMS micropost array substrates. This minimizes the frequency of casting from the silicon masters, which are difficult to replace if damaged during handling. Second, PDMS micropost substrates are cast on a rigid backing such as a glass coverslip or slide. If pit-based masters are used, the glass coverslip would have to be pressed against the rigid silicon master during curing. Peeling a rigid substrate away from a rigid master is difficult and can cause one or both devices to break. Since positive tone photoresist is used to pattern the pillar arrays in this protocol, the reticle photomask should be negative with the circle patterns opaque and the surrounding area transparent. The reticle photomask is designed with mask layout software such as L-Edit Pro or AutoCAD and must be outsourced to a commercial mask-writing company for production.
During the actual fabrication of the silicon micropost array masters, photolithographic patterning of the micropost array and subsequent DRIE etching of the silicon are the key steps that must be optimized. This process will likely involve frequent inspection of the silicon masters at each stage of the process flow with an optical microscope and a scanning electron microscope. For the photolithography step, UV exposure conditions must be optimized with test exposures to ensure that the patterned photoresist features reproduce the reticle mask features with high fidelity. Moreover, the photoresist should be at least 1 μm thick to provide a sufficient protective layer against the DRIE plasma, which etches photoresist about 100 times more slowly than silicon. For the DRIE step, standard recipes have been developed that use an inductively coupled plasma source to create plasmas with high electron density, low pressure and low energy. Although these plasmas can result in high etch rates and directional etching, some lateral etching still occurs which may lead to microposts with smaller diameters than expected. As such, the aspect ratio of micropost height to diameter is limited by the DRIE process to be less than about 20. In our masters, the expected micropost diameter was 2 μm, but the actual micropost diameter was 1.83 μm. Although this was within our tolerances, if the discrepancy between the expected and actual micropost diameter is too large, then different parameters in the photolithography and DRIE steps will have to be optimized.
Characterization of mechanical properties of micropost array substrates.
Prior to using elastomeric micropost array substrates for experiments, the mechanical properties of the microposts should be rigorously characterized. Eq. 2 provides a good approximation of the spring constants of microposts for small post deflections. However, for larger deflections, which are normally observed with microposts that have aspect ratios greater than 5, the linear approximation of eq. 2 is not valid. Moreover, for short microposts with aspect ratios less than 1.5, eq. 2 is also not an accurate approximation due to a significant shearing component in the post deformation 94. One way to validate the spring constant approximations from Eq. 2 is to use a micromanipulator to push a calibrated glass micropipette tip against the tip of a micropost53,95. Because the spring constant of the micropipette tip is known and the deflections of the micropipette tip and micropost can be measured, the spring constant of the micropost can be calculated. This method has previously been used to determine the spring constant of microposts with a diameter and height of 3 μm and 10 μm, respectively 53,95. However, for microposts with smaller diameters and microposts with large aspect ratios, calibration with micropipettes becomes increasingly difficult for a couple of reasons. First, the glass micropipettes generally have tip diameters greater than 0.5 μm and would be difficult to position near the tips of smaller microposts. Second, tall microposts may be hard to calibrate as they will not present a sufficient reactive force to deflect the much stiffer micropipette tip.
Therefore, to more accurately determine the spring constant of the PDMS micropost, we have used a finite element modeling (FEM) package such as ABAQUS (Simulia, Dassault Systemes) (Fig. 2b–c). We modeled the micropost as a neohookian hyperelastic cylinder comprised of hexahedral mesh elements. The diameter and range of heights for the micropost were measured from scanning electron microscopy (SEM) and surface profilometry. PDMS is known to change its mechanical properties over time depending on the curing time and temperature that are used 96. Therefore, to determine the Young’s modulus of the micropost, we cured strips of PDMS at 65°C and 110°C for different lengths of time and then stretched the strips on a tension tester such as the 5848 MicroTester (Instron). These tests subsequently showed that the Young’s modulus stabilizes at a value of 2.5 ± 0.5 MPa for PDMS that has been cured at 110°C for 20 hr. To simulate bending of the micropost, we specified fixed boundary conditions for the base of the micropost and applied a range of traction shear loads across the top of the post. Post displacement was measured at the center node on the top surface, and then plotted against the applied force. The nominal spring constant K can then be determined by computing the slope of the force-displacement curve as the displacement approaches zero. Our FEM simulations assume that the microposts are fixed against a rigid substrate when in fact they are attached to a thin elastic PDMS layer. As such, K will have to be adjusted to account for substrate warping. Correction factors for this adjustment have recently been determined for a wide range of micropost aspect ratios 94.
Fabrication considerations for a micropatterned stamp master.
To micropattern islands of fibronectin on the micropost array substrate, a microstructured PDMS stamp consisting of raised and recessed regions is used. This stamp is cast against a micropatterned photoresist-coated wafer that is itself produced using conventional photolithography 97. Compared to the micropost array masters, a micropatterned stamp wafer is much simpler to fabricate. The spread areas of single cells generally range between 100-10000 μm2. As such, the smallest islands of fibronectin that normally would be micropatterned have a minimum feature dimension of 10 μm. Photoresist features of this size are readily patterned with a contact mask aligner. Moreover, photolithography can be performed with a transparency photomask that can be designed with vector graphics software such as Adobe Illustrator and obtained through low-cost, high-resolution photoplotting services. The main challenge with micropatterning is to make sure that the microstructured stamp does not collapse under its own weight and thereby transfer fibronectin beyond the micropatterns. Microstructured stamps can collapse if the raised regions buckle or if the recessed regions collapse, also known as roof collapse. Generally, buckling is not a concern as the aspect ratio of the raised regions will be less than 0.5 97. Theoretical and experimental studies on stamp deformation have suggested that roof collapse can be avoided if the ratio of the height of the raised regions to the width of the recessed regions is at least 0.3 98. To illustrate an example, if the raised regions are 100 μm x 100 μm squares, the height of the raised regions should be less than 50 μm. If the height is 30 μm, adjacent raised squares must be spaced no more than 100 μm apart. If the height is 15 μm, adjacent squares must be no more than 50 μm apart. Therefore the spacing of raised features should dictate the viscosity of the photoresist used to pattern the stamp master. More viscous photoresists such as SU-8 2025 are suitable for stamps with more widely spaced patterns while thinner resists such as SU-8 2010 are ideal for more closely packed patterns.
Alternative strategies for substrate functionalization.
Fluorescent labeling of microposts for traction force analysis can be tailored for different studies. Specifically, other molecules with similar structure to Dil but different fluorescent spectra can be used to label the microposts. DiD, for example, fluoresces in the far-red, or Cy5, channel. This is particularly useful if the Cy3 channel, which is used for Dil, must be used for another purpose such as fluorescently labeling cellular structures. Moreover, labeling with DiD is also helpful if the Cy2 channel will be used to image an experimentally important signal, such as a GFP-fused protein. The reason for this is that Dil can be weakly detected in the Cy2 channel, known as bleed-through. For both Dil and DiD, it is important to optimize the labeling concentration to ensure sufficient signal-to-noise while minimizing any undesirable bleed-through. Alternatively, lipophilic dyes can be omitted entirely by using fluorophore-conjugated proteins. Fluorescently-labeled fibronectin can be mixed with non-labeled fibronectin and microcontact printed to label only the tips of the microposts 58,76. Another post labeling method is to adsorb Alexa Fluor 594-conjugated bovine serum albumin (BSA) to the shafts and base of the microposts 82. The main reason to use this strategy is if the cell type of interest takes up Dil in significant amounts thereby presenting severe artifacts for traction force analysis. If this strategy is used, a concentration of 20 μg/mL BSA-Alexa Fluor 594 is recommended as a starting point. Further optimization of the labeling concentration is necessary as BSA-Alexa Fluor 594 may hinder the adsorption of F127 Pluronics and thereby allow cells to crawl down the posts.
Fibronectin is not the only type of protein that can be printed on the microposts. Other ECM proteins such as collagen and vitronectin can be used as well. Adsorption conditions and protein concentrations will have to be optimized empirically for different proteins. For example, collagen must be adsorbed to a stamp in a 0.1% v/v acetic acid solution to ensure that the collagen fibrils do not precipitate. Another important consideration is that some proteins may not be printable as doing so would destroy their biological activity. For these situations, a potential solution would be to covalently link the protein of interest to a linker protein such as an antibody fragment or biotin. The protein could then be “printed” on the microposts by first printing a binding partner of the linker protein, such as protein G or avidin, and then immersing the substrate in a solution with the protein of interest.
Microcontact printing adhesive proteins and subsequent treatment with Pluronic to block non-specific protein adsorption to the shafts of the microposts ensures that cells are only able to adhere to the tips of the microposts and not crawl in between. The UVO cleaner is critical for this process as it can temporarily hydrophilize a PDMS micropost substrate. Adhesive proteins that are adsorbed onto a PDMS stamp can then be transferred onto a relatively hydrophilic micropost substrate 99,100. Moreover, the surface of UVO-treated PDMS is reversibly modified unlike the surface of plasma-treated PDMS which is glass-like and much more hydrophilic 101. The mild hydrophilicity of UVO-treated PDMS therefore permits Pluronic, which has a hydrophobic polymer backbone, to adsorb to the surface. If a UVO cleaner is not available and preventing cell invasion into the micropost array is not critical, fibronectin may be adsorbed over the entire surface by immersing the substrate in the fibronectin solution 58,69.
Cell seeding strategies on the micropost array substrates.
Seeding cells on the micropost array substrates is an empirical process in which the main parameters that need to be optimized are seeding density and seeding time. These parameters are dependent on the cell type. Different cell types adhere to fibronectin with differential efficiency. For example, hMSCs and HUVECs attach within 10-15 min of seeding, while epithelial cells can take upwards of 1 h. Different cell types also have different final spread areas. hMSCs are 2 to 3 times larger than HUVECs, and both cell types are significantly larger than epithelial cells or immune cells. Therefore, if a significant number of isolated cells on the substrate is desired, hMSCs should be seeded at a lower density of around 1500 cells/cm2 while HUVECs seeded at around 5000 to 10000 cells/cm2. Note that these seeding densities are significantly higher than the desired density on the substrate. The rationale is that it is better to seed at a high density and wash off excess floaters after a short incubation time than it is to seed at a low density and allow the majority of cells to slowly attach without washing. This minimizes the time that adherent cells spend in suspension. For micropatterned micropost array substrates, these parameters may be different as the cells will require more incubation time to land on a smaller adhesive surface. In our experience, seeding density can be left unchanged while seeding time extended to 3 hours or even overnight, to obtain a good percentage of cells adherent to micropatterns on the micropost arrays.
MATERIALS
Reagents
30% v/v Hydrogen peroxide (Cat. No. 216763, Sigma-Aldrich, St. Louis, MO; www.sigmaaldrich.com) ! CAUTION Oxidizer and corrosive. Wear goggles, gloves and laboratory coat when handling.
95% v/v Sulfuric acid (Cat. No. 320501, Sigma-Aldrich) ! CAUTION Corrosive. Wear goggles, gloves and laboratory coat when handling.
Deionized water
Hexamethyldisilazane (HMDS, Cat. No. H4875, Sigma-Aldrich) ! CAUTION Inflammable. Avoid prolonged exposure or inhalation. Wear goggles, gloves and protective clothing and handle in a properly ventilated chemical hood.
Megaposit SPR 700-1.0 photoresist (Cat. No. is product name, Microchem, Newton, MA; www.microchem.com) ! CAUTION Inflammable. Avoid prolonged exposure or inhalation. Wear goggles, gloves and protective clothing and handle in a properly ventilated chemical hood.
MF CD 26 developer solution (Cat. No. is product name, Microchem) ! CAUTION Corrosive and irritant. Wear goggles, gloves and protective clothing when handling.
Shipley AZ4620 photoresist (Cat. No. is product name, Microchem) ! CAUTION Inflammable. Avoid prolonged exposure or inhalation. Wear goggles, gloves and protective clothing and handle in a properly ventilated chemical hood.
Acetone (Cat. No. A18-4, Fisher Scientific; www.fishersci.com) ! CAUTION Irritant and inflammable.
Isopropanol (Cat. No. A416-4, Fisher Scientific)
Araldite 2012 epoxy (Cat. No. 056452, Freeman Supply, Avon, OH)
SU-8 2002/2010/2025 photoresist (Cat. No. is product name, Microchem) ! CAUTION Inflammable. Avoid prolonged exposure or inhalation. Wear goggles, gloves and protective clothing and handle in a properly ventilated chemical hood.
Norland 68 optical adhesive (Cat. No. NOA 68, Norland Products, Cranbury, NJ; www.norlandprod.com)
(tridecafluoro-1,1,2,2-tetrahydrooctyl)-1-trichlorosilane (Part No. T2492, United Chemical Technologies, Horsham, PA; www.unitedchem.com) ! CAUTION Corrosive and toxic. Wear gloves, goggles and handle in a properly ventilated chemical hood.
Sylgard 184 Polydimethylsiloxane (PDMS; Dow Corning, Midland, MI; Supplier: Cat. No. 2065622, K.R. Anderson, Inc.; www.kranderson.com)
Ethanol, 200 proof (Cat. No. 04-355-222, Fisher Scientific)
Propylene glycol monomethyl ether acetate (Cat. No. 484431, Sigma-Aldrich) ! CAUTION Inflammable. Avoid prolonged exposure or inhalation. Wear goggles, gloves and protective clothing and handle in a properly ventilated chemical hood.
Fibronectin (Cat. No. 356008, BD Biosciences, San Jose, CA; www.bdbiosciences.com)
Dil (chemical name: 1,1’dioleyl-3,3,3’,3’-tetramethylindocarbocyanine methane-sulfonate) (Cat. No. D-3886, Invitrogen, Carlsbad, CA; www.invitrogen.com)
F127 Pluronic (Cat. No. P2443, Sigma-Aldrich)
Phosphate-buffered saline (PBS, Cat. No. 10010-023, Invitrogen)
Mammalian cells (e.g., human bone marrow-derived mesenchymal stem cells, Cat. No. PT-2501, Lonza, Walkersville, MD; www.lonza.com)
Cell culture media (for hMSCs: Dulbecco’s Modified Eagle’s Medium, low glucose, Cat. No. 11885-092, Invitrogen; Fetal bovine serum, qualified, Cat. No. 10437-028, Invitrogen; L-Glutamine, Cat. No. 25030-081, Invitrogen)
Trypsin (0.05%)-EDTA (2 mM) (Cat. No. 25300-054, Invitrogen)
16% Paraformaldehyde (Cat. No. 15710, Electron Microscopy Sciences, Hatfield, PA; www.emsdiasum.com) ! CAUTION Irritant to eye and skin. Wear goggles and gloves when handling.
Triton X-100 (Cat. No. X100, Sigma-Aldrich)
Goat serum (Cat. No. 16210072, Invitrogen)
Bovine serum albumin (Cat. No. A4503, Sigma-Aldrich)
Primary antibodies (e.g., anti-vinculin, Cat. No. V9131, Sigma-Aldrich; anti-FAK(pY397), Cat. No. 611722, BD Biosciences)
Secondary antibodies (e.g., Alexa Fluor 488 goat anti-mouse IgG (H+L), Cat. No. A-11001, Invitrogen)
DAPI (Cat. No. D3571, Invitrogen)
Alexa Fluor 488-conjugated Phalloidin (Cat. No. A12379, Invitrogen)
Fluoromount G (Cat. No. 17984-25, Electron Microscopy Sciences)
Nuclease-free water (AM9938, Ambion, Austin, TX; www.ambion.com)
Qiagen RNeasy Micro Kit (Cat. No. 74004, Qiagen, Valencia, CA; www.qiagen.com)
2-mercaptoethanol (Cat. No. 4049-00, Mallinckrodt Baker, Phillipsburg, NJ; www.mallbaker.com) ! CAUTION Irritant and inflammable. Wear goggles, gloves and handle in a properly ventilated chemical hood.
dNTP mixture (dATP, dTTP, dCTP,dGTP, 10 mM each, Cat. No. 18427013, Invitrogen)
Oligo dT12-18 primer (Cat. No. 18418012, Invitrogen)
RNaseOUT™ ribonuclease inhibitor (Cat. No. 10777019, Invitrogen)
MMLV reverse transcriptase (Cat. No. AM2043, Invitrogen)
qPCR Taqman probes (Alkaline phosphatase, Hs00758162_m1; collagen type I, Hs 00164004; GAPDH, Hs 99999905_m1; FrzB, Hs00173503_m1; IBSP, Hs00173720; lipoprotein lipase, Hs00173425_m1; PPARG1/2, Hs00234592_m1; Runx2, Hs00231692_m1; Applied Biosystems, Carlsbad, CA; www.appliedbiosystems.com)
TaqMan universal PCRmaster mixture (Cat. No. 4304437, Applied Biosystems)
Oil Red O (Cat. No. 00625, Sigma-Aldrich)! CAUTION Avoid inhalation of dust and eye contact.
10% formalin (Cat. No. HT501128, Sigma-Aldrich)
Fast blue RR salt (Cat. No. FBS-25, Sigma-Aldrich)
Naphthol AS-MX phosphate alkaline solution (Cat No. 85-5, Sigma-Aldrich)
Citrate concentrated solution (Cat No. 85-4C, Sigma-Aldrich)
Equipment
L-Edit Pro (Tanner EDA, Monrovia, CA; www.tannereda.com) layout/verification software for reticle photomask design. Alternatively, AutoCAD (Autodesk, San Rafael, CA; usa.autodesk.com) can be used. Adobe Illustrator (Adobe, San Jose, CA; www.adobe.com) should be used for transparency photomasks.
High-resolution chrome mask (Advance Reproductions, North Andover, MA; www.advancerepro.com; or Microtronics Inc., Newtown, PA; www.microtronicsinc.com)
Silicon wafers (N-type, <1-0-0> orientation, Ph-doped; Silicon Quest International, Santa Clara, CA; www.siliconquest.com). Generally, steppers handle 4 or 6” wafers while contact mask aligners handle 3 or 4” wafers.
Wet processing station (with Piranha solution tank and wafer dump rinser) (Model WPS-400 & 800, Semifab Inc., San Jose, CA; www.semifab.com)
Wafer spin dryer (Marteq Process Solutions, Inc., Irvine, CA; www.verteq.com)
Two contact hotplates
Vacuum Desiccators (Cat. No. EW-06514-30 or equivalent, Cole-Parmer, Vernon Hills, IL; www.coleparmer.com)
Automated photoresist coat and develop system (SSI 150 Dual Track Spinner System, Semiconductor Systems Inc.)
Projection stepper (Nikon NSR-2005i9, Nikon Precision Inc., CA; www.nikonprecision.com)
Metallurgical microscope (ME600 or equivalent, Nikon Instruments Inc., Melville, NY; www.nikoninstruments.com)
Surface profilometer (KLA-Tencor-Prometrix P10, KLA-Tencor Corp., CA; www.kla-tencor.com)
Deep reactive-ion etcher (ICP Deep Trench Etching Systems, Surface Technology Systems pic, UK; www.stsystems.com)
Scanning electron microscope (SEM, Zeiss SUPRA 40 High Throughput FESEM, Carl Zeiss NTS GmbH; www.smt.zeiss.com/nts)
Wafer die saw (Disco Abrasive System DAD-2H/6T, Disco Abrasive Systems K.K., Japan; www.disco.co.jp/das/eg/cp/index.html)
Tweezers (Electron Microscopy Sciences): wafer tweezers, flat narrow tweezers and fine-tipped curved tweezers are recommended.
Pyrex crystallizing dishes (Sigma-Aldrich)
Compressed N2 gas (Airgas, Salem, NH; www.airgas.com)
Microscope glass slides (Fisher Scientific)
UV curing chamber (Electro-Cure 500, Electro-Lite Corporation, Bethel, CT; www.electro-lite.com)
Glass Pasteur pipettes (Cat. No. 136786A, Fisher Scientific)
Plastic transfer pipettes (Cat. No. 137117M, Fisher Scientific)
Toploading balance (Model no. TR-402 or equivalent, Denver Instrument, Bohemia, NY; www.denverinstrument.com)
43 mm diameter aluminum weighing dish (Cat. No. HS14521A, Heathrow Scientific, Vernon Hills, IL; www.heathrowscientific.com)
Two Laboratory ovens (Isotemp or equivalent, Fisher Scientific)
Razor blades
Plasma cleaner (Plasma Prep II, SPI Supplies, West Chester, PA; www.2spi.com)
Analytical balance (Model no. AG245 or equivalent, Mettler Toledo, Columbus, OH; us.mt.com)
Borosilicate coverglass (No. 1 thickness, various dimensions, Fisher Scientific)
Glass plate (McMaster-Carr, Robbinsville, NJ; www.mcmaster.com)
Ultrasonic pen cleaner
Bone-dry liquid CO2 (with siphon in tank, Airgas)
Critical point drier (PVT-3D, Tousimis, Rockville, MD; www.tousimis.com)
Spin coater (WS-400-NPP-Lite or equivalent, Laurell Technologies Corporation, North Wales, PA; www.laurell.com)
Transparency mask (CAD/Art Services, Inc., Bandon, OR; www.outputcity.com)
Contact mask aligner (Karl Suss MJB3 or equivalent, Suss MicroTec, Garching, Germany; www.suss.com)
UV filter glass (U-360, Hoya Corporation, Santa Clara, CA; www.hoyaoptics.com)
TexWipes (Cat. No. TX312, ITW Texwipe, Kernersville, NC; www.texwipe.com)
110 mm diameter aluminum weighing dish (Cat. No. 08-732-108, Fisher Scientific)
35 mm MatTek Petri dishes with 20 mm holes (Part No. P35-20-C-NON, MatTek Corporation, Ashland, MA; www.glass-bottom-dishes.com)
Mini Alpha polyester swabs (Cat. No. TX754B, ITW Texwipe)
Re-usable Attofluor live-cell chamber (Cat. No. A7816, Invitrogen)
UVO cleaner (UVO-Cleaner Model No. 342, Jelight, Irvine, CA; www.jelight.com)
Tissue culture supplies (e.g., micropipette tips, serological pipettes, tissue culture flasks, conical tubes, Fisher Scientific)
100 or 150 mm Petri dishes (Fisher Scientific)
Hemocytometer
Biological hood
Tissue culture incubator
Benchtop centrifuge (Thermo Scientific CL2 model or equivalent)
Compressed CO2 gas (Airgas)
Tissue culture microscope (TMS or equivalent, Nikon Instruments Inc.)
Advanced fluorescence microscope (Zeiss Axiovert 200M, Nikon Eclipse Ti or equivalent)
Cage or stage-top live-cell incubator
Parafilm (Fisher Scientific)
Microcentrifuge (Eppendorf 5418 model or equivalent)
Optically clear adhesive seal sheets (Cat. No. AB-1170, ThermoScientific, Rockford, IL; www.thermoscientific.com)
96-well PCR plates (Cat. No. T-3085-1, BioExpress, Kaysville, UT; www.bioexpress.com)
Thermocycler (MasterCycler Gradient, Eppendorf, Hauppauge, NY; www.eppendorfna.com)
Real-time PCR System (ABI 7300, Applied Biosystems)
Reagent Setup
Piranha solution: Combine 1 part 30% v/v hydrogen peroxide and 3 parts 95% v/v sulfuric acid in a Pyrex crystallizing dish or beaker. The solution should be prepared immediately before use.
70% v/v ethanol: Mix 35 mL ethanol with 15 mL deionized water. The solution can be stored indefinitely at room temperature.
50 μg/mL Dil stock solution: Dissolve 25 mg of Dil paste in 500 mL ethanol. Filter sterilize the solution to remove large Dil crystals. The solution should be protected from light and can be stored indefinitely at 4°C.
2% w/v F127 Pluronic stock solution: Dissolve 2 g F127 Pluronic flakes in 100 mL PBS. Filter sterilize the solution. The solution can be stored indefinitely at 20°C or room temperature.
Fibronectin stock solution: Dissolve lyophilized fibronectin in 1 mL sterile, deionized water. Aliquots of solubilized fibronectin are stable for 2 weeks at −20°C, as per the manufacturer’s guidelines.
3.7% v/v paraformaldehyde fixation solution: Mix 30 mL deionized water, 4.5 mL 10X PBS and 10 mL 16% paraformaldehyde. The solution should be used immediately or stored at −20°C for up to 1 year.
0.1% v/v Triton X-100 permeabilization solution: Mix 100 μL Triton X-100 and 100 mL 1X PBS. The solution can be stored indefinitely at room temperature.
33% v/v goat serum solution: Mix 16.67 mL goat serum and 33.33 mL 1X PBS. The solution can be stored at 4°C for 3 months.
1% w/v BSA solution: Dissolve 500 mg bovine serum albumin in 50 mL 1X PBS. The solution can be stored at 4°C for 3 months.
Oil Red O stock solution: Dissolve 300 mg of Oil Red O in 100 mL isopropanol, mix by stir. The solution can be stored for up to 3 months at room temperature.
60% v/v isopropanol: Mix 30 mL isopropanol with 20 mL deionized water. The solution can be stored indefinitely at room temperature.
PROCEDURE
Micropost array design and master fabrication (timing: 2 weeks)
CRITICAL The operational conditions described in this section strongly depend on many process parameters (e.g., temperature, gas flows, pressure, and radio frequency (RF) power) and the specific equipment used. The parameters given in the procedure serve only as guidance, and should be optimized empirically for each fabrication process flow.
-
1
Design reticle photomask using AutoDesk AutoCAD or Tanner EDA L-Edit Pro. See EXPERIMENTAL DESIGN for suggestions on designing a photomask.
-
2
Obtain photomask from a company specializing in high-resolution photomasks. We use Advance Reproductions or Microtronics Inc. for chrome masks. Turnaround time is approximately 1 week.
■ PAUSE POINT The photomask can be stored in a clean and dry environment at room temperature indefinitely.
-
3
Immerse a 6-inch silicon wafer in Piranha solution for 10 min to remove organic residue, dump rinse the wafer in deionized water for 10 min, and spin dry the wafer with a spin rinse dryer.
! CAUTION The Piranha solution is potentially explosive and must be kept away from organic solvents and materials. Proper goggles, aprons, and gloves must be worn during handling.
-
4
Dehydrate the wafer at 200°C for 10 min on a contact hotplate, allow the wafer to cool down to room temperature, and treat the wafer with HMDS vapor in a vacuum desiccator for 10 min.
-
5
Position the wafer on the chuck of the spin coater and dispense 5 mL SPR700-1.0 photoresist onto the center of the wafer. Spin the wafer at 500 revolutions per minute (RPM) for 8 s to spread the photoresist across the entire wafer and then quickly ramp up to 4000 RPM for 30 s to create a thin, uniform photoresist layer.
▲ CRITICAL STEP The wafer should be coated with photoresist within 60 min of completing the HMDS coating step.
? TROUBLESHOOTING
-
6
Soft bake the wafer at 95°C for 60 s on a contact hotplate to evaporate the solvent in the photoresist and density the photoresist film.
-
7
Insert the reticle photomask (obtained from Step 2) and wafer into the Nikon projection stepper. Expose the wafer through the reticle photomask with an exposure dose of about 170 mJ/cm2. Remove the wafer from the stepper and return the photomask to storage.
-
8
Post-exposure bake the wafer at 115°C for 60 s on a contact hotplate to drive diffusion of photo-catalyzed acid and enhance the spatial resolution of the photoresist pattern.
-
9
Develop the wafer with MF CD 26 developer solvent for 30 s, rinse the wafer with deionized water for 2 min, and spin dry the wafer.
-
10
Inspect the wafer with a metallurgical microscope to confirm that the photoresist pattern matches the desired patterns on the photomask. If not, strip away the photoresist with Piranha solution, and restart the fabrication process from Step 3.
▲ CRITICAL STEP Wafer inspection after photoresist development is necessary for monitoring if a) the correct mask has been used; b) the quality of the photoresist film (i.e. uniformity of thickness, absence of particulates and streaks) is satisfactory; c) the feature dimensions are within the specified tolerances.
? TROUBLESHOOTING
-
11
Bake the wafer at 130°C for 60 s on a contact hotplate to harden the photoresist.
-
12
Determine the thickness of the patterned photoresist film with the surface profilometer.
■ PAUSE POINT The patterned wafer can be stored in a clean and dry environment at room temperature for at least one week.
-
13
Etch the wafer with the DRIE machine through the exposed silicon surrounding the patterned photoresist using C4F8 and SF6 plasma. The Si-DRIE-etch recipe shown below yields an etch rate of approximately 1.47 μm/min.
| Etch mode | Passivation mode | |
|---|---|---|
| Process time: | 6s | 4.5 s |
| Overrun: | 0.5 s | 0s |
| Platen generator power: | 80 W | 60 W |
| Coil generator power: | 600 W | 600 W |
| Gas: | SF6 (70 seem) | C4F8 (35 sccam) |
| Etch rate: | 1.47 μm/min | N/A |
? TROUBLESHOOTING
-
14
Inspect the wafer in the SEM to measure the post diameter and height and to further ensure that silicon microposts with straight sidewalls are obtained (Fig. 2a).
-
15
Use the surface profilometer to measure the silicon etch depth and determine the uniformity of the silicon etch profile across the entire wafer.
■ PAUSE POINT The wafer can be stored in a clean and dry environment at room temperature indefinitely.
-
16
Dehydrate the wafer at 200°C for 10 min on a contact hotplate, allow the wafer to cool down to room temperature, and treat the wafer with HMDS vapor in a vacuum desiccator for 10 min.
-
17
Position the wafer on the center of the spin coater and dispense 10 mL of AZ4620 photoresist onto the center of the wafer. AZ4620 is a thick photoresist used to coat and protect the etched silicon structures from debris produced by the wafer die saw in Step 19. Spin the wafer at 500 RPM for 30 s to spread a thick layer of photoresist across the entire wafer.
▲ CRITICAL STEP The wafer should be coated with photoresist within 60 min of completing the HMDS coating step.
-
18
Bake the wafer at 130°C for 60 s on a contact hotplate to harden the photoresist.
■ PAUSE POINT The wafer coated with photoresist can be stored in a clean and dry environment at room temperature indefinitely.
-
19
Use the wafer die saw to cut the wafer into individual micropost array master devices. The final silicon micropost array master device has dimensions of approximately 21 mm by 21 mm.
■ PAUSE POINT The silicon micropost array master coated with photoresist can be stored in a clean and dry environment at room temperature indefinitely.
-
20
Immerse and sonicate the silicon master device in acetone for 10 min to completely dissolve the photoresist, rinse the silicon master device in isopropanol for 2 min, and blow-dry the silicon master device with a nitrogen gun.
■ PAUSE POINT The silicon micropost array master can be stored in a clean and dry environment at room temperature indefinitely.
-
21
To reinforce the master for repeated castings, cut a glass slide to approximately 25 mm x 25 mm and mount the master onto the glass slide with Araldite epoxy. Seal the edges of the master with SU-8 photoresist or Norland 68 optical adhesive and cure in a UV chamber.
-
22
To fluorosilanize the silicon micropost array master device, place the silicon device inside a vacuum desiccator alongside a glass slide. Dispense 2-3 drops of (tridecafluoro-1,1,2,2-tetrahydrooctyl)-1-trichlorosilane with a Pasteur pipette onto the slide. Place the Pasteur pipette inside the chamber, replace the chamber cover and evacuate for 4 hrs.
! CAUTION Add the silane to the desiccator inside a properly ventilated chemical hood and connect desiccator to a vacuum line in the fume hood if possible.
■ PAUSE POINT After silanization, the silicon micropost array master can be stored in a clean and dry environment at room temperature indefinitely.
Micropost array negative mold production (timing: 2.5 h)
-
23
Prepare a 10:1 mixture of uncured PDMS by dispensing 60 g of PDMS base pre-polymer and 6 g of curing agent into a plastic cup. These amounts are sufficient for four castings of a micropost array master in small aluminum weighing dishes (as described in Step 25), but can be adjusted if more or less negative molds are desired. Mix the PDMS components for 3 min.
-
24
De-gas the mixed, uncured PDMS in a vacuum desiccator for 1 hour.
▲ CRITICAL STEP Use separate desiccators for silanization and de-gassing PDMS to ensure that there is no contamination of the PDMS with residual silane left inside the desiccator.
-
25
Place a silicon micropost array master in a small aluminum weighing dish and pour the de-gassed PDMS into the dish to a height of approximately 0.75 cm. Wait 5-10 min for any bubbles introduced during pouring to rise to the surface and dissipate. Do not de-gas the dish of PDMS inside a vacuum desiccator.
▲ CRITICAL STEP Cast negative molds within 3 hours of de-gassing the PDMS as the PDMS will cure slow at room temperature and become increasingly viscous.
-
26
Cure the dish of PDMS at 110°C for 10-15 min in a laboratory oven. Remove the dish from the oven and let it cool to room temperature.
-
27
Carefully tear away the aluminum weighing dish without flexing the cured PDMS or master. The silicon master will not break easily if mounted onto a glass slide backing.
-
28
Cut away any PDMS undercutting the master with a razor blade.
-
29
Place the bulk PDMS and master against a flat surface, firmly hold down the PDMS at one corner of the master, and peel the PDMS at a slow constant rate from the diagonal corner to yield the negative mold (Fig. 3a).
-
30
If desired, repeat Steps 25-29 to cast additional negative molds of the master.
-
31
Cut away excess PDMS surrounding the micromolded region of the negative molds with a razor blade to ensure that the top surface of the mold is completely flat.
-
32
If desired, cut the negative molds into smaller molds so that micropost array substrates can be cast on different-sized coverslips (Fig. 3b).
-
33
To activate the surface of the negative molds with plasma for 1.5 min at 100 mA, place the molds face-up inside the chamber of a plasma cleaner (e.g., SPI Plasma Prep II) using a suitable carrier such as a 100 mm Petri dish. Evacuate the chamber until the pressure reaches 500-1000 mTorr and then activate the plasma source.
-
34
To fluorosilanize the negative molds, place molds inside a vacuum desiccator alongside a glass slide. Dispense 2-3 drops of (tridecafluoro-1,1,2,2-tetrahydrooctyl)-1-trichlorosilane with a Pasteur pipette onto the slide. Place the Pasteur pipette inside the chamber, replace the chamber cover and evacuate overnight (Fig. 3c).
Figure 3 |.
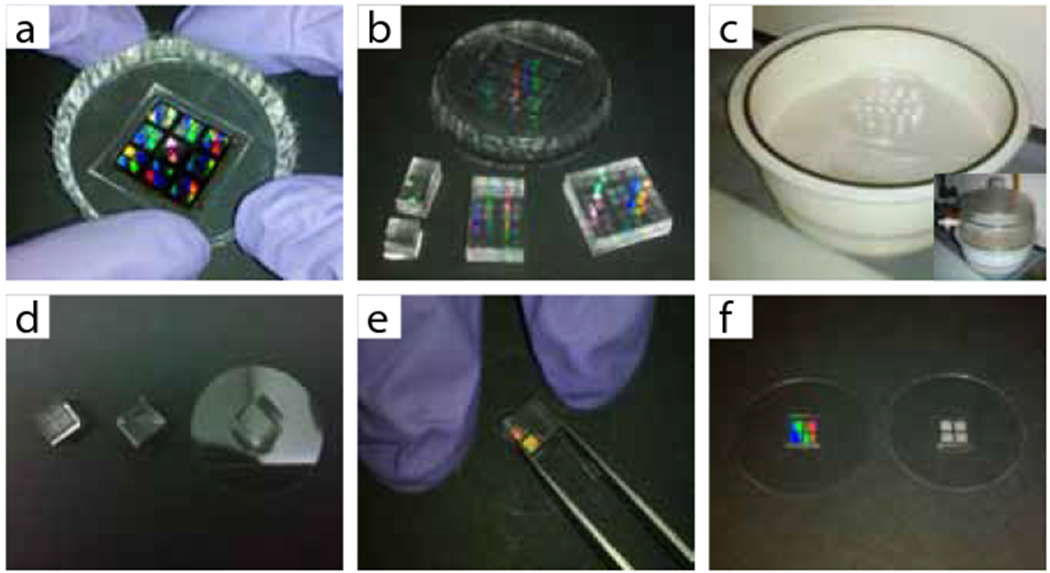
Replica molding of a micropost array master, (a) A PDMS negative mold is peeled from the silicon master and (b) can be cut to different sizes to cast arrays of different area, (c) The negative molds are then fluorosilanized in a vacuum desiccator, (d) Silanized negative molds are coated with a thin layer of uncured PDMS (middle mold), sandwiched against a coverslip (right mold) and cured, (e) A cured substrate is released by clamping the substrate while using tweezers to peel the mold, (f) Substrate quality can be quickly determined by looking at how the array diffracts light. A flawless substrate (left) diffracts light into many colors while a flawed substrate (right) has opaque regions.
■ PAUSE POINT Negative molds can be left in the desiccator indefinitely or can be removed after one day of silanization and stored in a clean, dry environment indefinitely.
Micropost array substrate fabrication (timing: 22-24 h)
-
35
Prepare a 10:1 mixture of uncured PDMS by dispensing 10 g of PDMS base pre-polymer and 1 g of curing agent into a plastic cup. Vigorously mix the PDMS components for 5 min.
▲ CRITICAL STEP This particular PDMS mixture (as opposed to the one used for negative molds) must be exactly 10:1 in order to reproducibly cast substrates with the same elastic modulus. Weigh the PDMS pre-polymer and curing agent with an analytical balance (e.g., Mettler Toledo AG245). The longer mixing time of 5 minutes is a precaution to ensure that the PDMS is well-mixed.
-
36
De-gas the mixed, uncured PDMS in a vacuum desiccator for 1 hour.
-
37
Dispense a small amount of de-gassed PDMS onto the top surface of each negative mold using a plastic transfer pipette. Spread out the PDMS over the top surface by either pressing two molds together like a sandwich or gently blowing the PDMS with a stream of N2 (Fig. 3d).
-
38
Place the PDMS-covered molds in a vacuum desiccator and evacuate for 15 min to remove any air bubbles that may be trapped between the uncured PDMS and molds.
-
39
Clean coverslips in preparation for casting against the molds. Blow dry coverslips with a stream of N2 and plasma clean for 2 min at 100 mA. Operate the plasma cleaner as described in Step 33. If a plasma cleaner is unavailable, coverslips can be cleaned with detergent or Piranha solution.
-
40
Lay out the clean coverslips on a clean glass plate and remove PDMS-covered molds from the vacuum desiccator.
-
41
Using a pair of tweezers, flip each mold onto a coverslip, sandwiching the uncured PDMS between the mold and the glass. Apply firm, uniform pressure to squeeze out the excess PDMS and ensure that the resultant casting is as uniformly level as possible (Fig. 3d).
-
42
Cure the molds and coverslips at 110°C for 20 hours in a laboratory oven. Remove the substrates and molds from the oven and let them to cool to room temperature.
▲ CRITICAL STEP PDMS is ‘fully cure’ after 20 hours at 110°C and will not cure further when stored at room temperature. However it will continue to cure if left at 110°C for longer periods of time. For example, PDMS cured for 48 hours will be more cross-linked, and therefore stiffer, than PDMS cured for 20 hours. Therefore, it is recommended that the curing time be kept consistent in repeat castings.
-
43
Peel off each negative mold from its coverslip to yield the micropost substrate. To minimize the likelihood of breaking the glass, use two fingers to clamp down the coverslip against a flat surface while the other hand grips the mold with tweezers. Peel the mold at a slow, constant rate from one corner towards the other until the substrate is released (Fig. 3e).
? TROUBLESHOOTING
-
44
Inspect each substrate by tilting it back and forth under a light (Fig. 3f). If a substrate appears opaque, the micropost array is collapsed. If the substrate diffracts light into different colors, the majority of microposts are likely upright. Substrates that are macroscopically flawless should be examined further with an optical microscope to check if there are collapsed or missing microposts scattered within the array. Missing posts, which leave behind stumps, appear hollow when viewed under an optical microscope with ambient illumination. The short stumps are also invisible when the substrate is immersed in liquid, which is another method to distinguish them from intact microposts. Transfer flawless substrates to a storage container (e.g., Petri dish). To rescue flawed substrates, sonicate substrates in ethanol for 1–2 min to make the microposts stand upright and supercritically dry the substrates in a critical point drier (see Box 1).
BOX 1 |. Supercritical drying of collapsed micropost substrates (timing: 1 hour).
Operating instructions for critical point drying is machine-dependent. The following instructions are for generic operation.
Cool the drying chamber to below 0°C by opening the Cool meter valve that connects the machine to a liquid CO2 tank equipped with a siphon.
Fill the chamber with ethanol and transfer the substrates to the chamber. Substrates may be stacked as long as they do not stick to each other. As such, the PDMS squeezed out during casting that surrounds the array region is a suitable spacer.
Close the chamber and open the Fill meter valve to allow liquid CO2 to enter the chamber. The presence of schlieren lines indicates that liquid CO2 and ethanol are mixing.
When the chamber is full, open the Purge meter valve to allow the chamber contents to exit. The fill and purge rates are not exact but the position of the Purge meter valve should always be lower (i.e. more closed), than the position of the Fill meter valve. A mixture of ethanol and CO2 will exit the tubing connected to the purge outlet.
Wait a sufficient amount of time until the schieren lines disappear and only dry ice is observed exiting the purge tube. This indicates that all the ethanol has been replaced by liquid CO2.
Close all valves and heat up the chamber until the pressure and temperature exceed the critical point of CO2 (1037 psi and 31°C). Above this point, liquid CO2 is converted to gaseous CO2.
Open the Purge Valve to vent the CO2 from the chamber.
Remove the substrates from the critical point drier and inspect as done in Step 44 of the Procedure.
■ PAUSE POINT Flawless substrates can be stored in a dry environment indefinitely. Flawed substrates that are stored in ethanol do not have to be supercritically dried immediately.
Micropost array substrate functionalization (timing: 4 h)
-
45
Cast micropatterned or flat slabs of PDMS to use as stamps. If micropatterned stamps are desired, see Box 2 for steps to make a micropatterned silicon wafer before performing any steps in this section. Otherwise, prepare sufficient 30:1 or 10:1 uncured PDMS in a plastic cup to fill a 100 mm or 150 mm Petri dish to a height of 0.75 cm. 30:1 PDMS is softer than 10:1 and is recommended for flat stamps. 10:1 PDMS is recommended for micropatterned stamps as the increased stiffness reduces the likelihood that the stamp will collapse under its own weight. Mix the PDMS components for 3 min.
-
46
De-gas the mixed, uncured PDMS in a vacuum desiccator for 1 hour.
-
47
For a flat slab, pour the de-gassed PDMS into a 150 mm Petri dish. For a micropatterned slab, pour PDMS over a micropatterned silicon wafer placed inside a Petri dish or aluminum weighing dish of suitable size. Wait 5-10 min for the bubbles introduced during pouring to rise to the surface and dissipate.
-
48
Cure the PDMS at 65°C for at least 2 hours or at 110°C for at least 15 min (if using an aluminum weighing dish). Remove the dish of PDMS from the oven and allow it to cool for 5 min. Proceed to Step 52 if not casting a micropatterned PDMS slab.
BOX 2 |. Stamp master fabrication for micropatterned functionalization (timing:2 weeks).
CRITICAL Many process parameters in this section such as photoresist spin-coating speeds, baking times and UV exposure duration are machine-specific and dependent on the experimental design. The parameters given are for guidance only and should be optimized empirically for each type of application.
CRITICAL Steps 3-8 should be performed in a clean room (class 10000 or equivalent). Equipment and reagents should be handled inside the clean environment for these steps. Silicon wafers should not be exposed to an unclean environment until after Step 8.
-
1
Design photomask using vector graphics software such as Adobe Illustrator. See EXPERIMENTAL DESIGN for suggestions on designing a photomask.
-
2
Obtain transparency photomask from a printing company specializing in high-resolution printing. We use include CAD/Art Services, Inc. for this service. Turnaround time is approximately 1 week.
-
3
Dehydrate a new silicon wafer at 200°C for 10 min on a contact hotplate, remove the wafer from the hotplate and let it cool to room temperature.
-
4
If a plasma cleaner is available, use it to clean the wafer for 2 min at 100 mA to remove surface contaminants; place wafer inside the chamber of a plasma cleaner and operate as described in Step 33 of the main protocol.
-
5
Position the wafer on the chuck of the spin coater and dispense 5 mL of SU-8 2000 series photoresist on the center of the wafer (see EXPERIMENTAL DESIGN for suggestions on choosing the right photoresist). Spin the wafer at 500 RPM (84 RPM/s acceleration) for 10 seconds to spread out the photoresist and then ramp up to 1500 RPM (336 RPM/s acceleration) for 30 s to produce a uniform photoresist layer.
? TROUBLESHOOTING
-
6
Soft bake the wafer at 65°C for 1 min followed by 95°C for 2 min on two contact hotplates to evaporate the solvent and density the photoresist film. Remove the wafer from the hotplate and let it cool to room temperature.
? TROUBLESHOOTING
-
7
Expose the wafer to 365 nm UV light through the photomask via a mask aligner. The exposure dose is 130 mJ/cm2, although this must be optimized based on the experimental design.
-
8
Post-exposure bake the wafer at 65 °C for 1 min followed by 95°C for 2 min on two contact hotplates to cross-link exposed regions of photoresist. Let the wafer slowly cool to room temperature on the hotplate.
-
9
Develop the photoresist by submerging and agitating the wafer in two successive dishes of propylene glycol monomethyl ether acetate (PGMEA) for 3 min and 10 s, respectively.
-
10
Rinse away residual PGMEA by submerging and agitating the wafer in two successive dishes of isopropanol for 10 s each. Blow dry the wafer with a stream of N2.
-
11
Inspect the wafer on a metallurgical microscope for pattern fidelity of photoresist.
? TROUBLESHOOTING
-
12
Hard bake the wafer on a contact hotplate at 175°C for at least 15 min. Let the wafer cool to room temperature.
? TROUBLESHOOTING
-
13
Fluorosilanize the wafer in the same way described in Step 22 of the Procedure.
■ PAUSE POINT Curing time for the slab of PDMS is not critical so the dish can be left in the oven for a couple of days.
-
49
If casting a PDMS slab against a micropatterned wafer, carefully separate the PDMS and wafer from the dish without flexing the silicon wafer.
-
50
Cut away any PDMS that has undercut the wafer with a razor blade.
-
51
Place the bulk PDMS and wafer against a flat surface, firmly hold down the PDMS at one end of the wafer, and peel the micropatterned PDMS slab at a slow constant rate from the other end.
-
52
Use a razor blade to cut the slab of PDMS into stamps that fit the area of the micropost arrays to be functionalized (Fig. 4a).
-
53
Notch the bottom corner of each stamp to indicate the orientation of the stamping surface.
-
54
Prepare flawless micropost substrates (from Step 44) for functionalization. Cut away any excess PDMS surrounding the array with a razor blade (Fig. 4a). If substrates will be used for live-cell imaging at high magnification, proceed to Step 55. Otherwise, skip to Step 56.
-
55For imaging with high-magnification, low-working distance objectives (Fig. 4a), micropost substrates can be mounted to a Petri dish with a 20-mm hole cut out (e.g., MatTek dish) using UV-curable adhesive (option A) or using PDMS (option B), or can be mounted to a re-usable stainless steel dish (option C):
- Mount substrate to a MatTek Petri dish with a cut-out hole using UV-curable adhesive
- Use an Alpha polyester swab to spread a thin, narrow layer of Norland 68 optical adhesive on the back side of the Petri dish, around the perimeter of the cut-out hole.
- Lay down the micropost substrate over the hole.
- Expose the entire assembly in a UV curing chamber to cure the adhesive.
- Mount substrate to a MatTek Petri dish with a cut-out hole using PDMS
- Use an Alpha polyester swab to spread a thin, narrow layer of uncured 10:1 PDMS on the back side of the Petri dish, around the perimeter of the cut-out hole.
- Lay down the micropost substrate over the hole.
- Cure the entire assembly at 65°C for 1 hour in laboratory oven.
- Mount substrate to a re-usable stainless steel dish
-
iInsert substrate in a re-usable stainless steel dish (e.g., Attofluor)
-
i
Figure 4 |.
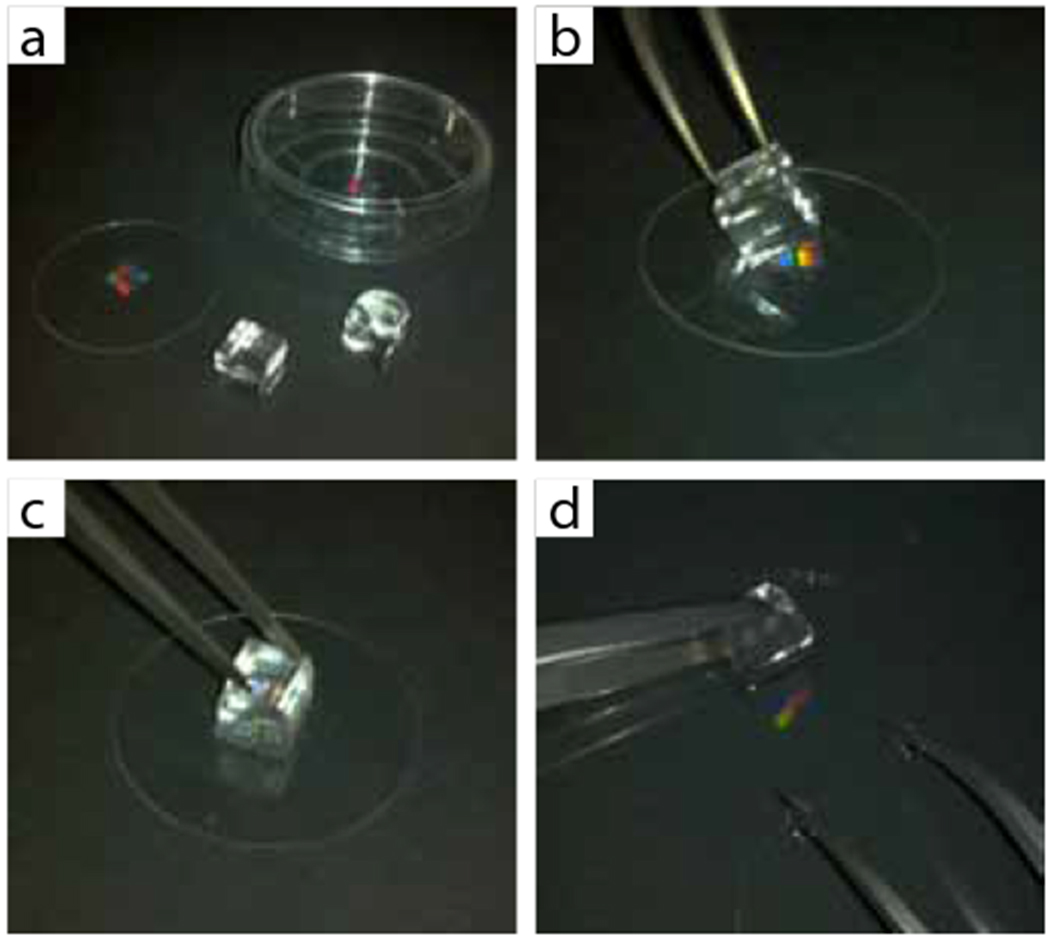
Microcontact printing on micropost array substrates, (a) PDMS stamps are cut to the size of the micropost array and then coated with fibronectin solution (right stamp). Micropost array substrates can be left unmounted or mounted to a Petri dish, (b) A dried, coated stamp is aligned and laid on top of the micropost array, (c) Gentle pressure is applied with tweezers to ensure good contact between the stamp and the micropost tips, (d) The substrate and stamp are placed in ethanol before the stamp is peeled, to minimize any damage that peeling forces may impart.
■ PAUSE POINT Steps 49 through 55 are not time-sensitive and can be performed anytime before the rest of this section. PDMS stamps and trimmed/assembled substrates can be stored in a clean, dry environment indefinitely until the day of use.
-
2
Sonicate stamps in ethanol (from Step 53) for 5 min to clean off any particulates.
-
3
Dry the stamps in a sterile environment with a stream of N2 and transfer to a new Petri dish.
-
4
Prepare a sufficient working volume of fibronectin solution, diluted to a final concentration of 50 μg/mL in sterile, deionized water, to coat the stamps.
▲ CRITICAL STEP Do not mix the fibronectin solution with a small bore micropipette tip which will shear the protein. Instead, use a large bore micropipette tip or flick the tube to mix.
-
5
Dispense droplets of fibronectin solution onto the top surface of each stamp. Sweep over the droplet with a micropipette tip to spread the solution along the edges and corners of the stamp (Fig. 4a).
-
6
Let fibronectin adsorb to stamp for 1 hour.
-
7
Wash away the excess fibronectin solution by flooding the Petri dish with deionized water until the stamps are submerged.
-
8
Submerge the stamps in a second Petri dish filled with deionized water to wash again.
-
9
Dry the stamps with a stream of N2 and transfer stamps to a new Petri dish.
-
10
Expose the micropost substrates to UV ozone for 7 min in a UVO cleaner to temporarily hydrophilize the surface.
-
11
Lay fibronectin-coated stamps on top of the substrates and apply gentle pressure to transfer fibronectin to the tips of the microposts (Fig. 4b–c). Let the stamp remain in contact for at least 15 s.
▲ CRITICAL STEP Microcontact print the fibronectin within 30 min of exposing the substrates to UV ozone. Otherwise the substrate will lose its hydrophilicity and will have to be re-exposed to UV ozone for 7 min.
-
12
Peel away the stamps. For taller, softer microposts, submerge the substrates in ethanol before peeling away the stamps (Fig. 4d).
? TROUBLESHOOTING
-
13If not already submerged in ethanol, submerge the functionalized substrates in pure ethanol, followed by 70% v/v ethanol and three successive washes with deionized water to dilute out the ethanol. There are two methods of washing depending on whether a substrate is mounted to a live-cell viewing dish (option A) or unmounted (option B).
- Washing dish-mounted substrates
- Add 2 mL of ethanol to the dish, swirl the dish, and then aspirate.
- Add 2 mL of 70% v/v ethanol, swirl the dish and then aspirate.
- Add 2 mL of deionized water, swirl the dish and then aspirate. Repeat this two more times and leave the substrates covered with water.
- Washing unmounted substrates
- Transfer the substrates to a Petri dish containing ethanol.
- Transfer the substrates to a Petri dish containing 70% v/v ethanol and swirl the dish.
- Transfer the substrates to a Petri dish containing deionized water and swirl the dish. Repeat this step two more times.
▲ CRITICAL STEP Pure ethanol, which has a low surface tension, is used to wet the micropost array substrates without collapsing the microposts. 70% v/v ethanol serves to sterilize the substrates before cell culture. Minimize exposure of the substrates to air during successive washes in water to prevent the microposts from collapsing. For dish-mounted substrates, do not aspirate the liquid completely and leave the array region covered with a puddle of liquid. For unmounted substrates, use tweezers to transfer substrates quickly between Petri dishes and forcibly submerge them in aqueous liquids as PDMS is very hydrophobic. Use this technique for all subsequent liquid handling steps in the Substrate Functionalization and Cell Culture sections of the protocol (Steps 69, 70, 72, 73, 75, and 79).
-
14
If the microposts are to be fluorescently labeled, prepare a working solution of 5 μg/mL Dil by diluting the 50 μg/mL Dil stock solution in deionized water. Otherwise, proceed to Step 71.
-
15Submerge substrates in Dil solution and incubate for 1 hour, protected from light, using option A for dish-mounted substrates or option B for unmounted substrates:
- Dish-mounted substrates
- Aspirate the deionized water and add 2 mL Dil solution.
- Unmounted substrates
- Transfer the substrates to a Petri dish filled with Dil solution.
-
16Wash away the excess Dil solution with deionized water, using option A for dish-mounted substrates or option B for unmounted substrates:
- Dish-mounted substrates
- Aspirate the Dil solution in the dish.
- Add 2 mL of deionized water, swirl the dish and then aspirate. Repeat this two more times and leave the substrates covered with water.
- Unmounted substrates
- Transfer the substrates to a Petri dish containing deionized water and swirl the dish. Repeat this step two more times.
-
17
To block un-stamped regions of the substrates with F127 Pluronic, prepare a working solution of 0.2% w/v Pluronic by diluting the 2% w/v Pluronic stock solution in PBS.
-
18Submerge substrates in Pluronic solution and incubate for 30-60 min, protected from light (if labeled with Dil), using option A for dish-mounted substrates or option B for unmounted substrates:
- Dish-mounted substrates
- Aspirate the deionized water and add 1-2 mL Pluronic solution.
- Unmounted substrates
- Transfer the substrates to a Petri dish filled with Pluronic solution.
-
19Wash away the excess Pluronic solution with deionized water and PBS, using option A for dish-mounted substrates or option B for unmounted substrates:
- Dish-mounted substrates
- Aspirate the Pluronic solution in the dish.
- Add 2 mL of deionized water, swirl the dish and then aspirate. Repeat this step once.
- Add 2 mL of PBS.
- Unmounted substrates
-
iTransfer the substrates to a Petri dish containing deionized water and swirl the dish. Repeat this step once.
-
iiTransfer the substrates to a Petri dish containing PBS.
-
i
■ PAUSE POINT At this point, the substrates can be used immediately for an experiment or stored at 4°C for up to 1 week. For storage, seal the container holding the substrates with parafilm. If the substrates are fluorescently labeled, wrap the container with aluminum foil.
Cell culture on micropost array substrates (timing: 1-24 h)
-
3
Warm cell culture media and trypsin to 37°C prior to seeding cells on micropost substrates.
-
4Replace PBS covering substrates with cell culture media, using option A for dish-mounted substrates or option B for unmounted substrates:.
- Dish-mounted substrates
- Aspirate the PBS and add 2 mL of media.
- Unmounted substrates
-
iTransfer the substrates to a Petri dish filled with media.
-
i
-
5
Re-suspend adherent cells by rinsing the cells with PBS twice and then adding 2 mL of trypsin-EDTA into the T-75 culture flask. Incubate the cells at 37°C/5% CO2 for 5 min, tap the side of the flask to detach the cells, and add 4 mL of cell culture medium to neutralize trypsin. Pipet the cell suspension into a 15 mL conical tube and centrifuge at 300 x g to pellet the cells. Aspirate the medium, and re-suspend the cell pellet in 5 mL of cell culture. Detailed tissue culture procedures have also been published elsewhere 102.
-
6
To count re-suspended cells, pipet 20 μL of cell suspension into the notch of a hemocytometer.Observe the hemocytometer under a tissue culture microscope and count the number of cells within the 9 large grids on the hemocytometer. Divide the cell count by the number of grids inspected and multiply by 10000 to determine the number of cells per mL of suspension.
-
7
Re-plate cells onto the substrates by adding the cells to a final density of 1-5 x 10³ cells per cm2 of culture area, including the area in the culture vessel surrounding the micropost arrays. For a substrate in a 35 mm Petri dish, 1-5 x 10⁴ cells is an appropriate number of cells for seeding. Place the substrates in an incubator to allow cells to attach.
▲ CRITICAL STEP The density of cells on the micropost array substrates must be empirically optimized as dictated by the goals of the experiment. Parameters to optimize include initial cell seeding density (Step 78), cell seeding time (Step 79), and incubation time for allowing cells to spread prior to experimentation (Step 80). These are dependent on cell type and whether micropatterns are used. The EXPERIMENTAL DESIGN has general seeding strategies. Box 4 describes the seeding conditions specific to the requirements of qPCR.
BOX 4 |. Quantification of gene expression in stem cells on micropost array substrates (timing: 3 hours).
CRITICAL The general protocol described here is as described in ref. 60. Users can of course switch to their familiar protocols for RNA extraction as well as qPCR. Detailed instructions are provided separately by the kits/qPCR machines that are used for the protocols.
CRITICAL For this assay, cells should be cultured on an array area of 2.25 cm2 at a density of 5000 cells/cm2 to obtain enough RNA for quantification. Let the cells attach and fully spread overnight. Substrates should be unmounted and immersed in a multi-well or Petri dish format.
-
1
Treat cells on the micropost array substrates with different chemicals; in this case, treat the cells with 2 mL of either osteogenic medium, adipogenic medium or mixed medium (osteo:adipo=l:l) for 14 days. Untreated cells left in growth media are used as a control.
-
2
After treatment, aspirate medium and rinse the cells with PBS twice. Keep cells in PBS.
-
3
Under a microscope, scrape away cells that are not on the micropost array part of the substrate using a small bore micropipette tip.
-
4
Aspirate PBS and discard the scraped cells.
-
5
To extract RNA from cells attached to the micropost array substrate using the Qiagen RNeasy* Micro kit or an equivalent extraction kit, firstly add 10 μL of 2-mercaptoethanol per 1 mL buffer RLT and mix by vortexing.
-
6
Disrupt the cells by adding 350 μL Buffer RLT directly on the micropost array substrate.
-
7
Harvest lysate with a cell lifter. Pipet the lysate directly into a RNase-free eppendorf tube. Pass the lysate at least 5 times through a 20-gauge needle fitted to an RNase-free syringe.
PAUSE POINT Samples can be preserved in a −80°C deep freezer at this point.
-
8
Add 1 volume (usually 350 μL) of 70% ethanol to the homogenized lysate, and mix well by pipetting. Do not centrifuge.
-
9
Transfer the sample, including any precipitate that may have formed, to an RNeasy MinElute Spin Column in a 2 mL collection tube. Close the tube gently, and centrifuge for 15 s at ≥8000 x g (≥10,000 rpm). Discard the flow-through.
-
10
Add 350 μL Buffer RW1 to the RNeasy MinElute Spin Column. Close the tube gently, and centrifuge for 15 s at ≥8000 x g (≥10,000 rpm) to wash the column. Discard the flow-through.
-
11
Add 10 μL DNase I stock solution to 70 μL Buffer RDD. Mix by gently inverting the tube.
-
12
Pipet the DNase I incubation mix (80 μL) directly onto the RNeasy MinElute silica-gel membrane, and place on the benchtop at room temperature for 15 min.
-
13
Add 350 μL Buffer RW1 into the RNeasy MinElute Spin Column, and centrifuge for 15 s at >8000 x g. Discard the flow-through and collection tube.
-
14
Transfer the RNeasy MinElute Spin Column into a new 2 mL collection tube. Pipet 500 μL Buffer RPE onto the RNeasy MinElute Spin Column. Close the tube gently, and centrifuge for 15 s at ≥8000 x g (≥10,000 rpm) to wash the column. Discard the flow-through.
-
15
Add 500 μL of 80% ethanol to the RNeasy MinElute Spin Column. Close the tube gently, and centrifuge for 2 min at ≥8000 x g (≥10,000 rpm) to dry the silica-gel membrane. Discard the flowthrough and collection tube.
-
16
Transfer the RNeasy MinElute Spin Column into a new 2 mL collection tube. Open the cap of the spin column, and centrifuge in a microcentrifuge at maximum speed for 5 min. Discard the flowthrough and collection tube.
-
17
To elute, transfer the spin column to a new RNase-free 1.5 mL collection tube. Pipet 14 μL RNase-free water directly onto the center of the silica-gel membrane. Close the tube gently, and centrifuge for 1 min at maximum speed to elute.
-
18
Dissolve 1 μL RNA in 99 μL nuclease-free water and quantify RNA concentration using a spectrophotometer. The RNA concentration is calculated as follows: OD260 value x 40 x dilution factor/1000 = x μg/μl
-
19
Take 0.5 μg of RNA and mix with 1 μL Oligo dTi12-18 (500 μg/mL), 1 μL 10 mM dNTP mixture and sterile water to a final volume of 12 μL.
-
20
Heat the mixture to 65°C for 5 min and quickly chill on ice. Collect the contents of the tube by brief centrifugation and add 4 μL 5X First-Strand Buffer, 2 μL 0.1 M DTT, and 1 μL RNaseOUT™ Recombinant Ribonuclease Inhibitor (40 units/pL).
-
21
Mix the contents of the tube gently and incubate at 37°C for 2 min.
-
22
Add 1 μL (200 units) of M-MLV reverse transcriptase, and mix by pipetting gently up and down. Incubate for 50 min at 37°C. Then inactivate the reaction by heating at 70°C for 15 min.
-
23
Add sterile water to a final volume of 100 μL.
PAUSE POINT Samples can be preserved in a −20°C deep freezer at this point.
-
24
For qPCR, pipet 5 μL of each sample to one well of a 96-well PCR plate. Triplicate each sample.
▲ CRITICAL STEP Make sure that each sample is loaded at the same volume. Change the pipette tip after loading each well.
-
25
Make PCR master mixture by mixing 10 parts 2x universal PCR mixture, 1 part TaqMan gene expression assay and 4 parts nuclease-free water. Add 15 μL to each well in the 96-well plate. Seal the 96 well plate with optically clear adhesive seal sheets.
-
26
Load 96-well PCR plate in qPCR thermal cycler (e.g., Applied Biosystems 7300) and perform experiment according to the protocol provided by the vendor.
-
2After allowing the cells to attach for an empirically optimized time, remove floating cells by repeatedly washing the substrates, using option A for dish-mounted substrates or option B for unmounted substrates:
- Dish-mounted substrates
- Aspirate the liquid in the dish. Do not aspirate directly above the area where cells are attached.
- Add 2 mL PBS, swirl the dish to disperse floating cells that have pooled, and aspirate. Repeat this step 3-5 times until the majority of floating cells have been removed.
- Aspirate the PBS and replace with fresh media.
- Unmounted substrates
-
iTransfer the substrates to a Petri dish filled with PBS and gently swirl the dish to wash away floating cells that have pooled near the surface of the substrate. Repeat this step 1-2 times.
-
iiTransfer the substrates to a Petri dish with fresh media.
-
i
-
3
Allow substrates seeded with cells to incubate at 37°C until ready to perform experiment. Cells can be fully spread on the micropost arrays in as little as 2 hours. For long-term experiments, cells have been cultured on the micropost arrays for up to 2 weeks and could possibly remain viable for even longer periods. For traction force analysis, cells can be imaged live or fixed. If cells will be imaged live, proceed to Step 81. If cells will be fixed and stained for cellular structures, proceed to Box 3 which describes the protocol for fixation and staining, and then proceed to Step 81. For stem cell differentiation analysis, there are three separate assays described in this protocol. Box 4 describes the quantification of stem cell differentiation markers by qPCR. Box 5 describes the assay for adipogenic differentiation via Oil Red O staining. Box 6 describes the assay for osteogenic differentiation via alkaline phosphatase staining.
BOX 3 |. Fixation and immunofluorescence staining of cells on micropost array substrates (timing: 7-8 hours).
This fixation protocol can be optimized depending on the experimental design. The standard method is to fix the cells and then permeabilize. In certain cases, such as staining for focal adhesions, a triton extraction before fixation may yield better signal by removing more cytoplasmic background.
- If a dish-mounted substrate is to be fixed and stained, separate the substrate from the dish using option A for substrate mounted with Norland 68 optical adhesive, option B for substrate mounted with PDMS or option C for substrate inserted in a re-usable dish:
- Substrate mounted with Norland 68 optical adhesive
- Cut out the substrate with a diamond-tipped pen.
- Substrate mounted with PDMS
- Pry away the substrate with a razor blade. The Petri dish is re-usable.
- Substrate inserted in a re-usable dish
-
iRemove the substrate from the dish.
-
i
▲ CRITICAL STEP Make sure the cultured surface remains wet.
-
2
Fix cells by immersing substrates in 3.7% v/v paraformaldehyde for 20 min.
▲ CRITICAL STEP Protect the substrates from light if labeled with Dil.
-
3
Wash the substrates in three successive Petri dishes of PBS.
-
4
Permeabilize the cells by immersing the substrates in 0.1% v/v triton X-100 solution for 10 min.
CRITICAL STEP Protect the substrates from light if labeled with Dil.
-
5
Block the substrates against non-specific adsorption of antibodies by immersing them in 2 mL 33% v/v goat serum or 1% w/v BSA solution for 1 hour.
▲ CRITICAL STEP For blocking, it is recommended that normal serum from the host species of the secondary antibodies be used, which is most commonly goat. BSA can be used in other cases. Protect the substrates from light if labeled with Dil.
-
6
Prepare an appropriate dilution of primary antibodies in 33% v/v goat serum or 0.1% v/v triton X-100 solution. Typical dilutions range from 1:100 to 1:500. 25 mm circular and 22 mm square coverslips require 150-200 μL each while 18 mm circular coverslips require 75-100 μL of antibody solution.
-
7
Dispense droplets of primary antibody solution on a sheet of parafilm for each substrate to be stained.
-
8
Place each substrate face down on a droplet and use tweezers to gently rock the substrate up and down a few times to evenly distribute the solution. Let the substrates incubate with the primary antibody for 1 hour.
▲ CRITICAL STEP Protect the substrates from light if labeled with Dil.
-
9
Wash the substrates with PBS three times to remove the unbound primary antibody. Each PBS wash should last 3-5 min.
-
10
Prepare an appropriate dilution of secondary antibodies and other fluorescent stains (e.g., DAPI, fluorophore-conjugated phalloidin) in 33% v/v goat serum or 0.1% v/v triton X-100 solution. Typical dilutions range from 1:100 to 1:2000. The same volumes used for the primary antibody solution apply for the secondary antibody solution.
-
11
Dispense droplets of secondary antibody solution on a sheet of parafilm for each substrate to be stained.
-
12
Place each substrate face down on a droplet and gently rock up and down a few times. Let the substrates incubate with the secondary antibody for 1 hour. Protect from light.
-
13
Wash the substrates with PBS three times to remove the unbound secondary antibody. Each PBS wash should last 3-5 min.
-
14
Transfer each stained substrate face-up to a microscope slide, dispense 1-2 drops of Fluoromount G and cover with a clean coverslip.
-
15
Allow Fluoromount G to cure for approximately 4 hours before imaging. Proceed to Step 81 of the Procedure for imaging the fixed and stained cells.
▲ CRITICAL STEP The highest quality images are obtained within 24 hours of mounting. After 24 hours, Fluoromount G is fully cured and its index of refraction will match that of borosilicate glass. As a result, the microposts will be very hard to see under Phase illumination and must be located with fluorescence.
BOX 5 |. Oil Red O staining for adipogenic differentiation of stem cells on micropost array substrates (timing: 1 hour).
-
1
Treat cells on the micropost array substrates by adding 2 mL adipogenic medium for 14 days.Change medium twice a week.
-
2
After treatment, rinse cells with PBS twice and then fix cells with 10% formalin for 30 min.
-
3
During fixation, prepare Oil Red O working solution by mixing 3 parts of Oil Red O stock solution with 2 parts of deionized water. For example, for a 10 mL working solution, mix 6 mL of Oil Red O stock solution with 4 mL of water. Allow solution to sit at room temperature for 10 minutes and then filter it through glass fiber filter paper.
▲ CRITICAL STEP The Oil Red O working solution must be freshly prepared and is stable for only 2 hours at room temperature. Filtering through glass fiber filter paper removes undissolved Oil Red O particles which may jeopardize cell counting.
-
4
After fixation, aspirate the fixing solution and rinse cells with PBS three times to wash out the formalin.
-
5
Aspirate the PBS and add 2 mL of 60% isopropanol to cover each substrate. Incubate for 5 minutes.
-
6
Aspirate the 60% isopropanol and add 2 mL of Oil Red O working solution to each substrate. Incubate at room temperature for 10 minutes.
▲ CRITICAL STEP The 60% isopropanol pretreatment in Step 5 eliminates the background of Oil Red O binding. Do not rinse the cells with PBS in between 60% isopropanol treatment and Oil Red O staining.
-
7
Aspirate the Oil Red O working solution and add 2 mL 60% isopropanol to rinse away excess Oil Red O. Then rinse the cells with PBS three times.
-
8
Stain nuclei with DAPI at a dilution of 1:2000 in 2mL PBS. Incubate substrates at room temperature for 30 minutes and protect from the light.
-
9
Count cells under microscope. The percentage of Oil Red O-positive stained cells is calculated as follows: (# of Oil Red O-positive cells/# of DAPI-stained nuclei) x 100% (Fig. 8).
BOX 6 |. Alkaline phosphatase staining for osteogenic differentiation of stem cells on micropost array substrates (timing: 2 hours).
CRITICAL Given the fact that the number of cells on the micropost array substrate may be low for this assay, the quantification assay of alkaline phosphatase (ALPase) activity may not be feasible. Instead, it is better to count the number of ALPase activity-positive cells directly and then normalize with the total number of cells stained by DAPI in the same field.
-
1
Treat cells on the micropost array substrates with osteogenic induction medium for 14 days. Change medium twice a week.
-
2
After treatment, rinse cells with PBS three times.
-
3
Prepare citrate working solution by diluting 2 mL of concentrated citrate into 98 mL deionized water. The citrate working solution can be kept at 4°C for further experiments.
-
4
Prepare the fixation solution by mixing 2 parts of citrate working solution with 3 parts of acetone. For example, to prepare 10 mL of fixation solution, mix 4 mL of citrate working solution with 6 mL of acetone.
▲ CRITICAL STEP Fresh fixation solution must be prepared immediately before use.
-
5
Aspirate PBS and add 2 ml of fixation solution to each substrate and fix cells at room temperature for 30 seconds.
-
6
Aspirate fixation solution, rinse cells with PBS twice, and keep cells in PBS.
-
7
Prepare substrate solution as follows: carefully cut a Fast blue RR salt capsule (keep under −20°C), dissolve the Fast blue RR salt powder in 48 ml H2O, and mix by vortex until all the Fast blue salt has dissolved. The color of the solution will become yellow. Add 2 mL of Naphthol As-MX phosphate alkaline solution into the Fast blue RR solution and mix by inverting the tube 5 times.
▲ CRITICAL STEP Substrate solution must be prepared immediately before use. Once Naphthol As-MX phosphate alkaline solution is added to the Fast blue solution, the solution must be used within 30 minutes.
-
8
Aspirate PBS from cells and add 2 ml of substrate solution to each substrate. Incubate at room temperature for 30 minutes and protect from light.
-
9
Aspirate the substrate solution and rinse cells with PBS once.
-
10
Stain nuclei with DAPI at a dilution of 1:2000 in 2 mL PBS. Incubate substrates at room temperature for 30 minutes and protect from the light.
-
11
Rinse cells with PBS twice. The cell body of ALPase activity-positive cells will become blue after staining.
-
12
Count cells under microscope. The percentage of ALPase activity-positive cells is calculated as follows: (# of ALPase (+) cells / # of DAPI-stained nuclei) xl00% (Fig. 8).
? TROUBLESHOOTING
Imaging cells on micropost array substrates (timing: variable; depends how many cells will be imaged)
-
3
If performing live cell imaging, set up the microscope and equilibrate the temperature and C02 in the live cell incubator.
-
4
Place a dish-mounted substrate or a slide-mounted fixed substrate on the microscope stage. Add objective immersion oil if necessary.
-
5
Adjust the focus to bring the microposts into view.
-
6
Scan the micropost array for cells to image (Fig. 5a–c). This is easiest if live cells are labeled with GFP or if fixed cells are stained for cellular structures. In that event, use the appropriate fluorescence excitation to detect the labeled cells. If cells are not fluorescent, but the microposts are labeled with Dil, it is more convenient to use fluorescence rather than phase illumination to identify cells. Contractile cells can be identified by looking for well-deflected microposts that can be connected to form a closed perimeter. Weaker cells can be located by adjusting the fine focus up and down over the length of the microposts to find posts that have slight deflections.
Figure 5 |.
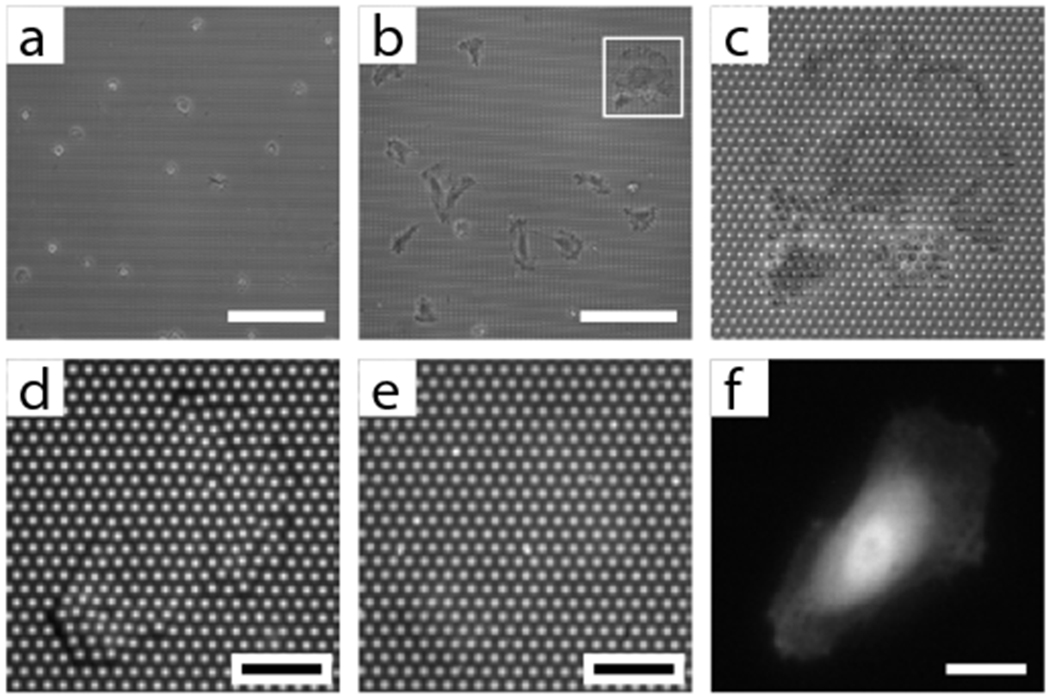
Basic imaging of cells on micropost array substrates, (a) A low-magnification, bright field image of round, but adherent, cells after only 30 minutes of spreading on the micropost array. Scale bar is 150 μm. (b) A low-magnification, bright field image of cells after overnight incubation on the micropost array. Scale bar is 150 μm. The inset is magnified in (c) to show a spread cell, (d) A high-magnification, fluorescent image of the tips of the microposts under a cell. The base positions of the same microposts are shown in (e) and the GFP-expressing cell is shown in (f). These three images were acquired with a 40x oil-immersion objective. Scale bars are 20 μm.
? TROUBLESHOOTING
-
7
For a target cell, use fluorescence illumination and adjust the fine focus to the tips of the microposts. Acquire an image of the tips of the microposts, known as the Top Image (Fig. 5d).
-
8
Optionally, an image of the undeflected positions of the microposts can be acquired for traction force measurement. Adjust the fine focus to approximately 1 μm above the base of the microposts. Acquire an image, known as the Base Image (Fig. 5e).
-
9
Optionally, if the target cell is fluorescently labeled, whether live or fixed, an image of the cell can also be acquired, referred to as the Cell Image (Fig. 5f).
-
10
Repeat Steps 84-87 for as many cells as desired. For live-cell imaging, individual cells can also be repeatedly imaged over time to generate time-lapse movies. Alternatively, if the microscope is equipped with a motorized XY stage, multiple cells can be imaged in rapid sequence.
-
11
To analyze traction forces from the acquired images, see Fig. 6 for the general algorithm. Detailed instructions for a custom-written MATLAB program are available upon request.
Figure 6 |.
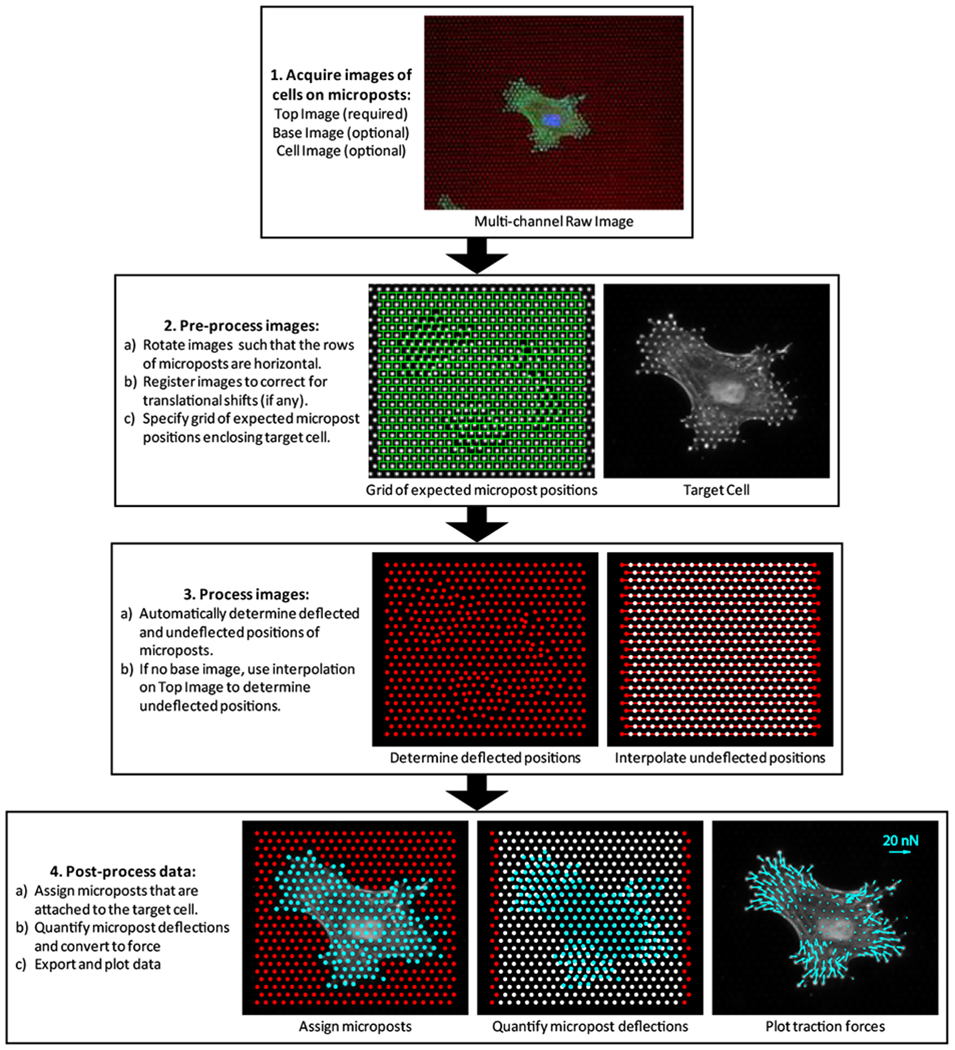
General algorithm for analyzing traction forces from the micropost array substrate. Key steps for analyzing a representative cell are illustrated. Detailed instructions for a custom-written MATLAB program can be supplied upon request.
TIMING
Steps 1-22, Micropost array design and master fabrication: 2 weeks; Steps 1-2: up to 2 wks; Steps 3-22 12 h
Steps 23-34, Micropost array negative mold production: 2.5 h
Steps 35-44, Micropost array substrate fabrication: 22-24 h
Box 1, Supercritical drying of collapsed micropost substrates: 1 h
Steps 45-73, Micropost array substrate functionalization: 4 h
Box 2, Stamp master fabrication for micropatterned functionalization: 2 weeks; Steps 1-2: up to 2 wks; Steps 3-13: 5 h to overnight
Steps 74-80, Cell culture on micropost array substrates: 1-24 h, depends on experiment
Steps 81-89, Imaging cells on micropost array substrates: variable time, depends on experiment
Figure 6, Traction force analysis: variable time, 1-2 min per cell
Box 3, Fixation and immunofluorescence staining of cells on micropost array substrates: 7-8 h
Box 4, Quantification of gene expression in stem cells on micropost array substrates: 3 h
Box 5, Oil Red O staining for adipogenic differentiation of stem cells on micropost array substrates: 1 h
Box 6, Alkaline phosphatase staining for osteogenic differentiation of stem cells on micropost array substrates: 2 h
TROUBLESHOOTING
Table 2 |.
Troubleshooting table
| STEP | PROBLEM | POSSIBLE REASON | SOLUTION |
|---|---|---|---|
| 5, 10, Box 2 (Step 5) | Spin-coated photoresist is not uniform and contains traces of particulates | • Amount of photoresist is not enough. | • Dispense enough photoresist to in the midde of the wafer before spin coating. |
| • Air bubbles or particulates deposited during dispensing. | • Pour directly from the stock bottle or a particulate free container. Wipe the bottle opening with a lint-free Texwipe after each pour to prevent particulate build-up. | ||
| • Wafer surface is not clean. | • Re-clean the wafer with Piranha solution and dry with a stream of N2. If the wafer cannot be completely cleaned, use a new wafer. | ||
| 10, Box 2 (Step 11) | Photoresist pattern on the wafer does not reproduce the photomask features with good fidelity. The most common defects are: 1) Iridescent material along the border of the photoresist-silicon interface is observed. 2) The features in the photoresist do not match the dimensions of the photomask. 3) For SU-8 photoresist, features are wider at the top than at the bottom of the photoresist, known as T-topping. |
• The photoresist is not completely developed. • The photoresist is under- (features are too small) or over-exposed (features are too large). • T-topping is caused by the photoresist absorbing too much short wavelength UV light (< 350 nm) which leads to faster crosslinking of the top part of the photoresist before the bottom can be crosslinked. • The photomask is contaminated. |
• Re-develop the wafer • Optimize the exposure dose. • For SU-8 photoresist, expose through a high-pass filter to diminish light less than 360 nm, such as the U-360 filter. Re-optimize exposure dose to compensate for the filter. • Gently clean the photomask with solvents and then blow dry with N2. |
| 13 | DRIE etching does not reproduce the features on the photomask with good fidelity. | • Severe undercuts occur during DRIE process. | • Double check the DRIE etch recipe. If necessary, adjust the etching parameters to minimize undercuts. |
| • The etch mask (i.e., the photoresist layer) is etched away during DRIE process. | • Spin a thicker layer of photoresist to use as a protective layer. | ||
| 43 | Molds are difficult to peel from the coverslips after curing micropost substrates. | • Molds could be insufficiently silanized if the surface was not completely activated with plasma. | • Optimize the plasma cleaning parameters in Step 33. Tune the resonance frequency to obtain the brightest plasma possible. If the specified power setting cannot be achieved, increase the duration. |
| • Molds have been used several times and have lost some of their silane coating. | • Molds should be re-silanized after 2 castings. Molds that have been used 4 times should be discarded in favor of new molds. | ||
| • Molds with deeper holes are more difficult to peel than molds with shorter holes. | • Score the cast PDMS along the edge of the mold with a razor blade to loosen the mold and make it easier to peel. Additionally, molds can be peeled away under ethanol, although this requires that the substrates be supercritically dried. | ||
| 66 | • Micropost arrays are collapsed after stamping. | • Too much pressure was applied after stamp was placed on top of arrays. | • Apply gentle pressure using blunt tweezers. The weight of the tweezers is sufficient pressure. |
| Micropost arrays have missing regions of posts. | • The act of peeling off the stamp produced compressive forces that collapsed regions of the arrays | • Rather than peel, flick off the stamp so as to not compress the PDMS against the arrays. Submerge the substrate and stamp in ethanol before flicking off the stamp. | |
| • Taller, thinner microposts can be ripped off by sticky 30:1 stamps that have been left in contact on the order of minutes. | • Use 10:1 stamps which are less sticky than 30:1 stamps. | ||
| 78-80 | Cells are not adhering to micropost arrays or are adherent but not spreading. | • This could be a biologically meaningful result. Cells may be sensing the stiffness of the microposts and are unable to spread. | • Test the effect of micropost rigidity on cell adhesion by seeding cells on micropost arrays of varying stiffness. |
| • Fibronectin printing quality was low. | • Stain substrate for fibronectin as described in Box 3 to check whether fibronectin printing was uniform. | ||
| • Cells were over-trypsinized. | • Reduce trypsin concentration and neutralize after the minimal amount of time needed to detach cells. Pellet cells via centrifugation and remove trypsin-containing media. | ||
| • Micropost array spacing is not optimal for the target cell type. | • Optimize the micropost array spacing in the mask design before starting master fabrication. | ||
| 84 | Imaging quality is low in various ways: 1) Illumination is uneven with opposite sides of the field of view being over- and under-focused. 2) Micropost labeling is non-uniform with bright spots due to Dil crystals 3) Dil is present in cellular organelles making it difficult to see microposts under the cell. |
• Substrate is not level, possibly due to casting the negative mold without squeezing out the excess PDMS, or not resetting the set screws in the microscope stage adaptor. • Dil solution is not properly filtered to remove Dil aggregates. • Certain cell types will uptake Dil from the PDMS. The rate of uptake varies from 1 day to up to a week, depending on the cell type. |
• Only use substrates that appear to be level, which can be inspected after cutting off the overflow PDMS in Step 54. Adjust the microscope stage adaptor if necessary. • Filter Dil solution again through a membrane filter • Manually correct micropost positions in traction force analysis (Fig. 6) to compensate for errors due to cellular uptake of Dil. Alternatively, the unprinted regions of the microposts can be fluorescently coated with BSA-Alexa Fluor 594 (see EXPERIMENTAL DESIGN). |
| Box 2 (Step 5) | Spin-coated photoresist is raised along the wafer edge, leading to poor wafer contact with mask aligner. | • More viscous photoresists (e.g., SU8 2050 and higher) tend to bead up along the edge of the wafer, known as ‘edge bead’. | • Remove the edge bead by dispensing 10 mL of PGMEA through a wide-bore syringe needle onto the edge of the wafer while spinning the chuck at 1500 RPM. Angle the syringe away from the center of the wafer and in the direction of rotation. |
| Box 2 (Step 6) | Soft baked photoresist has an uneven wavy pattern. | • Photoresist is either over- or under-baked | • Optimize baking time based on manufacturer’s guidelines. |
| Box 2 (Step 12) | Photoresist pattern delaminates after hard bake. | • For very tall structures (usually greater than 250 μm), thermal stresses during baking will cause the photoresist to bow and peel from the silicon. | • Do not hard bake the wafer. Only use it for PDMS castings at 65°C instead of 110°C where specified. |
ANTICIPATED RESULTS
With this protocol, we have established a library of silicon micropost array masters with a uniform post diameter d of 1.83 μm and post heights 1 spanning from 0.97 to 14.7 μm. These measurements were determined precisely with both the SEM and the surface profilometer, and have standard deviations that are calculated to be less than 8% across the entire wafer. The replica-molded PDMS substrates therefore have a greater than 1,000-fold range of micropost rigidity from 1,556 nN/pm (1=0.97 μm) down to 1.31 nN/pm (1=14.7 μm) (Fig. 2c). In the first example of application of these substrates, the cytoskeletal and focal adhesion organization of cells is visualized on micropost arrays of varying rigidity (Fig. 7). LifeAct-GFP, which labels F-actin, enables live visualization of stress fibers (Fig. 7a). To visualize stress fibers as well as focal adhesions in fixed cells, we can use immunostaining (Fig. 7b–d). After fixation with 3.7% v/v paraformaldehyde, cells are labeled with fluorophore-conjugated phalloidin which stains F-actin. For focal adhesion staining, hMSCs can be further incubated with a primary antibody for vinculin followed by a fluorophore-conjugated, isotype-specific, anti-IgG secondary antibody. After obtaining images of either live or fixed cells on the microposts, quantification of subcellular traction forces can be performed using a custom MATLAB program (Fig. 6). Moreover, focal adhesion areas can be analyzed using suitable segmentation algorithms and applied to further processing of the traction force data 60,103.
Figure 7 |.
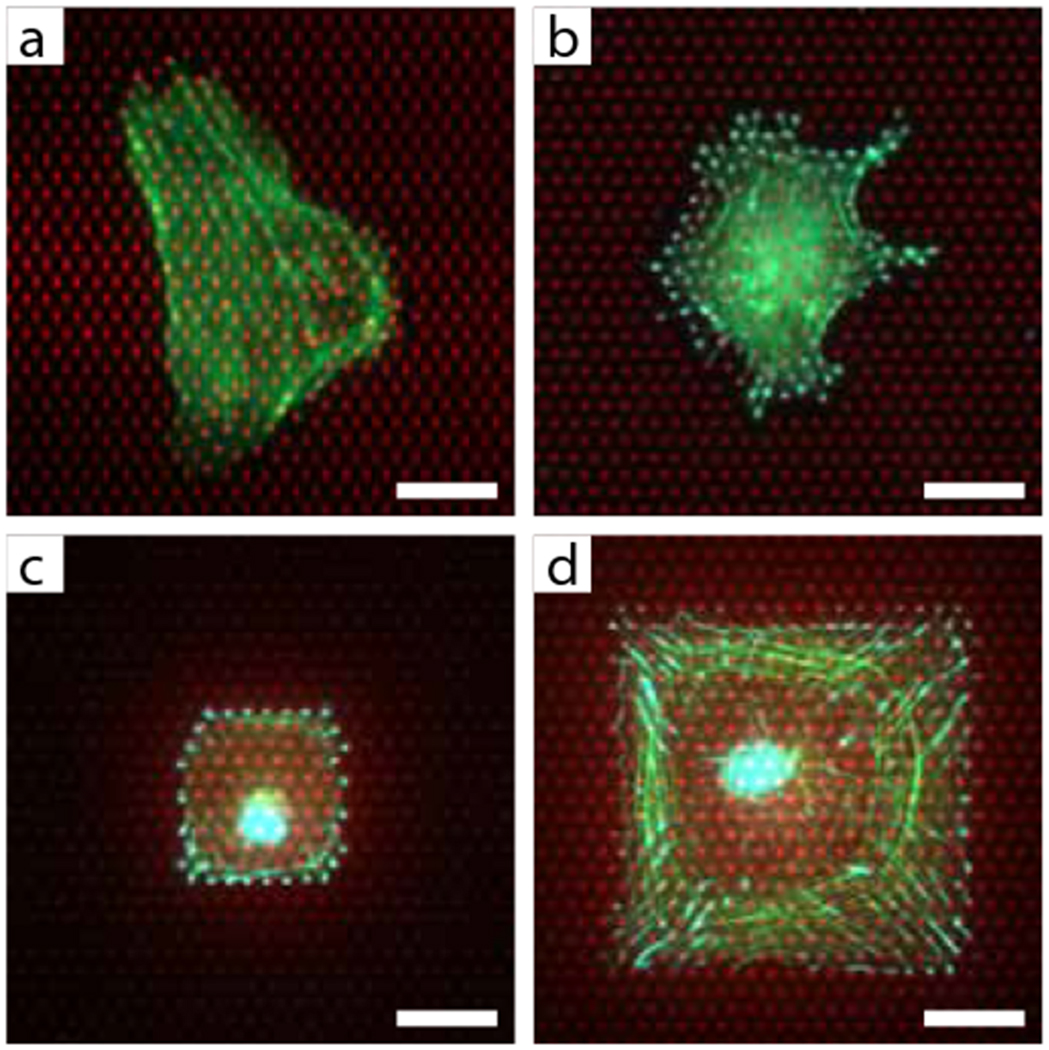
Representative images of cells on microposts, (a) A live cell, expressing LifeAct-GFP to visualize F-actin, on microposts with K = 7.22 nN/μm. (b) A fixed cell, stained for F-actin (green) and vinculin (cyan). K = 3.78 nN/μm. (c) A fixed cell constrained to a 30 μm x 30 μm micropattern and stained for F-actin (green) and vinculin (cyan). K = 18.19 nN/μm. (d) A fixed cell constrained to a 75 μm x 75 μm micropattern and stained for F-actin (green) and vinculin (cyan). K = 15.75 nN/μm. Scale bars are 20 μm.
In the second application, the effect of micropost rigidity on hMSC osteogenesis and adipogenesis is examined. hMSCs are sparsely plated on PDMS micropost arrays with the same post diameter but different heights, and then exposed to mixed differentiation media containing osteogenic and adipogenic inductive factors. After 2 weeks, the hMSCs are fixed and stained for alkaline phosphatase (ALP) activity (for osteogenesis) and lipid droplets (for adipogenesis) (Fig. 8a). The mean percentages of hMSCs expressing osteogenic and adipogenic markers as a function of micropost rigidity are quantified by counting the positively stained cells divided by the total cell number (Fig. 8b). As this example indicates, rigid micropost arrays preferentially induce osteogenic lineage commitment while soft micropost arrays promote adipogenic differentiation in hMSCs.
Figure 8 |.
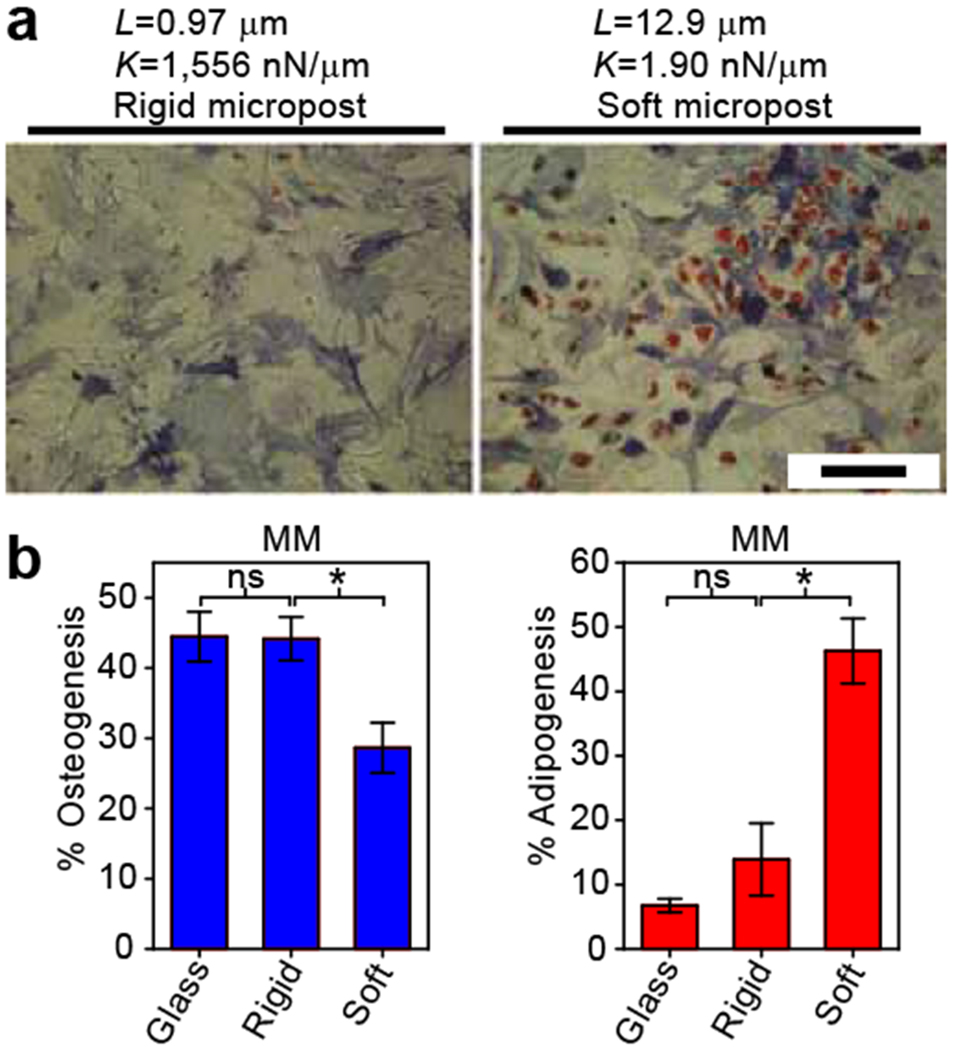
Analysis of stem cell differentiation on micropost array substrates, (a) Micrographs of hMSCs on rigid and soft microposts that have been stained for alkaline phosphatase activity (blue) and lipid droplet formation (red) to indicate osteogenic and adipogenic markers, respectively. L and K indicate the micropost height and spring constant for the substrates shown in the corresponding micrographs. Scale bar is 300 μm. (b) Quantification of percentage of differentiating cells on rigid and soft microposts as well as coverglass as a control. * indicates statistical significance with P < 0.05. n.s. indicates statistical insignificance with P > 0.05. Reprinted with permission 60.
ACKNOWLEDGMENTS
We acknowledge financial support from the National Institutes of Health (EB00262, HL73305, and GM74048), the Army Research Office Multidisciplinary University Research Initiative, the Material Research Science and Engineering Center, the Nano/Bio Interface Center, the Institute for Regenerative Medicine, and the Center for Musculoskeletal Disorders of the University of Pennsylvania, and the New Jersey Center for Biomaterials (RESBIO Resource Center). M.T.Yang was partially supported by the National Science Foundation Integrative Graduate Education and Research Traineeship program (DGE-0221664). J. Fu and Y. Wang were both partially supported by the American Heart Association Postdoctoral Fellowship. R.A.Desai was partially supported by a National Science Foundation Graduate Research Fellowship. We acknowledge the MIT Microsystems Technology Laboratories for support in microfabrication.
Footnotes
COMPETING INTERESTS STATEMENT
The authors declare that they have no competing financial interests.
REFERENCES
- 1.Fuchs E, Tumbar T & Guasch G Socializing with the neighbors: stem cells and their niche. Cell 116, 769–78 (2004). [DOI] [PubMed] [Google Scholar]
- 2.Scadden DT The stem-cell niche as an entity of action. Nature 441, 1075–9 (2006). [DOI] [PubMed] [Google Scholar]
- 3.Jones DL & Wagers AJ No place like home: anatomy and function of the stem cell niche. Nat Rev Mol Cell Biol 9, 11–21 (2008). [DOI] [PubMed] [Google Scholar]
- 4.Morrison SJ & Spradling AC Stem cells and niches: mechanisms that promote stem cell maintenance throughout life. Cell 132, 598–611 (2008). [DOI] [PMC free article] [PubMed] [Google Scholar]
- 5.Guilak F et al. Control of stem cell fate by physical interactions with the extracellular matrix. Cell Stem Cell 5, 17–26 (2009). [DOI] [PMC free article] [PubMed] [Google Scholar]
- 6.Vogel V & Sheetz M Local force and geometry sensing regulate cell functions. Nat Rev Mol Cell Biol 7, 265–75 (2006). [DOI] [PubMed] [Google Scholar]
- 7.Discher DE, Mooney DJ & Zandstra PW Growth factors, matrices, and forces combine and control stem cells. Science 324, 1673–7 (2009). [DOI] [PMC free article] [PubMed] [Google Scholar]
- 8.Mammoto T & Ingber DE Mechanical control of tissue and organ development. Development 137, 1407–1420 (2010). [DOI] [PMC free article] [PubMed] [Google Scholar]
- 9.Emerman JT, Burwen SJ & Pitelka DR Substrate properties influencing ultrastructural differentiation of mammary epithelial cells in culture. Tissue Cell 11, 109–19 (1979). [DOI] [PubMed] [Google Scholar]
- 10.Deroanne CF, Lapiere CM & Nusgens BV In vitro tubulogenesis of endothelial cells by relaxation of the coupling extracellular matrix-cytoskeleton. Cardiovasc Res 49, 647–58 (2001). [DOI] [PubMed] [Google Scholar]
- 11.Engler AJ et al. Myotubes differentiate optimally on substrates with tissue-like stiffness: pathological implications for soft or stiff microenvironments. J Cell Biol 166, 877–87 (2004). [DOI] [PMC free article] [PubMed] [Google Scholar]
- 12.Engler AJ, Sen S, Sweeney HL & Discher DE Matrix elasticity directs stem cell lineage specification. Cell 126, 677–89 (2006). [DOI] [PubMed] [Google Scholar]
- 13.Saha K et al. Substrate modulus directs neural stem cell behavior. Blophys J 95, 4426–38 (2008). [DOI] [PMC free article] [PubMed] [Google Scholar]
- 14.Khatiwala CB, Kim PD, Peyton SR & Putnam AJ ECM compliance regulates osteogenesis by influencing MAPK signaling downstream of RhoA and ROCK. J Bone Miner Res 24, 886–98 (2009). [DOI] [PMC free article] [PubMed] [Google Scholar]
- 15.Gilbert PM et al. Substrate Elasticity Regulates Skeletal Muscle Stem Cell Self-Renewal in Culture. Science 329, 1078–1081 (2010). [DOI] [PMC free article] [PubMed] [Google Scholar]
- 16.Huebsch N et al. Harnessing traction-mediated manipulation of the cell/matrix interface to control stem-cell fate. Nature Materials 9, 518–526 (2010). [DOI] [PMC free article] [PubMed] [Google Scholar]
- 17.Winer JP, Janmey PA, McCormick ΜE & Funaki M Bone marrow-derived human mesenchymal stem cells become quiescent on soft substrates but remain responsive to chemical or mechanical stimuli. Tissue Eng Part A 15, 147–54 (2009). [DOI] [PubMed] [Google Scholar]
- 18.Geiger B, Bershadsky A, Pankov R & Yamada KM Transmembrane crosstalk between the extracellular matrix--cytoskeleton crosstalk. Nat Rev Mol Cell Biol 2, 793–805 (2001). [DOI] [PubMed] [Google Scholar]
- 19.Discher DE, Janmey P & Wang YL Tissue cells feel and respond to the stiffness of their substrate. Science 310, 1139–43 (2005). [DOI] [PubMed] [Google Scholar]
- 20.Ingber DE Cellular mechanotransduction: putting all the pieces together again. Faseb J 20, 811–27 (2006). [DOI] [PubMed] [Google Scholar]
- 21.Orr AW, Helmke BP, Blackman BR & Schwartz MA Mechanisms of mechanotransduction. Dev Cell 10, 11–20 (2006). [DOI] [PubMed] [Google Scholar]
- 22.Clark K, Langeslag M, Figdor CG & van Leeuwen FN Myosin II and mechanotransduction: a balancing act. Trends Cell Biol 17, 178–86 (2007). [DOI] [PubMed] [Google Scholar]
- 23.Peyton SR, Ghajar CM, Khatiwala CB & Putnam AJ The emergence of ECM mechanics and cytoskeletal tension as important regulators of cell function. Cell Biochem Blophys 47, 300–20 (2007). [DOI] [PubMed] [Google Scholar]
- 24.Chen CS Mechanotransduction - a field pulling together? J Cell Sci 121, 3285–92 (2008). [DOI] [PubMed] [Google Scholar]
- 25.Schwartz MA & DeSimone DW Cell adhesion receptors in mechanotransduction. Curr Opln Cell Biol 20, 551–6 (2008). [DOI] [PMC free article] [PubMed] [Google Scholar]
- 26.Geiger B, Spatz JP & Bershadsky AD Environmental sensing through focal adhesions. Nat Rev Mol Cell Biol 10, 21–33 (2009). [DOI] [PubMed] [Google Scholar]
- 27.Choquet D, Felsenfeld DP & Sheetz ΜP Extracellular matrix rigidity causes strengthening of integrin-cytoskeleton linkages. Cell 88, 39–48 (1997). [DOI] [PubMed] [Google Scholar]
- 28.Yeung T et al. Effects of substrate stiffness on cell morphology, cytoskeletal structure, and adhesion. Cell Motil Cytoskeleton 60, 24–34 (2005). [DOI] [PubMed] [Google Scholar]
- 29.Solon J, Levental I, Sengupta K, Georges PC & Janmey PA Fibroblast adaptation and stiffness matching to soft elastic substrates. Biophys J 93, 4453–61 (2007). [DOI] [PMC free article] [PubMed] [Google Scholar]
- 30.Wang N, Butler JP & Ingber DE Mechanotransduction across the cell surface and through the cytoskeleton. Science 260, 1124–7 (1993). [DOI] [PubMed] [Google Scholar]
- 31.Wang N et al. Cell prestress. I. Stiffness and prestress are closely associated in adherent contractile cells. Am J Physiol Cell Physiol 282, C606–16 (2002). [DOI] [PubMed] [Google Scholar]
- 32.Janmey PA & McCulloch CA Cell mechanics: integrating cell responses to mechanical stimuli. Annu Rev Biomed Eng 9, 1–34 (2007). [DOI] [PubMed] [Google Scholar]
- 33.Burridge K & Chrzanowska-Wodnicka M Focal adhesions, contractility, and signaling. Annu Rev Cell Dev Biol 12, 463–518 (1996). [DOI] [PubMed] [Google Scholar]
- 34.Sastry SK & Burridge K Focal adhesions: a nexus for intracellular signaling and cytoskeletal dynamics. Exp Cell Res 261, 25–36 (2000). [DOI] [PubMed] [Google Scholar]
- 35.Bershadsky AD, Balaban NQ & Geiger B Adhesion-dependent cell mechanosensitivity. Annu Rev Cell Dev Biol 19, 677–95 (2003). [DOI] [PubMed] [Google Scholar]
- 36.Wozniak MA, Modzelewska K, Kwong L & Keely PJ Focal adhesion regulation of cell behavior. Biochim Biophys Acta 1692, 103–19 (2004). [DOI] [PubMed] [Google Scholar]
- 37.Giancotti FG & Ruoslahti E Integrin signaling. Science 285, 1028–32 (1999). [DOI] [PubMed] [Google Scholar]
- 38.Flynes RO Integrins: bidirectional, allosteric signaling machines. Cell 110, 673–87 (2002). [DOI] [PubMed] [Google Scholar]
- 39.Schwartz MA & Ginsberg ΜH Networks and crosstalk: integrin signalling spreads. Nat Cell Biol A, E65–8 (2002). [DOI] [PubMed] [Google Scholar]
- 40.Katsumi A, Orr AW, Tzima E & Schwartz MA Integrins in mechanotransduction. J Biol Chem 279, 12001–4 (2004). [DOI] [PubMed] [Google Scholar]
- 41.Berrier AL & Yamada KM Cell-matrix adhesion. J Cell Physiol 213, 565–73 (2007). [DOI] [PubMed] [Google Scholar]
- 42.Flynes RO The extracellular matrix: not just pretty fibrils. Science 326, 1216–9 (2009). [DOI] [PMC free article] [PubMed] [Google Scholar]
- 43.Riveline D et al. Focal contacts as mechanosensors: externally applied local mechanical force induces growth of focal contacts by an mDial-dependent and ROCK-independent mechanism. J Cell Biol 153, 1175–86 (2001). [DOI] [PMC free article] [PubMed] [Google Scholar]
- 44.Galbraith CG, Yamada KM & Sheetz ΜP The relationship between force and focal complex development. J Cell Biol 159, 695–705 (2002). [DOI] [PMC free article] [PubMed] [Google Scholar]
- 45.Shemesh T, Geiger B, Bershadsky AD & Kozlov ΜM Focal adhesions as mechanosensors: a physical mechanism. Proc Natl Acad Sci USA 102, 12383–8 (2005). [DOI] [PMC free article] [PubMed] [Google Scholar]
- 46.Sawada Y et al. Force sensing by mechanical extension of the Src family kinase substrate pl30Cas. Cell 127, 1015–26 (2006). [DOI] [PMC free article] [PubMed] [Google Scholar]
- 47.Harris AK, Wild P & Stopak D Silicone rubber substrata: a new wrinkle in the study of cell locomotion. Science 208, 177–9 (1980). [DOI] [PubMed] [Google Scholar]
- 48.Lee J, Leonard M, Oliver T, Ishihara A & Jacobson K Traction forces generated by locomoting keratocytes. J Cell Biol 127, 1957–64 (1994). [DOI] [PMC free article] [PubMed] [Google Scholar]
- 49.Pelham RJ Jr. & Wang Y High resolution detection of mechanical forces exerted by locomoting fibroblasts on the substrate. Mol Biol Cell 10, 935–45 (1999). [DOI] [PMC free article] [PubMed] [Google Scholar]
- 50.Dembo M & Wang YL Stresses at the cell-to-substrate interface during locomotion of fibroblasts. Biophys J 76, 2307–16 (1999). [DOI] [PMC free article] [PubMed] [Google Scholar]
- 51.Galbraith CG & Sheetz ΜP A micromachined device provides a new bend on fibroblast traction forces. Proc Natl Acad Sci USA 94, 9114–8 (1997). [DOI] [PMC free article] [PubMed] [Google Scholar]
- 52.Balaban NQ et al. Force and focal adhesion assembly: a close relationship studied using elastic micropatterned substrates. Nat Cell Biol 3, 466–72 (2001). [DOI] [PubMed] [Google Scholar]
- 53.Tan JL et al. Cells lying on a bed of microneedles: an approach to isolate mechanical force. Proc Natl Acad Sci U S A 100, 1484–9 (2003). [DOI] [PMC free article] [PubMed] [Google Scholar]
- 54.Butler JP, Tolic-Norrelykke IM, Fabry B & Fredberg JJ Traction fields, moments, and strain energy that cells exert on their surroundings. Am J Physiol Cell Physiol 282, C595–605 (2002). [DOI] [PubMed] [Google Scholar]
- 55.Schwarz US et al. Calculation of forces at focal adhesions from elastic substrate data: the effect of localized force and the need for regularization. Biophys J 83, 1380–94 (2002). [DOI] [PMC free article] [PubMed] [Google Scholar]
- 56.Willert CE & Gharib M Digital Particle Image Velocimetry. Experiments in Fluids 10, 181–193 (1991). [Google Scholar]
- 57.Sabass B, Gardel ML, Waterman CM & Schwarz US High resolution traction force microscopy based on experimental and computational advances. Biophys J 94, 207–20 (2008). [DOI] [PMC free article] [PubMed] [Google Scholar]
- 58.du Roure O et al. Force mapping in epithelial cell migration. Proc Natl Acad Sci USA 102, 2390–5 (2005). [DOI] [PMC free article] [PubMed] [Google Scholar]
- 59.Yang ΜT, Sniadecki ΝJ & Chen CS Geometric considerations of micro- to nanoscale elastomeric post arrays to study cellular traction forces. Advanced Materials 19, 3119–3123 (2007). [Google Scholar]
- 60.Fu JP et al. Mechanical regulation of cell function with geometrically modulated elastomeric substrates. Nature Methods 7, 733-NIL_95 (2010). [DOI] [PMC free article] [PubMed] [Google Scholar]
- 61.Georges PC & Janmey PA Cell type-specific response to growth on soft materials. J Appl Physiol 98, 1547–53 (2005). [DOI] [PubMed] [Google Scholar]
- 62.Taipale J & KeskiOja J Growth factors in the extracellular matrix. Faseb Journal 11, 51–59 (1997). [DOI] [PubMed] [Google Scholar]
- 63.Storm C, Pastore JJ, Mackintosh FC, Lubensky TC & Janmey PA Nonlinear elasticity in biological gels. Nature 435, 191–194 (2005). [DOI] [PubMed] [Google Scholar]
- 64.Wen Q, Basu A, Winer JP, Yodh A & Janmey PA Local and global deformations in a strain-stiffening fibrin gel. New Journal of Physics 9, - (2007). [Google Scholar]
- 65.Houseman BT & Mrksich M The microenvironment of immobilized Arg-Gly-Asp peptides is an important determinant of cell adhesion. Biomaterials 22, 943–55 (2001). [DOI] [PubMed] [Google Scholar]
- 66.Keselowsky BG, Collard DM & Garcia AJ Integrin binding specificity regulates biomaterial surface chemistry effects on cell differentiation. Proc Natl Acad Sci USA 102, 5953–7 (2005). [DOI] [PMC free article] [PubMed] [Google Scholar]
- 67.Mei Y et al. Combinatorial development of biomaterials for clonal growth of human pluripotent stem cells. Nature Materials 9, 768–778 (2010). [DOI] [PMC free article] [PubMed] [Google Scholar]
- 68.Saez A, Buguin A, Silberzan P & Ladoux B Is the mechanical activity of epithelial cells controlled by deformations or forces? Biophysical Journal 89, L52–L54 (2005). [DOI] [PMC free article] [PubMed] [Google Scholar]
- 69.Ghibaudo M et al. Traction forces and rigidity sensing regulate cell functions. Soft Matter 4, 1836–1843 (2008). [Google Scholar]
- 70.Pelham RJ Jr. & Wang Y Cell locomotion and focal adhesions are regulated by substrate flexibility. Proc Natl Acad Sci U S A 94, 13661–5 (1997). [DOI] [PMC free article] [PubMed] [Google Scholar]
- 71.Wang N et al. Mechanical behavior in living cells consistent with the tensegrity model. Proc Natl Acad Sci U S A, 98, 7765–70 (2001). [DOI] [PMC free article] [PubMed] [Google Scholar]
- 72.Nelson CM et al. Emergent patterns of growth controlled by multicellular form and mechanics. Proc Natl Acad Sci U S A 102, 11594–9 (2005). [DOI] [PMC free article] [PubMed] [Google Scholar]
- 73.Ruiz SA & Chen CS Emergence of patterned stem cell differentiation within multicellular structures. Stem Cells 26, 2921–7 (2008). [DOI] [PMC free article] [PubMed] [Google Scholar]
- 74.Liu ZJ et al. Mechanical tugging force regulates the size of cell-cell junctions. Proceedings of the National Academy of Sciences of the United States of America 107, 9944–9949 (2010). [DOI] [PMC free article] [PubMed] [Google Scholar]
- 75.Sniadecki NJ et al. Magnetic microposts as an approach to apply forces to living cells. Proc Natl Acad Sci U S A 104, 14553–8 (2007). [DOI] [PMC free article] [PubMed] [Google Scholar]
- 76.Saez A, Ghibaudo M, Buguin A, Silberzan P & Ladoux B Rigidity-driven growth and migration of epithelial cells on microstructured anisotropic substrates. Proc Natl Acad Sci U S A 104, 8281–6 (2007). [DOI] [PMC free article] [PubMed] [Google Scholar]
- 77.Rabodzey A, Alcaide P, Luscinskas FW & Ladoux B Mechanical forces induced by the transendothelial migration of human neutrophils. Biophys J 95, 1428–38 (2008). [DOI] [PMC free article] [PubMed] [Google Scholar]
- 78.Liu ZJ, Sniadecki NJ & Chen CS Mechanical Forces in Endothelial Cells during Firm Adhesion and Early Transmigration of Human Monocytes. Cellular and Molecular Bioengineering 3, 50–59 (2010). [DOI] [PMC free article] [PubMed] [Google Scholar]
- 79.Ganz A et al. Traction forces exerted through N-cadherin contacts. Biol Cell 98, 721–30 (2006). [DOI] [PubMed] [Google Scholar]
- 80.Liang XM, Han SJ, Reems J-A, Gao D & Sniadecki NJ Platelet retraction force measurements using flexible post force sensors. Lab on a Chip 10 (2010). [DOI] [PMC free article] [PubMed] [Google Scholar]
- 81.Saez A et al. Traction forces exerted by epithelial cell sheets. Journal of Physics-Condensed Matter 22, 9 (2010). [DOI] [PubMed] [Google Scholar]
- 82.Lemmon CA et al. Shear force at the cell-matrix interface: enhanced analysis for microfabricated post array detectors. Mech Chem Blosyst 2, 1–16 (2005). [PMC free article] [PubMed] [Google Scholar]
- 83.Holst J et al. Substrate elasticity provides mechanical signals for the expansion of hemopoietic stem and progenitor cells. Nat Biotechnol 28, 1123–8. [DOI] [PubMed] [Google Scholar]
- 84.Adamo L et al. Biomechanical forces promote embryonic haematopoiesis. Nature 459, 1131–5 (2009). [DOI] [PMC free article] [PubMed] [Google Scholar]
- 85.Chowdhury F et al. Material properties of the cell dictate stress-induced spreading and differentiation in embryonic stem cells. Nat Mater 9, 82–8. [DOI] [PMC free article] [PubMed] [Google Scholar]
- 86.Evans ND et al. Substrate stiffness affects early differentiation events in embryonic stem cells. Eur Cell Mater 18, 1–13; discussion 13-4 (2009). [DOI] [PubMed] [Google Scholar]
- 87.Reinhart-King CA, Dembo M & Hammer DA Cell-cell mechanical communication through compliant substrates. Biophys J 95, 6044–51 (2008). [DOI] [PMC free article] [PubMed] [Google Scholar]
- 88.Krishnan R et al. Reinforcement versus fluidization in cytoskeletal mechanoresponsiveness. PLoS One 4, e5486 (2009). [DOI] [PMC free article] [PubMed] [Google Scholar]
- 89.Laermer F & Schilp A in Robert Bosch GmbH (Robert Bosch GmbH, U.S. Patent No. 5,501,893).
- 90.Sniadecki NJ & Chen CS Microfabricated silicone elastomeric post arrays for measuring traction forces of adherent cells. Methods Cell Biol 83, 313–28 (2007). [DOI] [PubMed] [Google Scholar]
- 91.Madou MJ Fundamentals of Microfabrication (CRC Press, Boca Raton, FL, 2002). [Google Scholar]
- 92.Yang ΜT, Sniadecki NJ & Chen CS Geometric considerations of micro- to nanoscale elastomeric post arrays to study cellular traction forces. Adv Mater 19, 3119–3123 (2007). [Google Scholar]
- 93.Zhao Y, Lim CC, Sawyer DB, Liao RL & Zhang X Cellular force measurements using single-spaced polymeric microstructures: isolating cells from base substrate. J Micromech Microeng 15, 1649–1656 (2005). [Google Scholar]
- 94.Schoen I, Hu W, Klotzsch E & Vogel V Probing Cellular Traction Forces by Micropillar Arrays: Contribution of Substrate Warping to Pillar Deflection. Nano Letters 10, 1823–1830 (2010). [DOI] [PMC free article] [PubMed] [Google Scholar]
- 95.Addae-Mensah KA et al. A flexible, quantum dot-labeled cantilever post array for studying cellular microforces. Sensors and Actuators a-Physical 136, 385–397 (2007). [Google Scholar]
- 96.Fuard D, Tzvetkova-Chevolleau T, Decossas S, Tracqui P & Schiavone P Optimization of poly-di-methyl-siloxane (PDMS) substrates for studying cellular adhesion and motility. Microelectronic Engineering 85, 1289–1293 (2008). [Google Scholar]
- 97.Qin D, Xia YN & Whitesides GM Soft lithography for micro- and nanoscale patterning. Nature Protocols 5, 491–502 (2010). [DOI] [PubMed] [Google Scholar]
- 98.Delamarche E, Schmid H, Michel B & Biebuyck H Stability of molded polydimethylsiloxane microstructures. Advanced Materials 9, 741–746 (1997). [Google Scholar]
- 99.Tan JL, Tien J & Chen CS Microcontact printing of proteins on mixed self-assembled monolayers. Langmuir 18, 519–523 (2002). [Google Scholar]
- 100.Tan JL, Liu W, Nelson CM, Raghavan S & Chen CS Simple approach to micropattern cells on common culture substrates by tuning substrate wettability. Tissue Engineering 10, 865–872 (2004). [DOI] [PubMed] [Google Scholar]
- 101.Ye HK, Gu ZY & Gracias DH Kinetics of ultraviolet and plasma surface modification of poly(dimethylsiloxane) probed by sum frequency vibrational spectroscopy. Langmuir 22, 1863–1868 (2006). [DOI] [PubMed] [Google Scholar]
- 102.Freshney RI Culture of Animal Cells: A Manual of Basic Technique (Wiley-Liss, Hoboken, NJ, 2005). [Google Scholar]
- 103.Zamir E et al. Molecular diversity of cell-matrix adhesions. Journal of Cell Science 112, 1655–1669 (1999). [DOI] [PubMed] [Google Scholar]