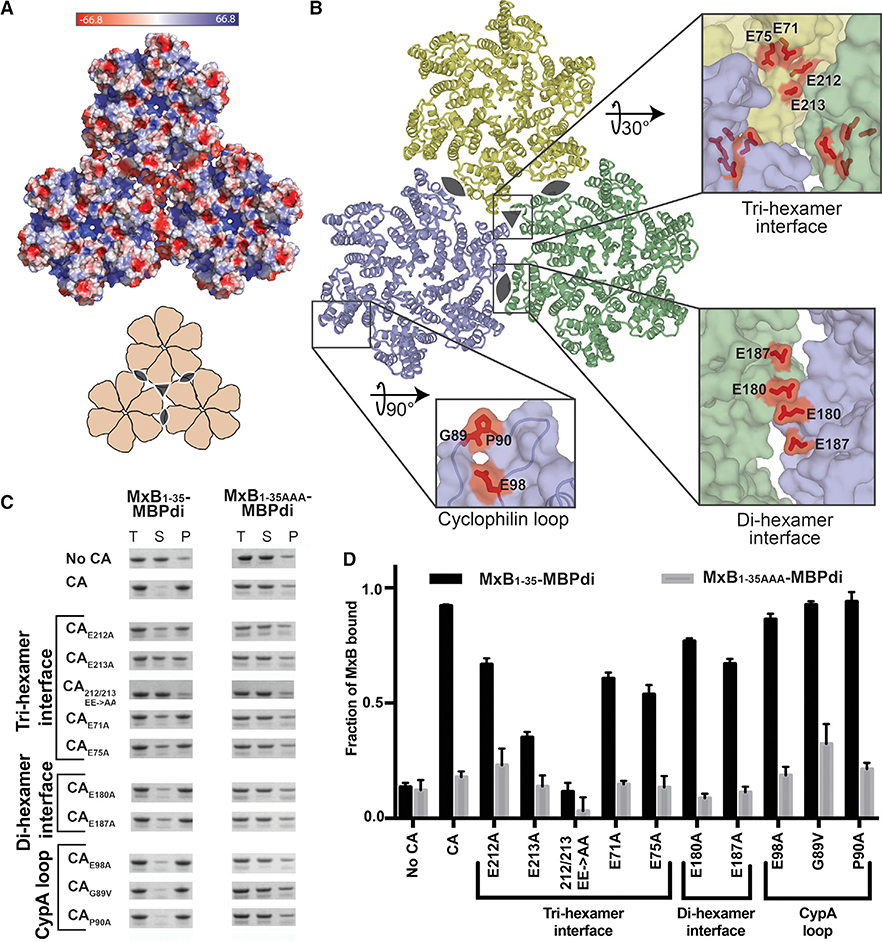
Figure 2. The MxB Binding Site on Capsid Maps to the Tri-hexamer Interface.
(A) Surface electrostatic potential distribution of three CA hexamers (PDB: 4XFX) shows the negative charge at the interfaces between the hexamers (major), and in the CypA-binding loop (minor). A cartoon (bottom) shows the overall arrangement of hexamers and the symmetry axes at the di-hexamer (cat eyes) and tri-hexamer (triangle) interfaces.
(B) Location of CA residues selected for mutation. CA hexamers (surface) are shown in light blue, light yellow, and light green. Residues selected for mutation are shown in red sticks.
(C) MxB1–35-MBPdi binding to CA tube variants in co-pelleting assays. The total, soluble, and pellet fractions were analyzed by SDS-PAGE. For simplicity, only the MxB1–35-MBPdi band is shown. MxB1–35AAA-MBPdi is used as a negative control. A notable reduction in MxB binding is observed for CAE213A, CAE71A, CAE75A, and CA212/213 EE->AA. Positive and negative controls performed with MBP-CCCyp and MBP, respectively, can be found in Figure S3. Full gels can be found in Figure S2.
(D) Quantification of data in (C), performed as in Figure 1. Error bars represent the standard error of the mean from three independent experiments. Full gels can be found in Figure S1 (one replicate of “No CA” and “CA”), Figure S2, and Figure S3. Quantification of controls can be found in Figure S3.

