Abstract
Systemic sclerosis (SSc-scleroderma) is an autoimmune disorder with high mortality rate that results in excessive accumulation of collagen in the skin and internal organs. Currently, the modified Rodnan Skin Score (mRSS) is the gold standard for evaluating the dermal thickening due to SSc. However, mRSS has noticeable inter- and intra-observer variabilities as quantified by the interclass correlation coefficient (ICC: 0.6–0.75). In this work, optical coherence elastography (OCE) combined with structural optical coherence tomography (OCT) image analysis was used to assess skin thickness in 12 SSc patients and healthy volunteers. Inter- (ICC: 0.62–0.99) and intra-observer (ICC > 0.90) assessment of OCT/OCE showed excellent reliability. Clinical assessments, including histologically assessed dermal thickness (DT), mRSS, and site-specific mRSS (SMRSS) were also performed for further validation. The OCE and OCT results from the forearm demonstrated the highest correlation (OCE: 0.78, OCT: 0.65) with SMRSS. Importantly, OCE and OCT had stronger correlations with the histological DT (OCT: r = .78 and OCE: r = .74) than SMRSS (r = .57), indicating the OCT/OCE could outperform semi-quantitative clinical assessments such as SMRSS. Overall, these results demonstrate that OCT/OCE could be useful for rapid, noninvasive and objective assessments of SSc onset and monitoring skin disease progression and treatment response.
Keywords: modified Rodnan Skin Score, optical coherence elastography, optical coherence tomography, scleroderma, skin thickness, surface wave, systemic sclerosis
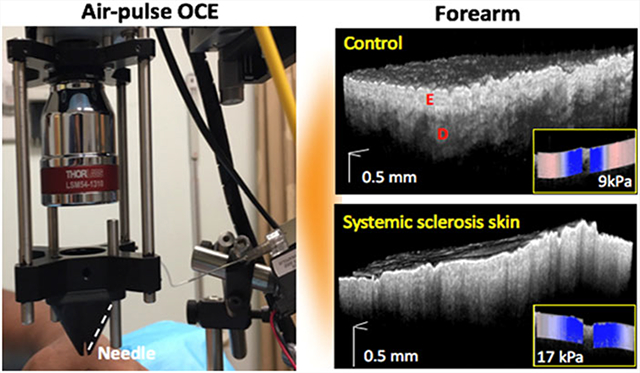
Graphical Abstract
1 |. INTRODUCTION
Systemic sclerosis (SSc-scleroderma) is an autoimmune disease associated with widespread fibrosis of skin and internal organs [1]. SSc is a rare disorder but has high mortality [2]. The extent of skin involvement affects quality of life, and an improvement in skin thickening is correlated with a positive prognosis [3]. Moreover, internal organ involvement is generally associated with skin thickening, and therefore, measurements of skin thickness are a primary assessment of SSc severity [4]. Currently, the modified Rodnan Skin Score (mRSS) is one of the gold standard for evaluating SSc progression. The mRSS relies on manual palpation at 17 sites on the body, and the skin thickness at each site is scored on a scale from 0 to 3, where 0 is normal and 3 is severe thickening. However, obtaining the mRSS can be time consuming and is dependent on the experience of the physician. Thus, the mRSS has inherent inter- (interclass correlation coefficient [ICC]: 0.63–0.68) [5] and intra-observer (ICC: 0.74–0.76) [6] variabilities. Moreover, it lacks sensitivity to small changes in skin thickness and can be insensitive to borderline severities. Therefore, a quantitative, rapid, and objective diagnostic approach for SSc thickness is a unmet clinical need and would represent an important step forward in SSc research and clinical care [7].
Ultrasound imaging (UI) has been used to assess the dermal thickness (DT) and echogenicity in SSc patients, which has been validated with the site-specific mRSS (SMRSS) performed by an experienced dermatologist [8]. Hesselstrand et al reported moderate correlations of UI-assessed skin thickness and an SMRSS of 0.37, 0.72 and 0.65 for the finger, hand and forearm, respectively. At the same sites, the correlation of skin echogenicity with the SMRSS was −.40, −.47 and −.46, respectively [9]. Both assessments demonstrated excellent inter- and intra-observer reliability, with ICCs often higher than 0.8 [10, 11]. In addition, ultrasound elastography (UE) has been proposed to detect the skin stiffness in SSc patients [12, 13]. Preliminary results of skin stiffness show excellent intra-observer reliability (ICC > 0.78) and stronger correlation with SMRSS, .75, .55, and .68, for the finger, hand and forearm, respectively [14]. Recently, Yang et al reported high correlation of the skin stiffness (r = .89) with mRSS [15]. However, the performance of ultrasound has not been compared to histological DT.
Optical coherence tomography (OCT) is a noninvasive depth-resolved imaging modality that provides micrometerscale spatial resolution with ~1 mm penetration depth in skin [16, 17]. Pathological evidence during SSc progression has been observed from the epidermal-dermal junction (EDJ) in a fibrosis murine model [18] and patients [19], which can be imaged by OCT. Previous work demonstrated the correlation of OCT-assessed optical density in the papillary dermis with local mRSS evaluated from the forearm (r = −.66 to −0.7) and finger (r = −.55) [19, 20]. Furthermore, tissue structural properties can be quantitatively characterized by various parameters based on the OCT structural images, such as fractal analysis [21], optical attenuation [22], and spatial speckle analyses [23]. With the superior spatial resolution of OCT, optical coherence angiography [17] has promising potential to image microangiopathy severity in SSc patients since SSc also has a substantial vasculopathic component [24]. However, previous work utilizing both OCT- and UI/UE-based modalities lacks criterion validation [4], which requires correlating measurements with histologically measured DT from skin biopsies [25].
In addition to structural imaging, the biomechanical properties of tissue can be assessed with the elastographic functional extension of OCT, optical coherence elastography (OCE) [26, 27]. Other techniques, such as durameter or vesmeter skin characterization, assess skin thickness after application of pressure, but measurements are confounded by variations in the applied pressure since skin has nonlinear elastic properties [28, 29]. Previously, we demonstrated the first use of in vivo air-pulse OCE to quantify skin elasticity changes in murine dermal fibrosis model resembling features of SSc [18]. Results of this bleomycin-induced dermal fibrosis murine models demonstrated the potential for reliable assessment of SSc skin involvement using OCE. Particularly, the results showed that OCE could be effective for in vivo imaging. Here, we demonstrate the first use of a combined OCT and OCE analysis [30] for skin thickness assessment in SSc patients and healthy volunteers. The combined OCT and OCE analyses were compared to clinical assessments (DT evaluated by skin biopsy and histological analysis, mRSS and SMRSS) where the skin biopsy was the “gold standard” to verify the criterion validity [4]. Our results show that OCT and OCE are highly reliable and repeatable and can objectively and noninvasively detect the differences in skin structure and stiffness at different SSc severities, and in some cases, even outperform the current clinical gold standard (ie, mRSS). Due to the noncontact and objective nature, high spatial resolution, and sensitivity to mechanical contrast, OCT combined with OCE can be a powerful tool for detecting SSc onset, monitoring skin thickness progression, and evaluating response to treatment.
2 |. MATERIALS AND METHODS
2.1 |. Subjects
Twelve subjects participated in the imaging studies at the UT Health Rheumatology clinic in Houston, TX. There were four healthy controls (C1-C4) and four patients (P1-P4) that were diagnosed with SSc and recruited from the clinic. Additionally, four heathy volunteers were recruited to conduct inter- and intra-observer reliability tests.
2.2 |. PhS-OCE system
The OCT system at the heart of the OCE system was composed of a superluminescent diode (Inphenix, California) with a central wavelength of 1280 and 95 nm bandwidth, Michelson-type interferometer, and a spectrometer as illustrated in Figure 1A. The power on the sample was 9 mW with a system sensitivity of 97 dB. The axial resolution was ~7 μm with a displacement stability of ~1 nm. The objective lens (LSM54–1310, Thorlabs, New Jersey), placed after the galvanometer-mounted mirrors (GVSM002, Thorlabs), resulted in a lateral resolution of 19 μm. The interference spectrum was collected by a line-scan InGaAs camera (GL2048R, Sensors Unlimited, New Jersey) with a line-scan rate of 70 kHz. An air-pulse delivery system was incorporated for OCE imaging using a 3D-printed cone-shaped nozzle to eliminate the risk of skin damage from contact between the air-pulse port and the subjects as shown in Figure 1B. The air-pulsed delivery system was synchronized with the OCT system [31] via a pulse delay generator (PDG). The hardware was organized and installed in a mobile cart for imaging patients easily in the clinic as shown in Figure 1C. The air-pulse pressure was controlled by a pneumatic valve and was monitored with an air pressure gauge, and the pressure was less than 5 Pa on the skin [31]. The OCT sample arm was integrated with a 3D-motorized translational stage and controlled by the home-made OCT imaging software that can co-register OCT/OCE images with real-time switching between OCT and OCE modes. The imaging time per site, including one 3D OCT structural scan (~3 minutes) and five OCE line measurements (~2 minutes), was less than 5 minutes.
FIGURE 1.
Clinical phase-sensitive OCE system. (A) Schematic representation of the OCE system and (B) the sample imaging arm with the cone-shaped nozzle used for OCE measurements on the patient, where the red arrow indicates the connection of the plastic tube with the air-pulse needle. (C) The clinical system stored in a cart. Comp., computer; GV, galvanometer-mounted mirror scanner driver; PDG, pulse delay generator; SC, stage controller
2.3 |. Experimental procedure
OCT and OCE imagings were performed at three sites for each patient: the dorsal forearm, the hand and the third proximal phalanx (middle finger). A 2-cm circle was marked on the dorsal forearm and a 1-cm circle was marked on the skin of hand and middle finger to ensure that OCT and OCE imagings were performed on the same region. The clinical examination, including skin biopsy for histological DT assessment, SMRSS and mRSS, were independently performed on the forearm right after the OCT and OCE measurements for the first eight study participants (four healthy and four diseased). In addition, OCT, OCE and SMRSS assessments were performed on the dorsal hand and middle finder. Additionally, four healthy volunteers were recruited to participate in inter- and intra-observer reliability tests of the OCT and OCE assessments.
2.4 |. OCT and OCE analysis
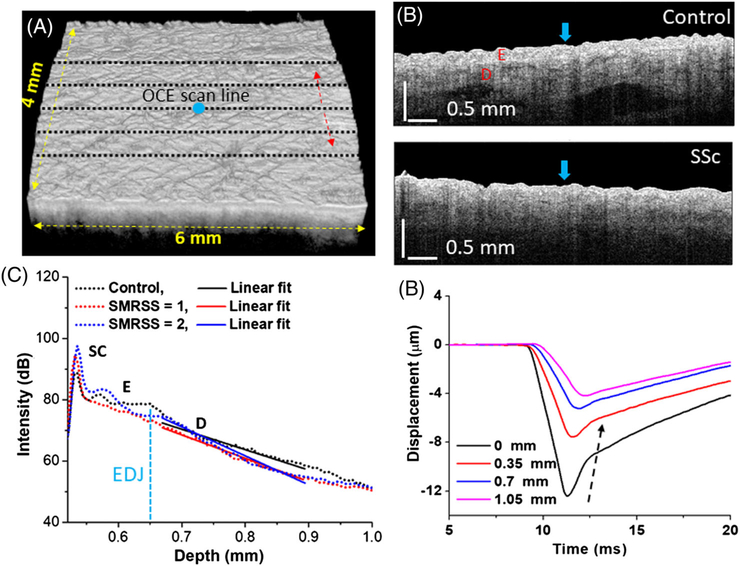
A 3D OCT scan of 6 mm (fast axis) × 4 mm (slow axis), composed of 3000 A-scans per image and 400 frames per volume, was performed before the OCE imaging, as shown in Figure 2A. An OCE imaging was performed by acquiring successive M-mode images (N = 251) over a 6-mm scan line (M-B-mode imaging), where the air-pulse excitation was at the center of the scan [31], as shown in Figure 2B. There were five OCE measurements, indicated by the black dashed lines in Figure 2A, taken with 0.67 mm spacing along the slow axis of the OCT scan, as indicated by the red arrow in Figure 2A. Typical OCT structural images of a healthy volunteers and SSc patient are shown in Figure 2B. Since the scattering is dominating over absorption in the near-infrared wavelengths utilized by the OCT system [22], the scattering coefficient in the dermis layer can be approximated by calculating the OCT signal slope (OCTSS) [30] using a fixed computational window size of 0.22 mm beneath the EDJ. For SSc patients, the fitting window was started at 0.13 mm beneath the skin surface due to unclear EDJ. A greater value of the OCTSS corresponds to a greater scattering in the skin. To minimize the bias of OCTSS caused by defocusing and sensitivity roll-off, the reference arm position was aligned at the same optical path during the entire study. The intensity of reference arm was adjusted at half of the saturation limit on camera. During data acquisition, the skin surface was flattened such that the surface variation was less than ~0.3 mm (in air), which was ~35% of the depth of focus (~0.88 mm). The A-lines were averaged per frame to calculate the OCTSS in the dermis region as plotted in Figure 2C, where higher SMRSS scores show a steeper slope of the linear fits. The five frames corresponding to OCE scanning locations were retrieved for OCTSS process.
FIGURE 2.
OCT/OCE acquisition and data processing. (A) 3D OCT scan co-aligned with (black dashed lines) OCE scans and (B) OCT images of typical control and SSc subjects, where the air-pulse excitations are indicated by the blue arrows. The epidermal and dermal layers are labeled as E and D, respectively. (C) Example OCT A-line with linear fits to obtain the OCTSS in the dermis. (D) Temporal displacement profiles of the air-pulse-induced elastic wave propagation at indicated distances from the air-pulse excitation from a healthy subject, and the black dashed arrow demonstrates the propagation of the elastic wave
During OCE imaging, the elastic wave was generated by a focused micro-air-pulse from the center of the scan region [31], which is indicated by the blue arrow in Figure 2B. Displacement profiles at the labeled distances from the air-pulse excitation are plotted in Figure 2D. The displacement profiles were obtained from phase of the complex OCT signal and converted to displacement. The phase data within the skin was corrected due to the motion of the skin surface and refractive index mismatch between the skin and air [32]. The elastic wave group velocity was calculated by a cross-correlation-based algorithm [33]. To quantify the skin stiffness, the elastic wave velocity, cg, was translated to Young’s modulus, E, based on the surface wave equation, E = 2ρcg2(1 + ν)3/(0.87 + 1.12ν)2, where ρ = 1040 kg/m3 was the skin density, and ν = 0.47 was the Poisson’s ratio. Since the excitation was at the middle of the imaged region, the Young’s moduli from both sides were averaged.
2.5 |. Correlation analysis of OCT/OCE with clinical diagnosis
Correlation analysis of OCT/OCE with clinical diagnosis was conducted based on the four healthy controls and four patients. The mean Young’s modulus and OCTSS, averaged from five positions, were correlated patientwise with clinical skin scores and DT using Spearman correlation analysis. To differentiate the healthy controls from SSc patients, a Mann-Whitney U test was utilized to test the significant difference (P < .05) of OCT and OCE assessments between the healthy controls including additional volunteers (N = 8) and SSc patients (N = 4).
2.6 |. Inter- and intra-observer reliability study
Four healthy volunteers participated in inter- and intra-observer reliability testing. The ICC was calculated [34] to investigate the reliability of OCTSS and OCE, where the level of reliability is considered excellent, good, fair and poor when 0.75 < ICC < 1, 0.6 < ICC < 0.75, 0.4 < ICC < 0.6 and ICC < 0.4, respectively [35]. A one-way random effect model was used because the system effect on the data is negligible based on the F test (P > .05) [35]. The intra-observer validation of the OCTSS and OCE analysis was first performed on the patients successively without a break, and then again by performing successive measurements with a 5-minute break between measurements. Patients removed their arms from the imaging stage during the short breaks. Similarly, the patients took a 5-minute break for inter-observer measurements when switching the imaging operator. The secondary operator received a 1-week training prior to the experiments. Finally, Bland-Altman analysis for repeatability, including calculation of the 95% confidence interval of the disagreement between repeated measurements, also known as the limits of agreement (LoA), was performed [36].
3 |. RESULTS
3.1 |. OCTSS analysis
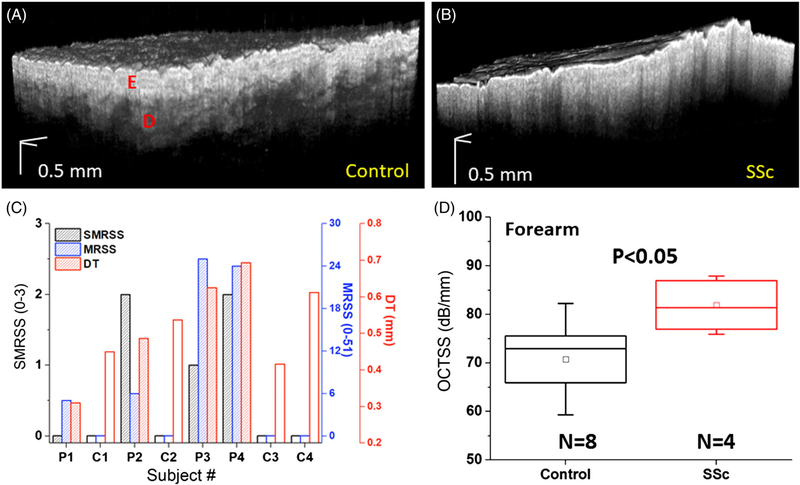
The EDJ is an identifiable structure in the skin that is clearly altered during SSc progression, as shown in Figures 2B and 3A,B, where the SMRSS of the healthy and the SSc subject were diagnosed as 0 and 2, respectively. In contrast to healthy skin, the OCT image of the SSc skin shows a more homogenous structure with an unclear EDJ. Data are presented as the mean ± inter-sample SD unless otherwise noted.
FIGURE 3.
Results of 3D OCT scans and clinical assessments. A 3D OCT volume of a typical (A) healthy and (B) SSc-affected forearms. The clinical diagnoses of SMRSS, MRSS, and DT are plotted in (C), where the controls are marked with open bars, and SSc-affected subjects are marked with shaded bars. (D) The OCTSS of healthy and SSc-affected forearms, where the box is the median and interquartile range, the inscribed box is the mean, and the whiskers are 1SD
Results of clinical examination are organized in Figure 3C, where the open and shaded bars are the healthy (subject C1, C2, C3 and C4) and SSc (subject P1, P2, P3 and P4) patients, respectively. C4 had significantly thicker skin due to extensive sun exposure and was specially recruited to test the OCE performance. The correlation of the SMRSS was r = .83 (P = .047) with the mRSS, and was r = .57 (P = .142) with the DT. For the OCT analysis shown in Figure 3D, OCTSS was measured as 71.1 ± 12.4 dB/mm for the controls and 81.9 ± 5.8 dB/mm for the SSc group (P < .05), revealing that SSc patients has stronger optical scattering as measured by OCT.
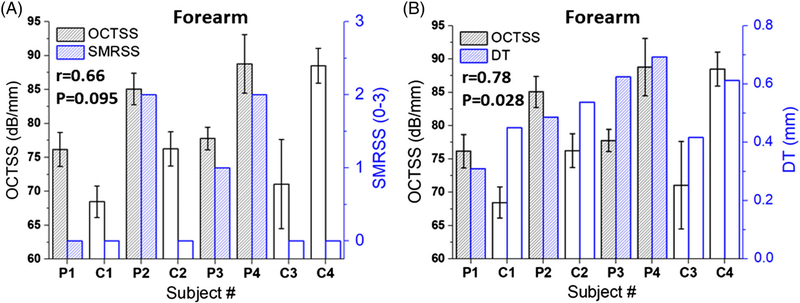
As plotted in Figure 4A, the OCTSS had a correlation of r = .66 (P = .095) with SMRSS, showing that OCTSS has construct validity [4]. Furthermore, OCTSS had a correlation of .78 (P = .028) with histological DT, indicating that it has criterion validity [4], which was also stronger than the correlation observed between SMRSS and histological DT (r = .57, P = .142). These results indicate that OCTSS is a sensitive method to detect skin thickness in SSc.
FIGURE 4.
OCT results compared with clinical assessments. (A) OCTSS versus SRMSS and (B) OCTSS versus DT. The Spearman correlation coefficient and its statistical P-value are noted
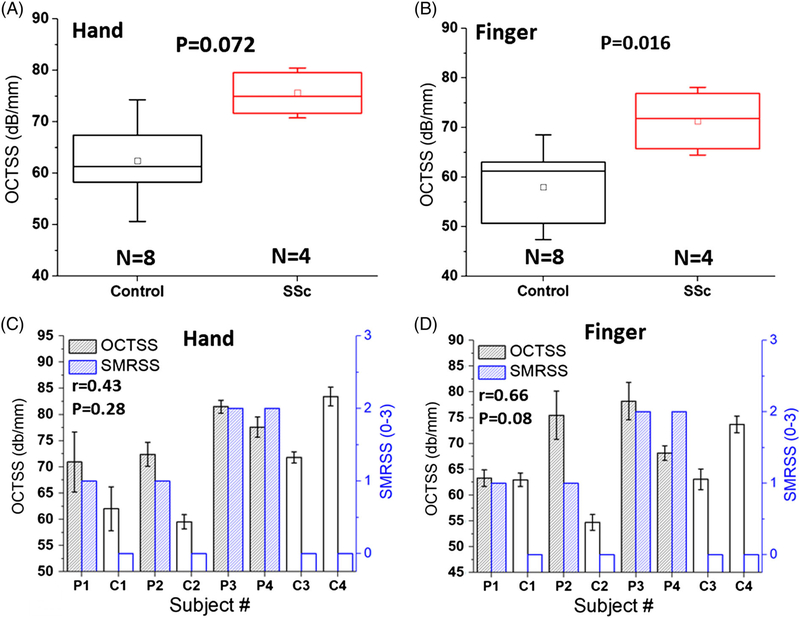
The OCTSS, as shown in Figure 5A, of the SSc-affected subjects measured from the hand (75.5 ± 5.1 dB/mm) were higher, but not significantly different from the healthy subjects (62.5 ± 11.9 dB/mm, P = .072). However, the OCTSS measurements from the finger depicted in Figure 5B were significantly different (P = .016) between the SSc patients (71.3 ± 6.9 dB/mm) and healthy controls (57.9 ± 10.6 dB/mm). The correlations between OCTSS and the SMRSS for the hand and finger were r = .43 (P = .281) and r = .66 (P = .081), respectively, as shown in Figure 5C,D. After excluding C4 due to its special condition as organized in Table 1, the correlation between OCTSS and SMRSS from the hand and finger increased to r = .85 (P = .03) and r = .87 (P = .02) respectively, showing that OCTSS can be an effective metric for detecting SSc not only on the forearm but also on the hand and finger.
FIGURE 5.
Results of OCTSS measured on the dorsum of the hand and finger. The boxplot of OCTSS and correlation analysis are presented in (A,B) and (C,D), respectively. The error bars (C,D) represent intra-sample measurements (n = 5)
TABLE 1.
Correlation of OCT and OCE with clinical assessments from different imaging sites
| Spearman correlation | ||||||
|
| ||||||
|
Forearm |
Hand |
Finger |
||||
| Parameters | Correlation | P-value | Correlation | P-value | Correlation | P-value |
| SMRSS vs DT | .57 | .14 | ||||
| OCTSS vs DT | .78 | .028 | ||||
| OCTSS vs SMRSS | .65 | .095 | .43 | .281 | .66 | .081 |
| OCE vs DT | .74 | .045 | ||||
| OCE vs SMRSS | .78 | .047 | .59 | .138 | .59 | .138 |
| Spearman correlation (excluding C4) | ||||||
|
| ||||||
|
Forearm |
Hand |
Finger |
||||
| Parameters | Correlation | P-value | Correlation | P-value | Correlation | P-value |
| SMRSS vs DT | .67 | .11 | ||||
| OCTSS vs DT | .75 | .07 | ||||
| OCTSS vs SMRSS | .90 | .02 | .85 | .03 | .87 | .02 |
| OCE vs DT | .75 | .06 | ||||
| OCE vs SMRSS | .90 | .02 | .77 | .06 | .64 | .13 |
Correlation analysis was performed by Spearman correlation analysis.
3.2 |. OCE analysis
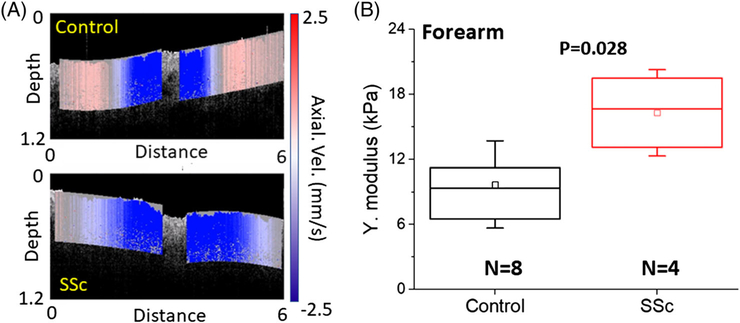
Frames from videos of the elastic wave propagation in the healthy participants and SSc patients are presented in Figure 6A. The Young’s moduli were measured as 9.7 ± 3.9 kPa for the healthy subjects and 16.4 ± 3.9 kPa for SSc patients, as plotted in Figure 6B, where the SSc-affected skin was significantly stiffer than the healthy skin (P = .028).
FIGURE 6.
(A) Frames from the videos of elastic wave propagation (Video S1) in a typical healthy and SSc subjects (SMRSS = 2) and (b) the OCE-estimated Young’s moduli. The skin stiffness was statistically significant as tested by Mann-Whitney U test
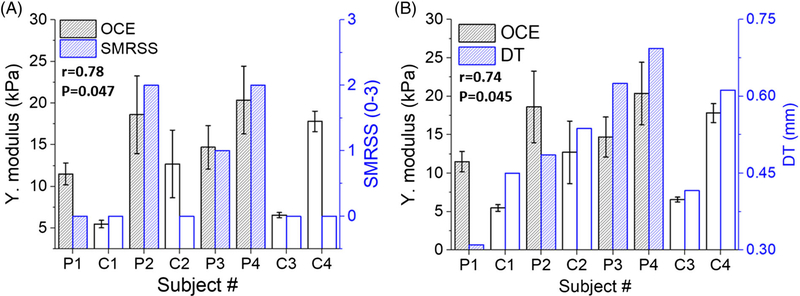
The Young’s modulus detected by OCE had a correlation of r = .78 (P = .047) with SMRSS, as illustrated in Figure 7A, and was stronger than the correlation between OCTSS and SMRSS (r = .65, P = .095). The correlation between OCE and histological DT, r = .74 (P = .045), is plotted in Figure 7B, and outperformed the correlation between SMRSS and histological DT (r = .57, P = .14).
FIGURE 7.
The (A) OCE-estimated Young’s modulus versus (A) dermal thickness, (B) SMRSS. The correlation between the two parameters and its statistical significance is indicated in each plot
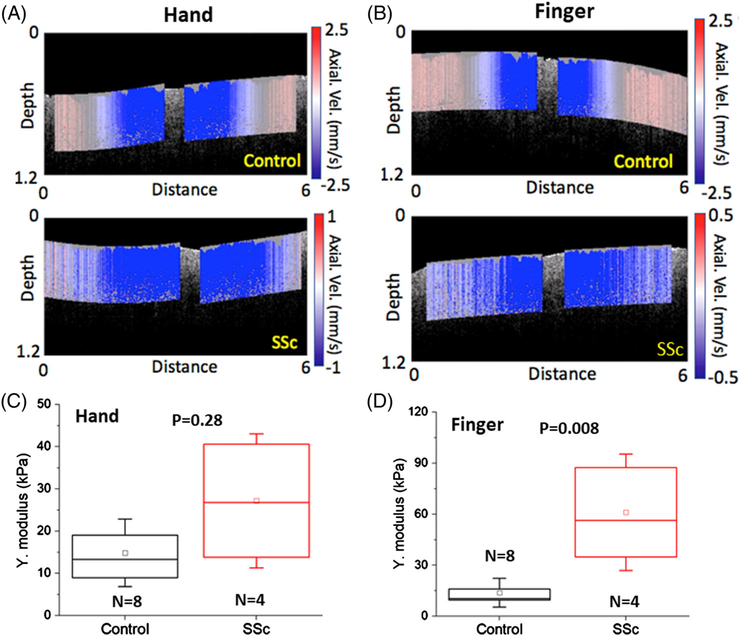
Still frames from the videos of the elastic wave propagation measured from the dorsal hand and finger are presented in Figure 8A,B. As plotted in Figure 8C, the Young’s moduli of the control and SSc skin on the hand were estimated as 15.1 ± 7.8 and 27.1 ± 16.1 kPa, respectively, and were not significantly different (P = .28). The Young’s moduli of the control and SSc finger skin were 14.3 ± 7.7 and 61.1 ± 33.9 kPa, respectively, and were significantly different (P = .008), as depicted in Figure 8D.
FIGURE 8.
The OCE results measured from the hand and finger. Still frames from the elastic wave propagation videos in the (A, Video S2) hand and (B, Video S3) finger of (top) healthy and (bottom) SSc-affected patient. The OCE-estimated Young’s modulus of (C) hand and (D) finger
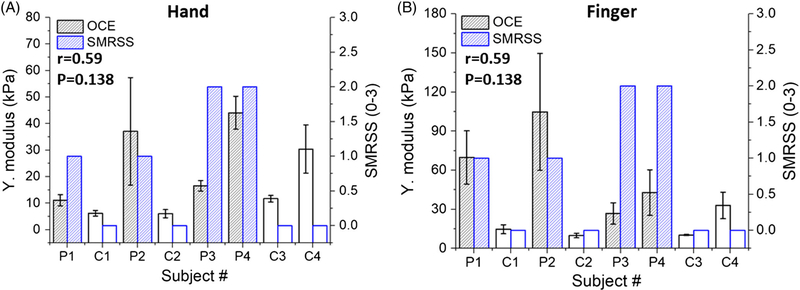
Figure 9 shows that the correlation between the Young’s modulus and SMRSS was r = .59 (P = .138) from the dorsal hand skin, and r = .59 (P = .138) as measured from the middle finger. However, the correlation for the hand and middle finger increased to r = .77 (P = .06) and r = .64 (P = .13) after excluding C4 due to significant sun exposure-related skin damage.
FIGURE 9.
The correlation between OCE-estimated Young’s modulus and SMRSS measured on the (A) hand and (B) finger. The correlation between the two parameters and its statistical significance is indicated in each plot
3.3 |. Intra- and inter-observer OCT and OCE reliability
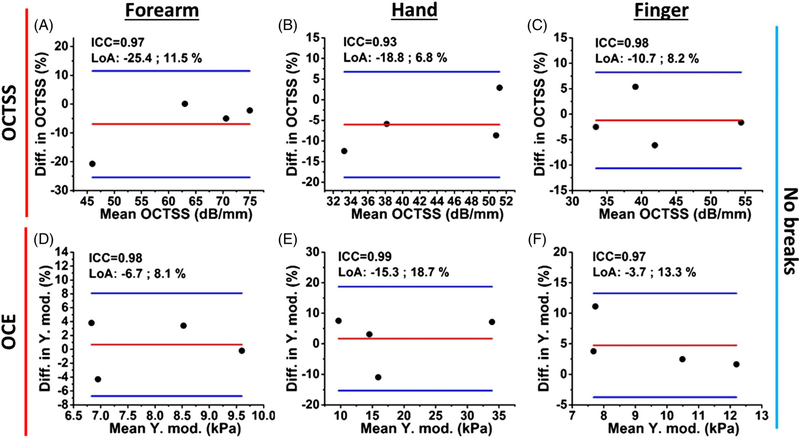
Normalized Bland-Altman plots of the intra-observer reliability with no break between successive measurements are shown in Figure 10. Four healthy subjects were imaged. The OCTSS and OCE results demonstrate excellent reliability as quantified by the ICC (OCTSS range: 0.93–0.98; OCE range: 0.97–0.99) and high repeatability. The results are detailed in Table 2.
FIGURE 10.
Normalized Bland-Altman plots of successive intra-observer (A-C) OCTSS and (D-F) OCE-estimated Young’s modulus with no break between measurements. The interclass correlation coefficient (ICC) and limits of agreement (LoA) are noted on each figure
TABLE 2.
Intra- and inter-observer reliability results of OCTSS and OCE from different imaging sites
| ICC for OCTSS and OCE | |||||||
|---|---|---|---|---|---|---|---|
| Measurement type | Forearm |
Hand |
Finger |
||||
| OCTSS | OCE | OCTSS | OCE | OCTSS | OCE | ||
| Intra-observer | Continuous | 0.97 | 0.98 | 0.93 | 0.99 | 0.98 | 0.97 |
| Intra-observer | 5 min break | 0.94 | 0.76 | 0.94 | 0.95 | 0.98 | 0.95 |
| Intra-observer | 5 min break | 0.88 | 0.89 | 094 | 0.62 | 0.97 | 0.85 |
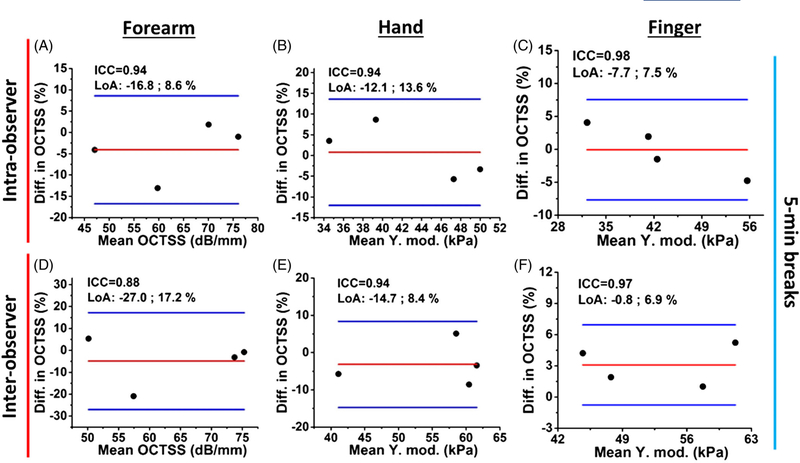
Figure 11 reports the OCTSS results of intra- and inter-observer OCTSS reliability testing with 5-minute breaks between successive measurements. The ICCs of OCTSS demonstrate excellent reliabilities, where intra- and inter-observer reliability had ICC ranges of 0.94–0.98 and 0.88–0.97, respectively.
FIGURE 11.
Normalized Bland-Altman plots of the OCTSS from (A-C) intra- and (D-F) inter-observer successive measurements with a 5-minute break between measurements
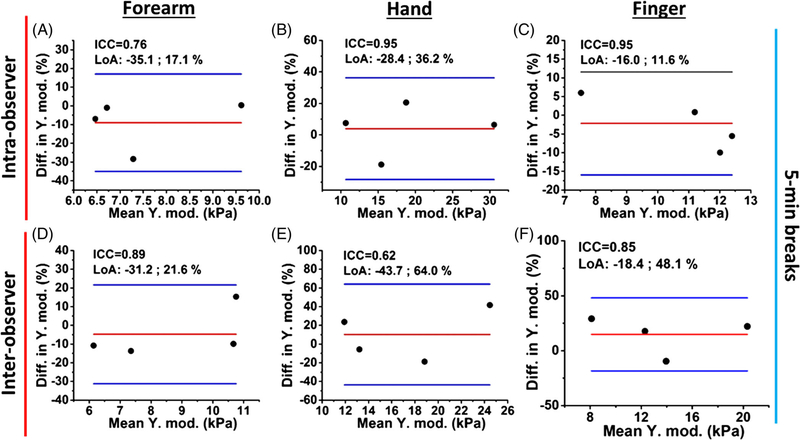
The OCE inter- and intra-observer reliability results, with 5-minute breaks between successive measurements, are illustrated in Figure 12. The intra-observer reliabilities of the OCE-estimated Young’s modulus of the forearm, hand, and finger skin were excellent (ICC range: 0.76–0.95). The inter-observer measurements show excellent and good reliability also from the forearm (ICC = 0.89), hand (ICC = 0.62) and finger site (ICC = 0.85).
FIGURE 12.
Normalized Bland-Altman plots of the OCE-estimated Young’s modulus of the skin from (A-C) intra- and (D-F) inter-observer successive measurements with a 5-minute break between measurements
4 |. DISCUSSION
In this work, we utilized OCT structural imaging analysis and OCE measurements to monitor the skin involvement of SSc in human subjects. From the forearm, the results of OCTSS and OCE demonstrate a strong correlation with the SMRSS (OCTSS: r = .65, OCE: r = .78). Moreover, OCTSS and OCE has strong correlation with histological DT (OCTSS: r = .78, OCE: r = .74), which outperformed the correlation of SMRSS, as assessed by an experienced physician, with DT (r = .57). In addition, OCT and OCE demonstrated promising potential to detect SSc, based on the correlation with SMRSS, in the hand (OCTSS: r = .43 and OCE: r = .59) and finger (OCTSS: r = .66 and OCE: r = .59), although the correlation values are likely biased negatively due to the severe skin damage of C4. Nevertheless, the preliminary results show that estimating the skin scattering coefficient by OCTSS analysis and Young’s modulus by OCE have construct validity and criterion validity for SSc skin assessment Furthermore, both techniques demonstrated excellent intra-observer reliability (OCTSS: ICC > 0.93 and OCE: ICC > 0.98) and outperformed the intra-observer reliability of well-trained physicians (ICC = 0.74–0.76) [6]. Therefore, OCT and OCE have clear advantage of objectivity while still being completely noninvasive tools for SSc skin assessment.
The high correlation of OCE with DT measured in the forearm, as plotted in Figure 7, is due to the existence of the subcutaneous fat beneath the dermis. The probing depth of the elastic wave can be approximated by the wavelength, thus corresponding to a certain distance beneath the skin surface [37–39]. The air-pulse-induced displacement is a broadband signal (~0–800 Hz) [40]. With a wave speed of ~2 m/s and a central frequency of ~400 Hz, the corresponding wavelength was ~5 mm, which is long enough to reach the subcutaneous fat in the hypodermis region [41]. Hence, a thicker dermis resulted in a faster elastic wave, because of the absence of subcutaneous fat within the probing range of the elastic wave. In addition, for detecting the subtle progression of SSc, OCTSS and OCE provided more sensitive detection than SMRSS performed by an experienced physician. According to the SMRSS and DT in Figure 3C, subject P1 had the thinnest DT with no SSc involvement found in the forearm while OCTSS and OCE successfully detected subtle changes as demonstrated by higher values than control subjects C1 and C3. Interestingly, the Young’s modulus of P2 (SMRSS = 2) shown in Figure 6 was higher than subject P3 (SMRSS = 1) who had a thicker DT, which is also consistently found in the OCTSS analysis shown in Figure 4. These results suggest that the disease progression at SMRSS = 2, with more dermal collagen accumulation, dominates the change in stiffness rather than the DT. This finding points to future techniques that can probe the biomechanical properties of the dermis, such as by increasing the excitation frequency of the elastic wave up to 5 kHz [37, 38]. However, more work is needed to confirm this hypothesis and is the next step of our research.
On the other hand, the long wavelength is also why there was a relatively weaker correlation of the OCE results and DT in the hand and finger as compared to the forearm. The lower correlations in the hand and finger are most likely due to the fact that the skin was thinning and tethered to the underlying structures due to the loss of subcutaneous fat in the atrophic phase of SSc progression [4]. Therefore, OCE detected lower Young’s moduli at severe SMRSS conditions because of the relaxed muscle that is less stiff than the skin [42]. In addition, the future focus of this preliminary study is aimed at performing a longitudinal study to monitor the SSc progression in the same patient based on the DT. Hence, we also reported results excluding subject C4 since the DT was an outlier due to the damaged skin due to prolonged sun exposure. Excluding subject C4, both methods achieve high correlation (r = .9, P = .02) in the forearm site, and the OCTSS of the hand and finger sites had a strong and significant correlation with the SMRSS (hand: r = .85, P = .03; finger: r = .87, P = .02). However, OCE did not show a strong or significant correlation on the hand (r = .77, P = .06) and finger (r = .64, P = .13) due to the boundary condition beneath the dermis and long wavelength of the elastic wave. Thus, the next step of our work is to induce elastic waves with higher frequencies to avoid the boundary effect to improve the detection of SSc at later stages.
The intra-observer measurements with no break were performed with four healthy volunteers (Figure 10), where the imaged sites were not moved during the measurements. Here, the objectivity of the OCTSS and OCE assessments resulted in excellent reliability in the forearm (OCTSS: ICC = 0.97, OCE: ICC = 0.98), hand (OCTSS: ICC = 0.93, OCE: ICC = 0.99) and finger (OCTSS: ICC = 0.98 and OCE: ICC = 0.97). For the intra-observer measurements with 5-minute breaks illustrated in Figures 11A–C and 12A–C the OCTSS (ICC > 0.94) and OCE (ICC range: 0.76–0.95) had excellent reliability, while the Young’s moduli detected from the forearm had a lower reliability (ICC = 0.76) due to the changes in position by the motion of the volunteers. As OCE is highly sensitive to the underlying structure of the imaged location, we will install an aiming laser to enable much more accurate alignment and repeatable imaging.
In the inter-observer study presented in Figures 11D–F and 12D–F, the imaged region was re-adjusted by different operators and thus, had lower reliability (OCTSS ICC range: 0.88–0.97, OCE ICC range: 0.62–0.89) as compared with the intra-observer assessments as shown in Figure 10 (OCTSS ICC:0.93–0.98, OCE ICC:0.97–0.99). The inter-observer reliability measured from the dorsum of the hand in Figure 12E is lower and both optical assessments do not have a significant difference between the healthy and diseased subjects as plotted in Figures 5A and 8C. This may be due to positioning the hand differently between the operators. The imaged area of the hand was only a few milli-meters away from the joints, where the detected stiffness can be easily affected by varying skin tension according to hand positioning. Similarly, for OCTSS analysis, the changes in the skin tension based on hand positioning may lead to the redistribution of the unbound fluid within the tissue, which could subsequently affect the microstructure detected by the OCTSS. Previous work has demonstrated that the optical properties of skin can be affected by an external mechanical stimulation [21]. Therefore, imaging an area sufficiently far away from movable joints and incorporating an aiming laser with the current setup may enhance the sensitivity and reliability of OCT and OCE to accurately monitor SSc progression. Nevertheless, our results show that OCTSS is less sensitive to hand positioning than OCE, as observed in Table 1.
Moreover, comparing Young’s moduli among Figures 6B and 8C,D, the proximity of the bone and absence of subcutaneous fat is the likely reason there was a higher OCE-estimated Young’s modulus in the dorsal hand and finger than the forearm, which has a good agreement with the recent work [43]. Due to the skin tethering (ie, fat loss) caused by SSc, the Young’s modulus of the finger in SSc patients was two times higher than that of the hand, showing the compounded effect of the boundary condition from the bone and SSc skin stiffness. Thus, our future work is focused on developing techniques for higher excitation frequencies corresponding to shorter wavelengths that are less sensitive to boundary conditions.
There are several limitations of the current OCT and OCE setup. The imaging depth of the OCT system is currently limited to the papillary dermis, but the pathological features of SSc (eg, dermal thickening) generally progress in reticular dermis. As mentioned earlier, the wavelength of the air-pulse-induced elastic wave is relatively long, limiting its performance in tethered skin, especially for the later stages of SSc (eg, fibrotic and atrophic phase) in the hand and finger [4]. In the clinic, diagnosis of skin tethering relies on the palpation experience of the physician, and the mRSS does not score tethering. Therefore, future work will focus on developing a Quadrate Swept Source OCT system [44] that incorporates a booster optical amplifier and piezoelectric transducer-based elastography system to image up to 2 mm deep in the skin [44, 45] and to measure the stiffness within the dermis by exciting elastic waves up to 5 kHz [46, 47]. We hypothesize that the combination of an improved OCT structural imaging that can capture the entire reticular dermis with the OCE-based stiffness assessment will improve our ability to accurately and reliably measure skin fibrosis in SSc.
5 |. CONCLUSION
We demonstrated the use of OCTSS analysis and air-pulsed-based OCE for monitoring SSc involvement at different severities in the forearm, hand and finger of a small sample of patients and controls. The results of both the OCTSS- and OCE-estimated Young’s modulus demonstrated high correlation with SMRSS, as measured by an experienced physician, and have construct validity, as shown in Table 1. Furthermore, both optical assessments have criterion validity and had a stronger correlation with DT (OCTSS: r = .78, OCE: r = .74) than the physician-assessed SMRSS (r = .57). Moreover, both techniques demonstrated high intra-observer reliability (OCTSS: ICC > 0.93, OCE: ICC > 0.98) and generally showed excellent or good inter-observer reliability (OCTSS: ICC range: 0.88–0.97; OCE: ICC range: 0.62–0.89). Our results of the optical imaging assessments demonstrate the advantages of its noncontact and objective nature, high spatial resolution, and sensitivity to the changes of optical and biomechanical properties of skin caused by SSc. The proposed OCT and OCE techniques can be a powerful tool for SSc onset detection, progression monitoring and therapy evaluation.
Supplementary Material
ACKNOWLEDGMENTS
This work was supported in part by National Institute of Health grants 2R01EY022362, 1R01HL130804.
Funding information
National Institutes of Health, Grant/Award Numbers: 2R01EY022362, 1R01HL130804
Abbreviations
- DT
dermal thickness
- ICC
interclass correlation
- mRSS
modified Rodnan Skin Score
- OCE
optical coherence elastography
- OCTSS
optical coherence tomography signal slope
- OCT
optical coherence tomography
- SMRSS
site-specified modified Rodnan Skin Score
- SSc
systemic sclerosis
- UE
ultrasound elastography
- UI
ultrasound imaging
Biography

Chih-Hao Liu received his B.S. degree in electrical engineering from National Taiwan University of Science and Technology (2010) and finished his M.S. degree in Biomedical Engineering from National Taiwan University, Taipei, Taiwan (2013). He is currently a Ph.D. candidate in the Department of Biomedical Engineering at University of Houston. His research interests focus on system development of Optical Coherence Tomography technique (Elastography), automated fringe analysis, tissue biomechanics, imaging processing, and machine learning classification.

Prof. Shervin Assassi has completed his rheumatology fellowship and internal medicine post-graduate training at the University of Texas Health Science Center at Houston (UTHealth), Houston, USA. He has received his medical degree from the Albert Ludwig University in Freiburg/Germany. He was voted by his colleagues and faculty as Resident of the Year in 2003 and was elected to the Alpha Omega Medical Society in the same year. He has received a Clinical Investigator Fellowship Award from the American College of Rheumatology in 2006. He is board certified in rheumatology. He sees patients in the UT Professional Building clinic and is the co-director of the Scleroderma Program at McGovern Medical School. Dr. Assassi is also an active researcher; his current research interests include correlation of clinical features of systemic sclerosis with genetic and gene expression data to identify novel therapeutic targets and to develop clinically useful prediction models for response to treatment. He has a master’s degree in Clinical Research and holds an adjunct appointment in the School of Biomedical Informatics. His research program has received funding from the National Institute of Health, Scleroderma Foundation, and the DoD. Dr. Assassi is also the course director of the Translational Research Workshop in the Masters’ in Clinical Research Program.

Dr. Manmohan Singh received his Ph. D. in Biomedical Engineering from the University of Houston, Houston, USA in 2018. He is currently a National Library of Medicine Fellow in Training in the Department of Biomedical Engineering, also at the University of Houston. Since the fall of 2010, Manmohan has been with Dr. Kirill Larin’s Biomedical Optics Laboratory. His research interests include utilizing biomedical imaging for the detection and monitoring of diseases and utilizing and developing new elastographic methods for investigating the biomechanical properties of tissues.
Christopher Smith received his B.S. in Biomedical Engineering from the University of Houston, Houston, USA in 2019. He started research in the Biomedical Optics Laboratory under Dr. Kirill Larin in the fall of 2017. While there, his research focused on using Optical Coherence Elastography to mechanically characterize biological tissue in relation to clinical diseases

Dr. Alexander Schill received his Ph.D. in Chemical Physics from the Georgia Institute of Technology, Atlanta, USA in 2006 and has more than 20 years combined academic and industry experience working in optics and scientific instrumentation. He completed his post-doctoral work at the University of Maryland, Baltimore County and the U.S. Army Research Lab. His industry experience includes >6 years as a Development Engineer at Coherent, Inc. (Santa Clara, CA) and Senior Laser Scientist at National Energetics (Austin, TX). He joined the University of Houston in 2014 as a Senior Research Scientist and is currently Principal Instrument Designer serving the departments of Optometry, Vision Science and Biomedical Engineering. His research interests include biomedical optics, state-of-the-art laser sources, and development of new OCT applications.

Prof. Salavat Aglyamov received the B.S. and M.S. degrees in applied mathematics in 1991 and 1993, respectively, from Moscow State University, Moscow, Russia. He received the Ph.D. degree in biophysics in 1999 from the Institute of Theoretical and Experimental Biophysics, Pushchino, Moscow region, Russia. From 2001 to 2002 he worked in the Biomedical Ultrasound Lab at the University of Michigan, Ann Arbor, as a postdoctoral fellow, where he was engaged in mathematical modeling of behavior of the soft biological tissue under externally applied loading and as a research associate in the Department of Biomedical Engineering at the University of Texas at Austin. He joined University of Houston as Research Assistant Professor of Mechanical Engineering in 2017. He has authored more than 60 peer-reviewed publications and chapters in two books. His research interests are in the areas of tissue biomechanics, elasticity imaging, photoacoustics and applied mathematics.

Prof. Chandra Mohan Following his medical training in Pathology and Rheumatology at the National University of Singapore and the Singapore General Hospital in Singapore, Dr. Mohan undertook his doctoral thesis work focusing on the cellular immunology of lupus at Tufts University, Boston, USA. His post-doctoral training had focused on the genetic analysis of murine lupus. As an independent investigator, his laboratory’s research efforts have concentrated on elucidating the cellular, molecular, and genetic players leading to murine lupus, with corresponding translational studies in human lupus. His more recent work has focused on translating findings from basic biology towards the early diagnosis of end-organ involvement in autoimmune diseases. Dr. Mohan’s ongoing studies are aimed at tapping leads from proteomic and metabolomic platforms to mine new biomarkers and targets in chronic rheumatic diseases. He currently holds the Cullen Distinguished Professorship at the University of Houston, in Houston, TX. Dr. Mohan is an elected member of the American Society of Clinical Investigation and the Henry Kunkel Society. He has published >175 articles, largely in the area of autoimmune diseases.

Kirill V. Larin is Professor of Biomedical Engineering at the University of Houston, Houston, USA. He also holds joint appointments at the College of Optometry and Department of Physiology and Biophysics at Baylor College of Medicine. Larin received his first M.S. in Laser Physics and Mathematics from the Saratov State University, Russia in 1995, his second M.S. in Cellular Physiology and Molecular Biophysics in 2001 and Ph.D. in Biomedical Engineering in 2002 from the University of Texas Medical Branch. His research contributions are in Biomedical Optics and Biophotonics and development and application of various optical methods for noninvasive and nondestructive imaging and diagnostics of tissues and cells. Larin has authored more than 150 peer-reviewed publications and chapters in ten textbooks on Biomedical Optics. He is the recipient of prestigious Presidential Award from Russian President Boris Yeltsin. He has also received Wallace Coulter Young Investigator Translation Award, Office of Naval Research Young Investigator Award, Outstanding Young Investigator Award from the Houston Society for Engineers in Medicine and Biology, and Herbert Allen Award from American Society for Mechanical Engineers. Larin currently serves as an Instructor for short courses on Tissue Optics at SPIE, OSA, and IEEE conferences. He was inducted as Fellow of SPIE in 2015 and Fellow of OSA in 2016.
Footnotes
CONFLICT OF INTEREST
The authors do not have any financial conflict of interest with respect to this study.
AUTHOR BIOGRAPHIES
Please see Supporting Information online.
SUPPORTING INFORMATION
Additional supporting information may be found online in the Supporting Information section at the end of this article.
REFERENCES
- [1].Gabrielli A, Avvedimento EV, Krieg T, Engl. J. Med 2009, 360, 1989. [DOI] [PubMed] [Google Scholar]
- [2].Mayes MD, Lacey JV Jr., Beebe-Dimmer J, Gillespie BW, Cooper B, Laing TJ, Schottenfeld D, Arthritis Rheum. 2003, 48, 2246. [DOI] [PubMed] [Google Scholar]
- [3].Denton CP, Clin. Med 2015, 15, 58. [Google Scholar]
- [4].Khanna D, Furst DE, Clements PJ, Allanore Y, Baron M, Czirjak L, Distler O, Foeldvari I, Kuwana M, Matucci-Cerinic M, Mayes M, Medsger T Jr., Merkel PA, Pope JE, Seibold JR, Steen V, Stevens W, Denton CP, J. Scleroderma Relat. Disord. 2017, 2, 11. [DOI] [PMC free article] [PubMed] [Google Scholar]
- [5].Ionescu R, Rednic S, Damjanov N, Varju C, Nagy Z, Minier T, Czirjak L, Clin. Exp. Rheumatol 2010, 28, S37. [PubMed] [Google Scholar]
- [6].Czirják L, Nagy Z, Aringer M, Riemekasten G, Matucci-Cerinic M, Furst DE, Eustar, Ann. Rheum. Dis 2007, 66, 966. [DOI] [PMC free article] [PubMed] [Google Scholar]
- [7].Castro SV, Jimenez SA, Biomark. Med 2010, 4, 133. [DOI] [PMC free article] [PubMed] [Google Scholar]
- [8].Kang T, Abignano G, Lettieri G, Wakefield RJ, Emery P, Del Galdo F, Eur. J. Rheumatol 2014, 1, 111. [DOI] [PMC free article] [PubMed] [Google Scholar]
- [9].Hesselstrand R, Scheja A, Wildt M, Akesson A, Rheumatology 2008, 47, 84. [DOI] [PubMed] [Google Scholar]
- [10].Akesson A, Hesselstrand R, Scheja A, Wildt M, Ann. Rheum. Dis 2004, 63, 791. [DOI] [PMC free article] [PubMed] [Google Scholar]
- [11].Moore TL, Lunt M, McManus B, Anderson ME, Herrick AL, Rheumatology 2003, 42, 1559. [DOI] [PubMed] [Google Scholar]
- [12].Liu H, Hou Y, Zhu Q.-l., Xu D, Wang L, Li J.-c., Jiang Y.-x., Wang Q, Li M.-t., Zhang F.-c., Zeng X.-f., PLoS One 2017, 12, e0174481. [DOI] [PMC free article] [PubMed] [Google Scholar]
- [13].Iagnocco A, Kaloudi O, Perella C, Bandinelli F, Riccieri V, Vasile M, Porta F, Valesini G, Matucci-Cerinic M, J. Rheumatol 2010, 37, 1688. [DOI] [PubMed] [Google Scholar]
- [14].Santiago T, Alcacer-Pitarch B, Salvador MJ, Del Galdo F, Redmond AC, da Silva JA, Clin. Exp. Rheumatol 2016, 34, 137. [PubMed] [Google Scholar]
- [15].Yang Y, Yan F, Wang L, Xiang X, Tang Y, Li Q, Xiaoyan L, Clin. Exp. Rheumatol 2018, 36 (suppl 113), 118. [PubMed] [Google Scholar]
- [16].Mao Y, Flueraru C, Chang S, Popescu DP, Sowa MG, IEEE Trans. Instrum. Meas 2011, 60, 3376. [Google Scholar]
- [17].Demidov V, Zhao X, Demidova O, Pang HYM, Flueraru C, Liu FF, Vitkin IA, J. Biomed. Opt 2018, 23, 1. [DOI] [PubMed] [Google Scholar]
- [18].Du Y, Liu CH, Lei L, Singh M, Li J, Hicks MJ, Larin KV, Mohan C, J. Biomed. Opt 2016, 21, 46002. [DOI] [PMC free article] [PubMed] [Google Scholar]
- [19].Abignano G, Aydin SZ, Castillo-Gallego C, Liakouli V, Woods D, Meekings A, Wakefield RJ, McGonagle DG, Emery P, Del Galdo F, Ann. Rheum. Dis 2013, 72, 1845. [DOI] [PubMed] [Google Scholar]
- [20].Pires NSM, Dantas AT, Duarte ALBP, Amaral MM, Fernandes LO, Dias TJC, de Melo LSA, Gomes ASL, Ann. Rheum. Dis 2018, 77, 465. [DOI] [PubMed] [Google Scholar]
- [21].Huang PC, Pande P, Shelton RL, Joa F, Moore D, Gillman E, Kidd K, Nolan RM, Odio M, Carr A, Boppart SA, J. Biomed. Opt 2017, 22, 34001. [DOI] [PMC free article] [PubMed] [Google Scholar]
- [22].Scolaro L, McLaughlin RA, Klyen BR, Wood BA, Robbins PD, Saunders CM, Jacques SL, Sampson DD, Biomed. Opt. Express 2012, 3, 366. [DOI] [PMC free article] [PubMed] [Google Scholar]
- [23].Wang S, Liu C-H, Zakharov VP, Lazar AJ, Pollock RE, Larin KV, J. Biomed. Opt 2014, 19, 21102. [DOI] [PubMed] [Google Scholar]
- [24].Sulli A, Ruaro B, Alessandri E, Pizzorni C, Cimmino MA, Zampogna G, Gallo M, Cutolo M, Ann.Rheum.Dis 2014, 73, 247. [DOI] [PubMed] [Google Scholar]
- [25].Santiago T, Santiago M, Ruaro B, Salvador MJ, Cutolo M, da Silva JAP, Arthritis Care Res. 2019, 71, 563. [DOI] [PubMed] [Google Scholar]
- [26].Larin KV, Sampson DD, Biomed. Opt. Express 2017, 8, 1172. [DOI] [PMC free article] [PubMed] [Google Scholar]
- [27].Schmitt J, Opt. Express 1998, 3, 199. [DOI] [PubMed] [Google Scholar]
- [28].Kuwahara Y, Shima Y, Shirayama D, Kawai M, Hagihara K, Hirano T, Arimitsu J, Ogata A, Tanaka T, Kawase I, Rheumatology 2008, 47, 1018. [DOI] [PubMed] [Google Scholar]
- [29].Falanga V, Bucalo B, J. Am. Acad. Dermatol 1993, 29, 47. [DOI] [PubMed] [Google Scholar]
- [30].Liu CH, Du Y, Singh M, Wu C, Han Z, Li J, Chang A, Mohan C, Larin KV, J. Biophotonics 2016, 9, 781. [DOI] [PMC free article] [PubMed] [Google Scholar]
- [31].Wang S, Larin KV, Opt. Lett 2014, 39, 41. [DOI] [PMC free article] [PubMed] [Google Scholar]
- [32].Song S, Huang Z, Wang RK, J. Biomed. Opt 2013, 18, 121505. [DOI] [PubMed] [Google Scholar]
- [33].Wang S, Lopez AL 3rd., Y. M., Tao G, Li J, Larina IV, Martin JF, Larin KV, Biomed. Opt. Express 2014, 5, 1980. [DOI] [PMC free article] [PubMed] [Google Scholar]
- [34].Li L, Zeng L, Lin ZJ, Cazzell M, Liu H, J. Biomed. Opt 2015, 20, 50801. [DOI] [PubMed] [Google Scholar]
- [35].Yildiz EH, Erdurmus M, Elibol ES, Acar B, Vural ET, Int. J. Ophthalmol 2015, 8, 1074. [DOI] [PMC free article] [PubMed] [Google Scholar]
- [36].Bland JM, Altman DG, Lancet 1986, 1, 307. [PubMed] [Google Scholar]
- [37].Zhou K, Le N, Huang Z, Li C, J. Biophotonics 2018, 11, e201700051 10.1002/jbio.201700051. [DOI] [PubMed] [Google Scholar]
- [38].Soczkiewicz E, Acustica 1996, 82, 380. [Google Scholar]
- [39].Salavat RA, Shang W, Andrei BK, Jiasong L, Michael T, Stanislav YE, Kirill VL, Phys. Med. Biol. 2015, 60, 4295.25974168 [Google Scholar]
- [40].Wang S, Larin KV, Biomed. Opt. Express 2014, 5, 3807. [DOI] [PMC free article] [PubMed] [Google Scholar]
- [41].Van Mulder TJ, de Koeijer M, Theeten H, Willems D, Van Damme P, Demolder M, De Meyer G, Beyers KC, Vankerckhoven V, Vaccine 2017, 35, 1810. [DOI] [PubMed] [Google Scholar]
- [42].McKee CT, Last JA, Russell P, Murphy CJ, Tissue Eng. Part B Rev 2011, 17, 155. [DOI] [PMC free article] [PubMed] [Google Scholar]
- [43].Yang Y, Qiu L, Wang L, Xiang X, Tang Y, Li H, Yan F, Ultrasound Med. Biol 2019, 45, 902. [DOI] [PubMed] [Google Scholar]
- [44].Mao Y, Sherif S, Flueraru C, Chang S, Appl. Optics 2008, 47, 2004. [DOI] [PubMed] [Google Scholar]
- [45].Jayavel P, Amano T, Choi D, Furukawa H, Hiro-Oka H, Asaka K, Ohbayashi K, Jpn. J. Appl. Phys 2006, 45, L1317. [Google Scholar]
- [46].Nguyen TM, Song S, Arnal B, Wong EY, Huang Z, Wang RK, O’Donnell M, J. Biomed. Opt 2014, 19, 16013. [DOI] [PMC free article] [PubMed] [Google Scholar]
- [47].Nguyen TM, Zorgani A, Lescanne M, Boccara C, Fink M, Catheline S, J. Biomed. Opt 2016, 21, 126013. [DOI] [PubMed] [Google Scholar]
Associated Data
This section collects any data citations, data availability statements, or supplementary materials included in this article.


