

Abstract
Redox balance, an essential feature of healthy physiological steady states, is regulated by circadian clocks, but whether or how endogenous redox signalling conversely regulates clockworks in mammals remains elusive. Here, we report circadian rhythms in the levels of endogenous H2O2 in mammalian cells and mouse livers. Using an unbiased method to screen for H2O2-sensitive transcription factors, we discovered that rhythmic redox control of CLOCK directly by endogenous H2O2 oscillations is required for proper intracellular clock function. Importantly, perturbations in the rhythm of H2O2 levels induced by the loss of p66Shc, which oscillates rhythmically in mouse livers and SCN, disturb the rhythmic redox control of CLOCK function, reprogram hepatic transcriptome oscillations, lengthen the circadian period in mice, and modulate light-induced clock resetting. Our findings suggest that redox signalling rhythms are intrinsically coupled to the circadian system through reversible oxidative modification of CLOCK and constitute essential mechanistic timekeeping components in mammals.
Circadian clocks coordinate behavioural and physiological processes in organisms with the rotation of the earth1. The ability to resonate with environmental cycles affords creatures a selective competitive advantage2. In mammals, the approximate 24-h timing circuits are considered to derive from regulatory interactions among the primary molecular components of transcriptional-translational feedback loops (TTFLs)3. However, accumulating evidence reinforces the notion that transcription-independent accessory oscillator mechanisms are also contributors to circadian rhythmicity4. These mechanisms include the circadian oxidation of peroxiredoxin proteins5. However, how redox rhythm and transcriptional rhythm are coupled to cooperatively confer organisms accurate timekeeping remains elusive6.
Redox homeostasis, which is central to life7, is determined by the balance between reducing agents and oxidants. As a central oxidant in redox balance, hydrogen peroxide (H2O2) is membrane-permeable8 and has the highest stability among the physiologically relevant reactive oxygen species (ROS)9. Thus, it is perfectly equipped to behave as a redox signalling molecule through rapid and reversible alterations to protein function by modifying reactive cysteine residues10. Indeed, it has been shown that endogenous H2O2 is an indispensable regulatory mediator of a range of biological phenomena in multicellular organisms10,11. However, the role of endogenous H2O2 in the circadian rhythm of mammals remains unclear, although acute treatment with high levels of extracellular oxidative stress has been shown to alter circadian rhythms in mammalian cells12–14. In the present study, we revealed previously unrecognized direct links between endogenous H2O2 oscillations and the circadian system, as well as the physiological significance of the endogenous H2O2 rhythm in circadian clocks.
Results
Diurnal oscillations of endogenous H2O2 levels
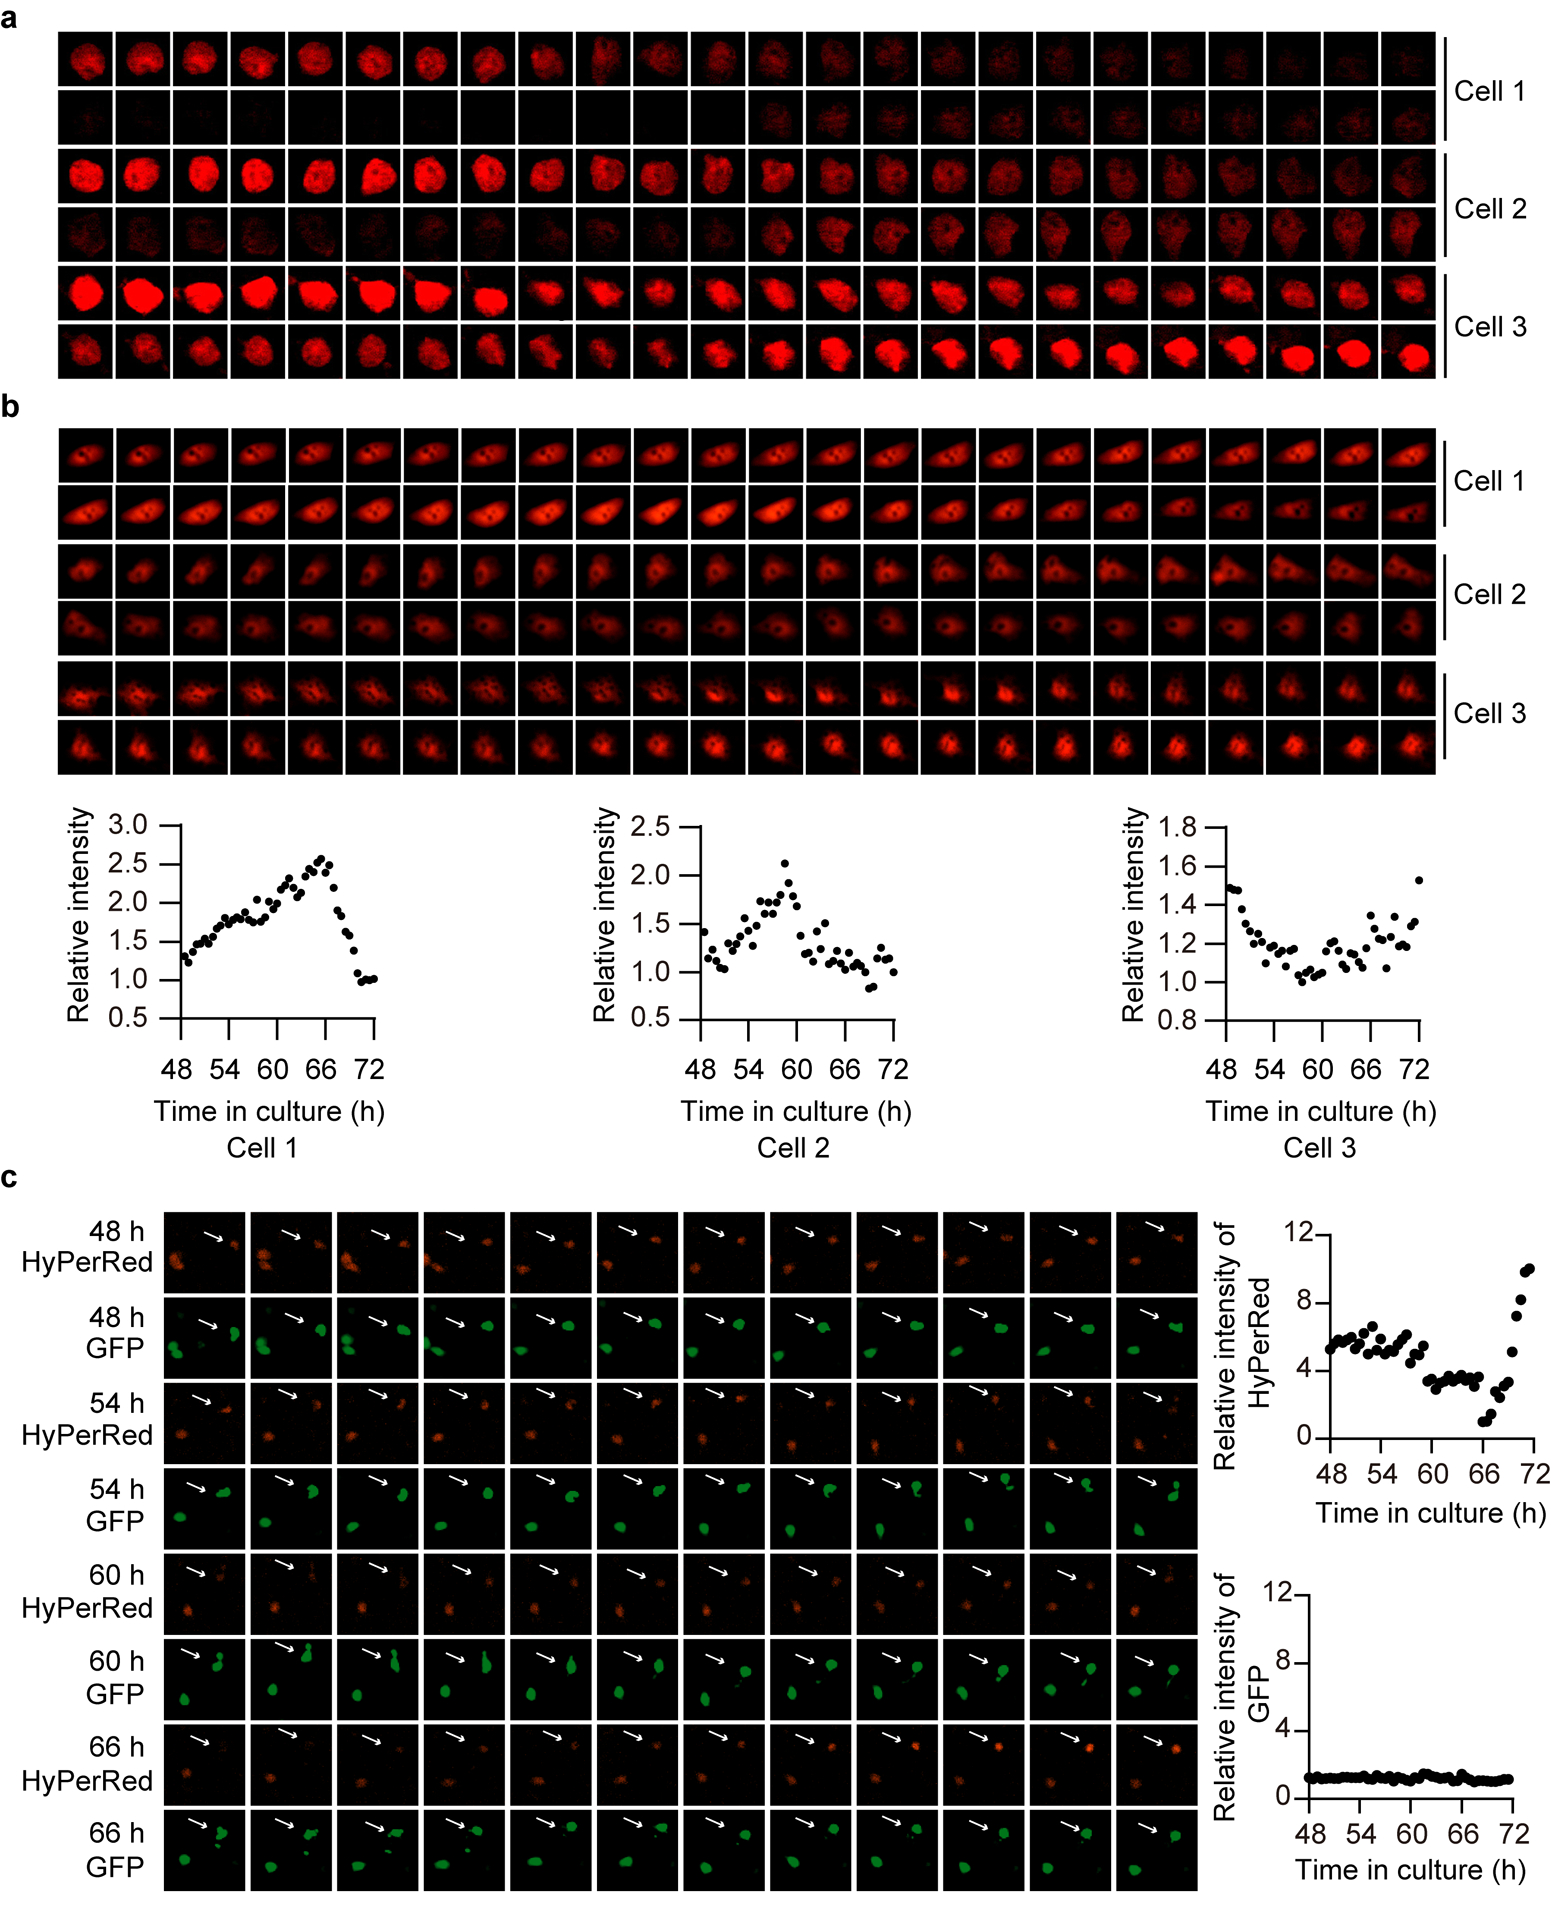
We first determined the temporal changes in endogenous H2O2 levels in living cells using HyPerRed, a genetically encoded physiological H2O2 sensor15. We expressed the probe in N2a murine neuroblastoma cells16, and continuously recorded fluorescence signals. We observed a near 24-h oscillation of HyPerRed fluorescence intensity over the circadian cycles after synchronization (Fig. 1a,b and Extended Data Fig. 1a). Fluorescence intensity was dampened after repeated fluorescence excitation for 48 h, likely due to overstimulation by the laser (Fig. 1a). We next confirmed the rhythms of endogenous H2O2 in cell population with human osteosarcoma U2OS cells stably expressing both GFP and HyPerRed probe under the same promoter. Results showed that the intensity of HyPerRed in cell population oscillated rhythmically while GFP intensity remained unchanged (Fig. 1c). We further examined whether the endogenous H2O2 cycles persist in non-synchronized individual U2OS cells. The fluorescence profiles of HyPerRed showed that individual cells exhibited robust but out-of-phase H2O2 rhythms (Fig. 1d,e and Extended Data Fig. 1b) while similar oscillations of the intensity of GFP were not observed in the same cell (Extended Data Fig. 1c).
Figure 1. Endogenous H2O2 levels oscillate rhythmically in cells and in mouse livers.
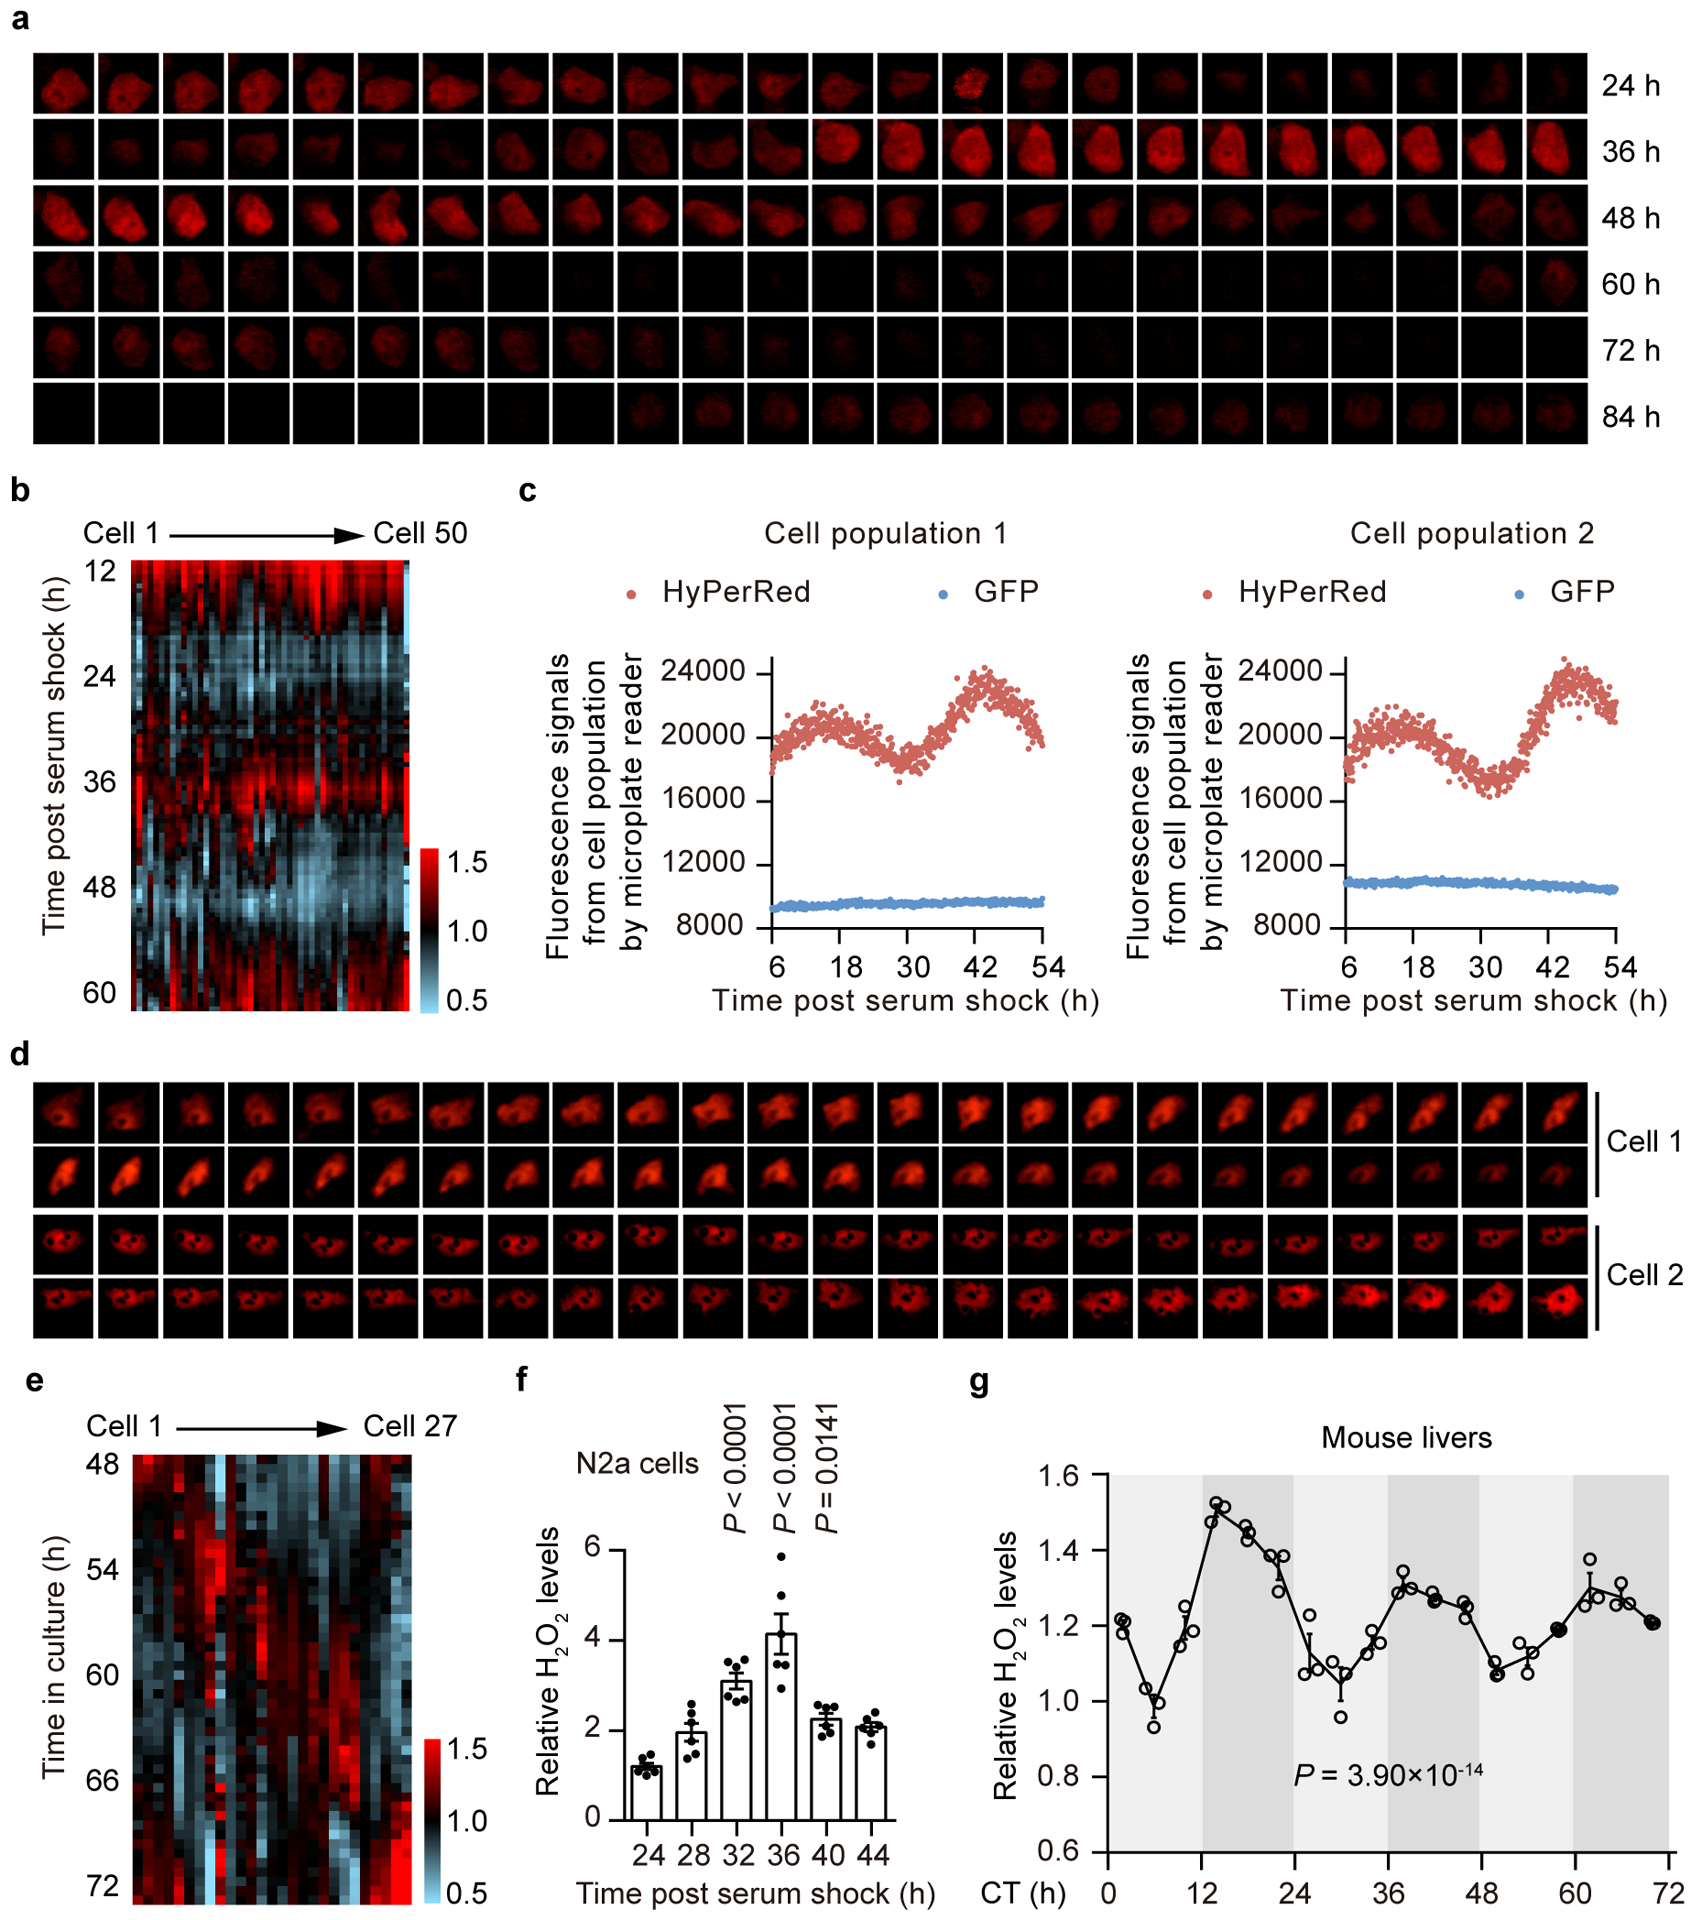
a,d, Time-lapse microscopy of circadian HyPerRed fluorescence in an individual cell for three consecutive days post serum shock (a) or in two individual cells for 24 h without serum shock (d). Images were obtained every 30 minutes (min) (n = 3 independent experiments with similar results). b,e, Circadian fluorescence profiles of HyPerRed from n = 50 individual cells post serum shock (b) or n = 27 individual cells without serum shock (e). Note that fluorescence intensity varies dramatically between cells. Fluorescence intensity was quantified and plotted against time after normalization to mean values of individual cells. c, Fluorescent signals of HyPerRed and GFP under the same promoter in the same U2OS cell population at 5-min intervals for two days post serum shock (n = 3 independent experiments with similar results). f, Concentration of H2O2 in N2a cells determined by Amplex Red at 4-h intervals for one circadian cycle post serum shock. Data are presented as the means ± standard errors of the means (SEM) (n = 6 independent biological samples per time point). P values are shown for the comparisons to 24 h by one-way analysis of variance (ANOVA) with a Bonferroni’s post hoc test. g, Concentration of H2O2 in mouse livers determined by Amplex Red at 4-h intervals over a 72-h period under DD conditions. Data are presented as the means ± SEM (n = 3 independent biological samples per time point). JTK _Cycle analysis was used to determine rhythmicity, and P < 0.05 was considered rhythmic. Source data are provided in Statistics Source Data Figure 1.
Circadian rhythms of H2O2 levels were also observed in the cell population using another chemical probe, Amplex Red, a highly sensitive and specific substrate for H2O217 (Fig. 1f). Strikingly, we also found that endogenous H2O2 levels oscillated rhythmically in mouse livers over circadian cycles (Fig. 1g). A peak in H2O2 levels was observed at the beginning of the dark period [circadian time (CT) 14], indicating a relatively oxidized state during the animals’ active phase, and a trough was observed at midday (CT6), indicating a relatively reduced state during the resting phase (Fig. 1g).
Screening for candidate sensors of endogenous H2O2 oscillations
To uncover the downstream signalling of redox regulation that impinges on the circadian clock, we applied an unbiased screen to explore the proteomic landscape of TFs with DNA-binding activity that is subject to H2O2-induced regulation by applying a pull-down assay using a concatenated tandem array of consensus TF response elements (catTFRE)18 to trap the TFs expressed in mouse livers following treatment with or without H2O2 (Fig. 2a).
Figure 2. H2O2-sensitive transcription factor (TF) screening identifies that the redox state of CLOCK oscillates rhythmically.
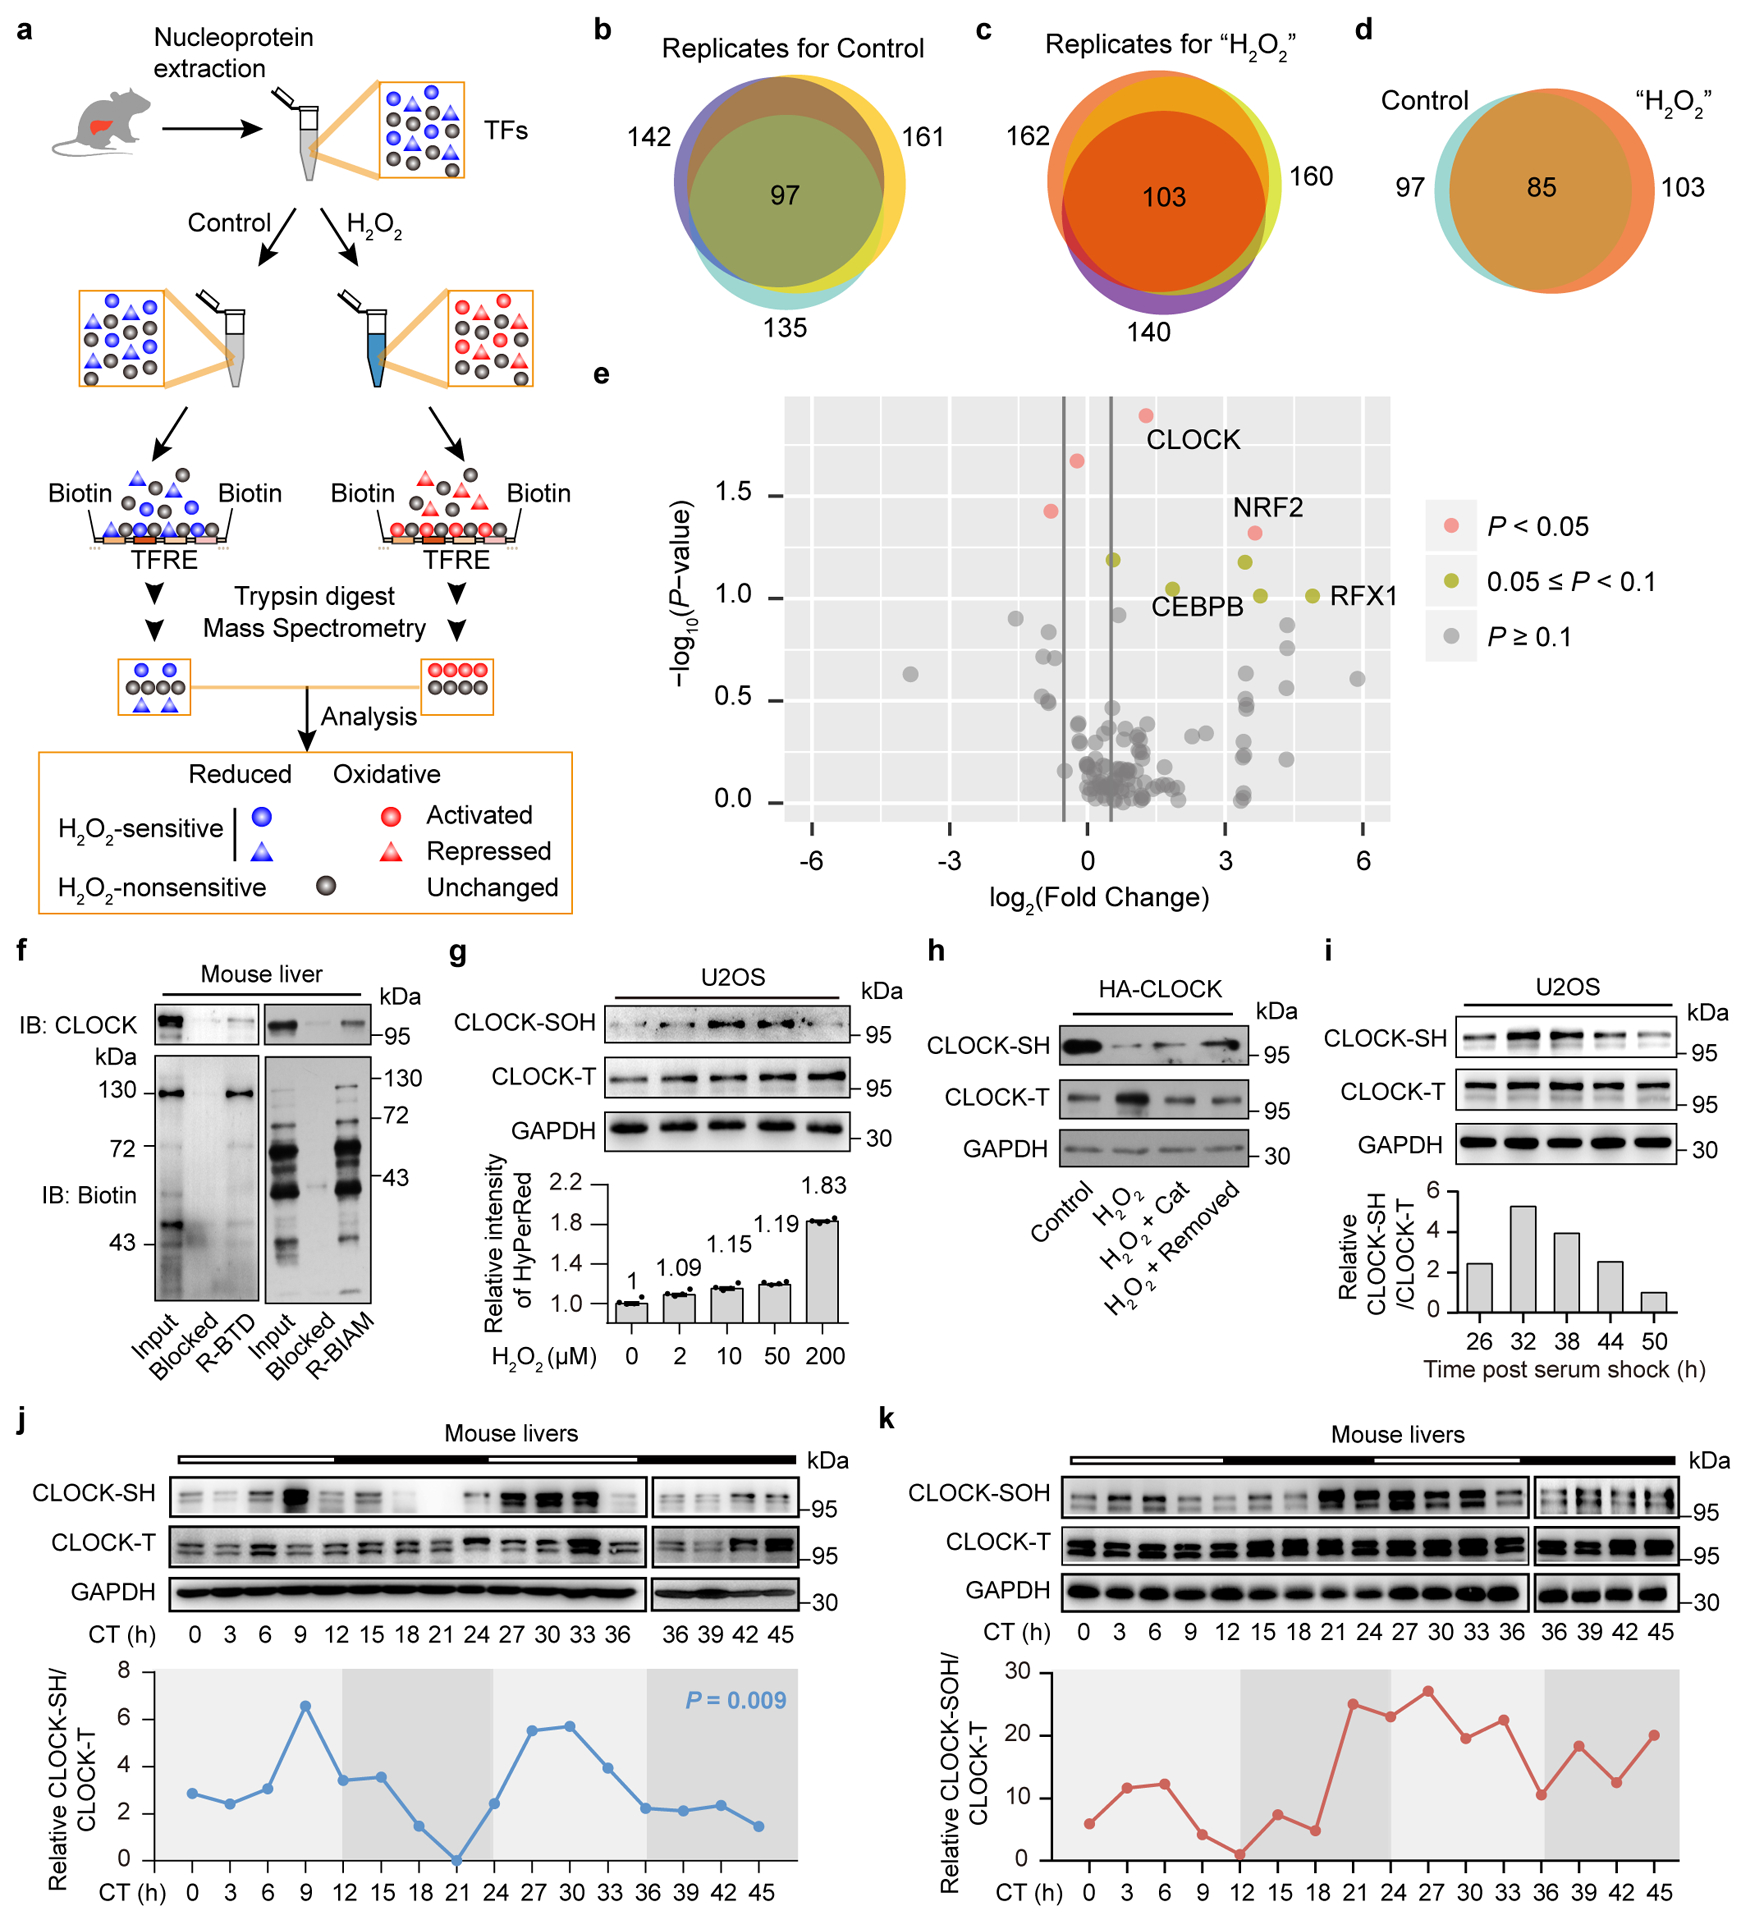
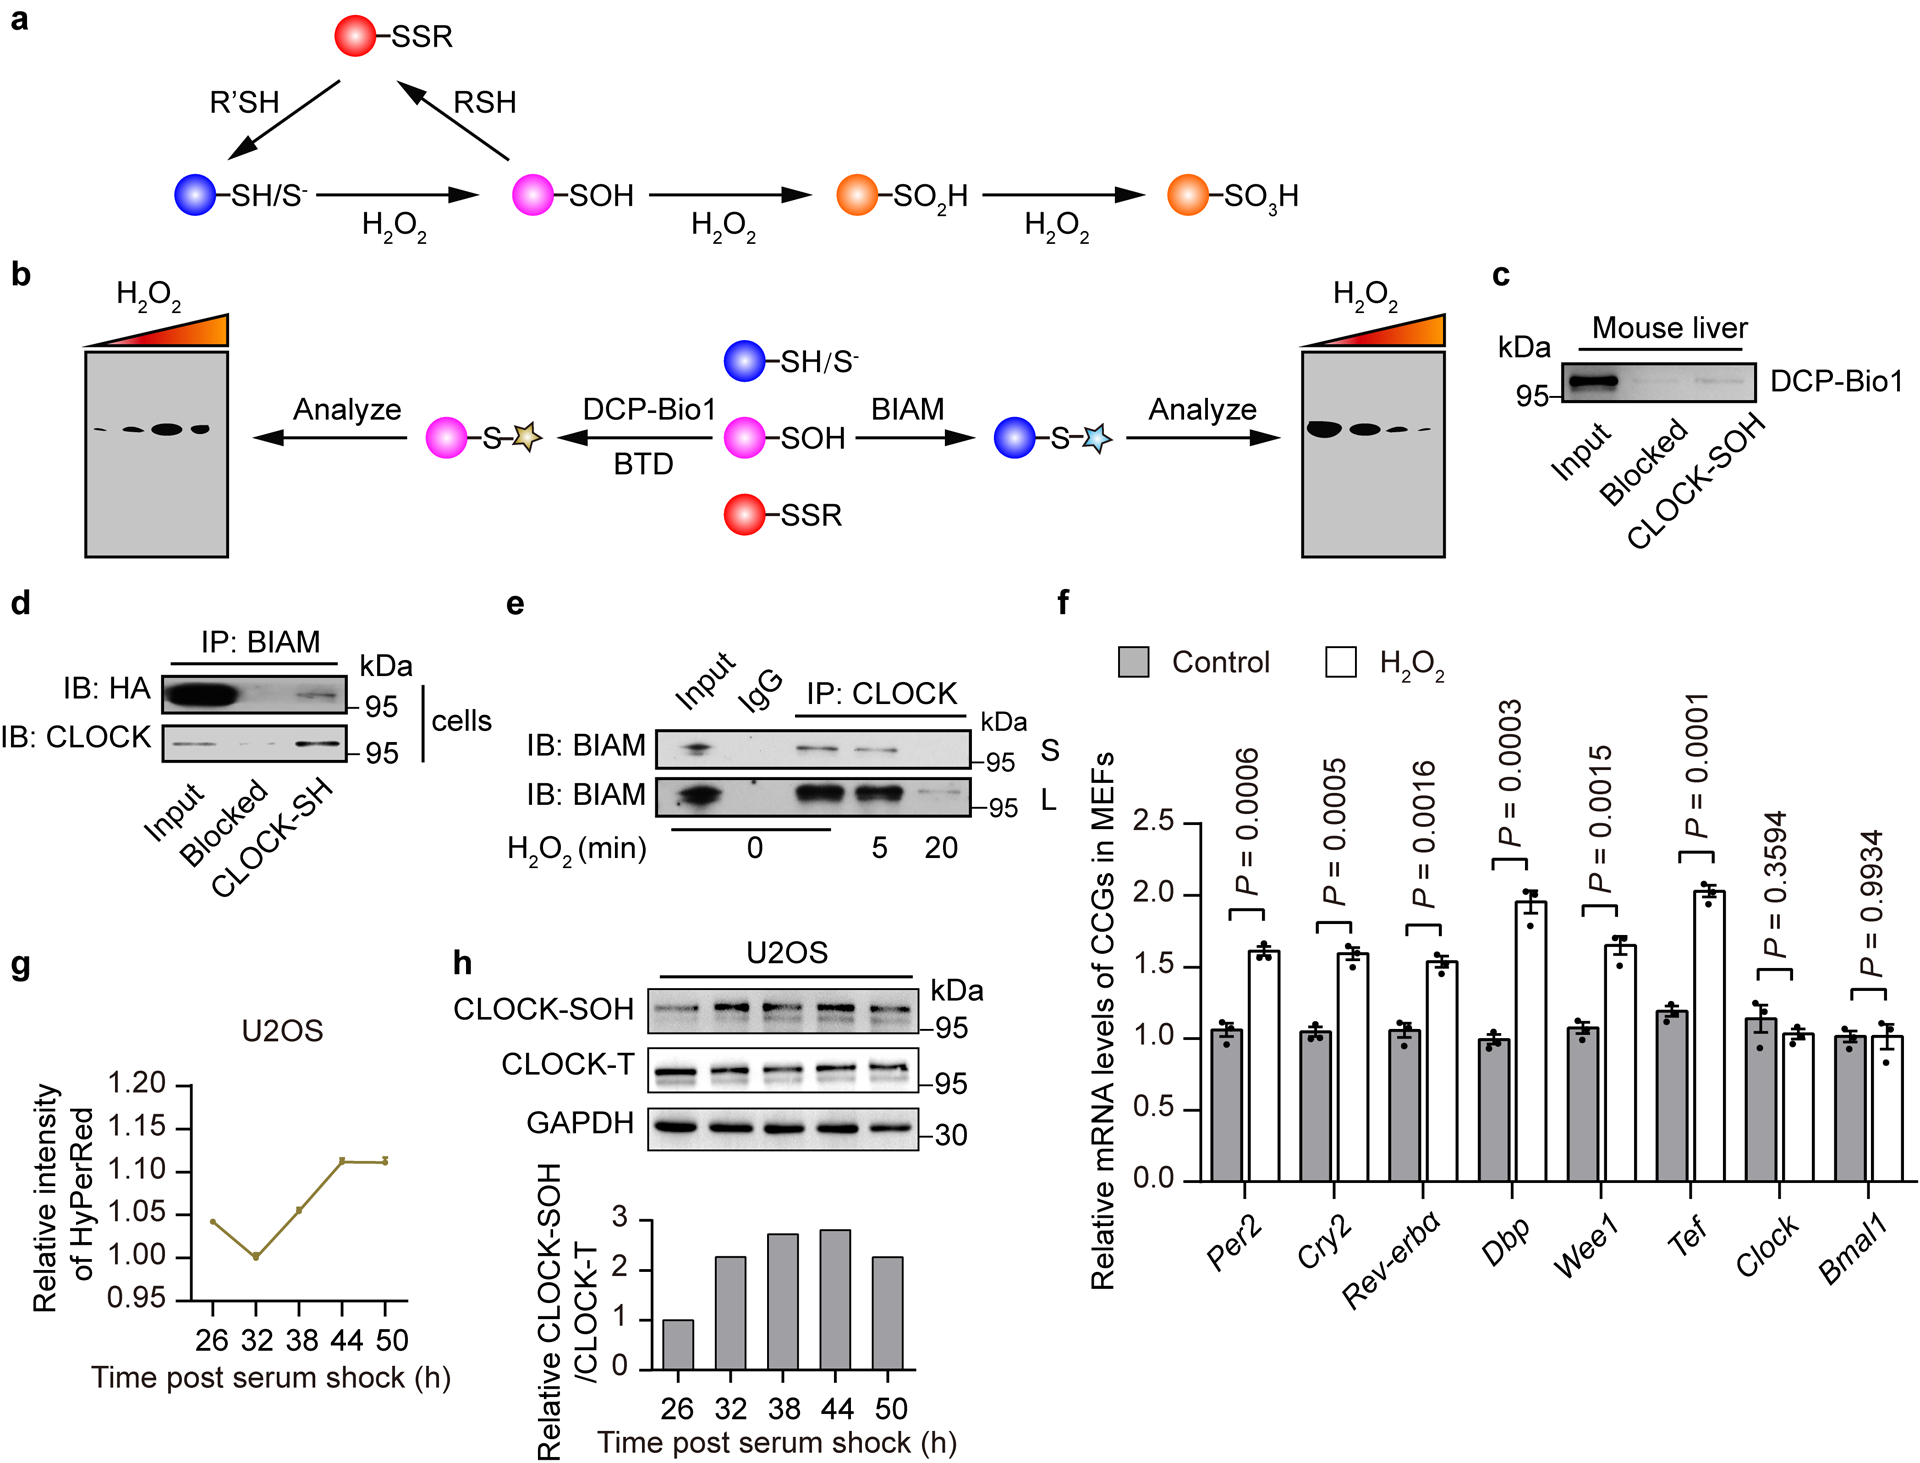
a, Schematic of the experimental design used to profile the proteomic landscape of TFs with DNA-binding activity that was influenced by H2O2 treatment (200 μM). Nuclear extracts obtained from three livers were pooled for experiment. b,c, Venn diagram illustrating the overlap of TFs identified in three independent biological samples of the control group (b) and H2O2-treated group (c). d, Venn diagram illustrating TF enrichment and identification comparison between control and H2O2 treatments. e, Volcano plot illustrating the different abundance of individual TFs identified in the H2O2-treated group versus the control group. The y-axis represents the -log10 (P-value) based on a paired two-tailed Student’s t test (n = 3 independent biological samples). The x-axis represents the log2 (fold change). A fold change of 1.5 is indicated by grey lines. TFs with a P-value < 0.05 are depicted in pink and TFs with a P-value < 0.1 are depicted in breen. f, Representative western blot of S-sulfenylated CLOCK (CLOCK-SOH) labelled by BTD and reduced CLOCK (CLOCK-SH) proteins labelled by BIAM from livers. g, Representative western blot showing the CLOCK-SOH (upper panel) labelled by DCP-Bio1 and HyPerRed intensity (lower panel) (n = 4 independent biological samples) in U2OS cells stably expressing HyPerRed and treated with different doses of H2O2. Data are presented as the means ± SEM. h, Representative western blot of HA-tagged CLOCK-SH from N2a cells treated with H2O2 (200 μM) alone or followed by catalase treatment (1000 U/ml) or removal of H2O2. i-k, Representative western blot and quantification of CLOCK-SH in U2OS cells (i), in mouse livers (j), and CLOCK-SOH levels in mouse livers (k) over the circadian cycle. Each time point consists of a mixture of liver extracts from three mice. JTK _Cycle analysis was used to determine rhythmicity, and P < 0.05 was considered rhythmic. n = 2 independent experiments for f,h and n = 3 independent experiments for g,i-k with similar results. Source data are provided in Statistics Source Data Figure 2. Unprocessed blots are shown in Source Data Figure 2.
In three experimental replicates, greater than 59% (Fig. 2b) and 63% (Fig. 2c) of TFs identified in control and H2O2-treated replicates overlapped, respectively. The high level of overlap provides strong confidence in our identification of TFs. To further improve the reliability of the screen, only the TFs identified in all three replicates in the control or H2O2 group were included in the statistical analysis. In total, 115 TFs were identified across the control (97 TFs) and H2O2-treated groups (103 TFs) and 85 TFs (74%) overlapped between the two groups (Fig. 2d). We obtained 3 hits based on a ≥1.5-fold change with a p-value < 0.05 (Fig. 2e and Supplementary Table 1). Interestingly, among the top 3 hits was CLOCK (2.4-fold change with a p-value < 0.05), one of the core TFs involved in the circadian clock (Fig. 2e). Thus, we speculated that CLOCK may be one of the nodes coupling redox signalling rhythms to the circadian system.
Rhythmic oscillations of CLOCK’s redox state
Reactive thiols of reduced cysteine residues (-SH/S−) in proteins are oxidized to S-sulfenic acids (–SOH) by H2O219 (Extended Data Fig. 2a). As a key intermediate of cysteine oxidation, sulfenic acid is unstable and further reacts with proximal thiol groups to form disulfides which are also reversible oxidative modifications19 (Extended Data Fig. 2a). Thus, the levels of cysteine residues in the reduced state (-SH/S−) are reliable as indicators of changes in the redox state of the protein19, while S-sulfenic acids (–SOH) modification serves as a marker for H2O2-sensitive cysteine residues20. We, therefore, verified that reduced cysteine residues and S-sulfenylated sites were indeed present in CLOCK in mouse livers (Fig. 2f and Extended Data Fig. 2c) with biotin-conjugated iodoacetamide (BIAM), an alkylating reagent that is commonly used to detect reduced cysteines21, as well as 2-benzyl-1,2-thiazinan-5-one 1,1-dioxide (BTD)22 and DCP-Bio123, two successfully used dimedone-based chemical probes for sulfenic acid detection (Extended Data Fig. 2b), to further confirm our screening result. Importantly, the amount of CLOCK-SOH was remarkably increased by the H2O2 treatment in a dose-dependent manner within a certain range (2–10 μM) and decreased by treatment with higher doses (50–200 μM) (Fig. 2g), which might be due to the peroxidation of sulfenic acid to the sulfinic (R-SO2H) or sulfonic acid (R-SO3H). Indeed, CLOCK-SH levels were remarkably decreased after stimulation with H2O2 (200 μM) (Fig. 2h and Extended Data Fig. 2d,e) and were only partially rescued when H2O2 was degraded by catalase or completely removed (Fig. 2h). In addition, in line with the screening result that H2O2 promoted the DNA-binding activity of CLOCK, we found that H2O2 treatment significantly upregulated CLOCK’s downstream clock control genes (CCGs) in mouse embryonic fibroblasts (MEFs) (Extended Data Fig. 2f).
We next determined whether endogenous H2O2 can oxidize CLOCK thiols. Interestingly, we noticed that the intensity of HyPerRed in U2OS cell population oscillated rhythmically with an amplitude similar to the alterations induced by lower doses of H2O2 treatment (2–10 μM) (1.12-fold vs 1.09-fold, 1.15-fold) (Fig. 2g, lower panel and Extended Data Fig. 2g), which significantly upregulated CLOCK-SOH levels (Fig. 2g), supporting the hypothesis that endogenous H2O2 can also oxidize CLOCK thiols. Indeed, we observed remarkable changes in the redox state of CLOCK at different time points, as revealed by examining the levels of CLOCK-SH (Fig. 2i) and CLOCK-SOH (Extended Data Fig. 2h) in U2OS cells over circadian cycles. To determine whether the cysteine-mediated reversible oxidation of CLOCK operates in mouse livers, we examined temporal changes in the redox state of the CLOCK protein over circadian cycles. Strikingly, the amounts of the CLOCK-SH (Fig. 2j) and CLOCK-SOH (Fig. 2k) in mouse livers also oscillated rhythmically throughout different time points. These results together support the notion that the redox state of CLOCK oscillates rhythmically in vivo.
Cysteine195 mediates the rhythmic oscillations of CLOCK’s redox state
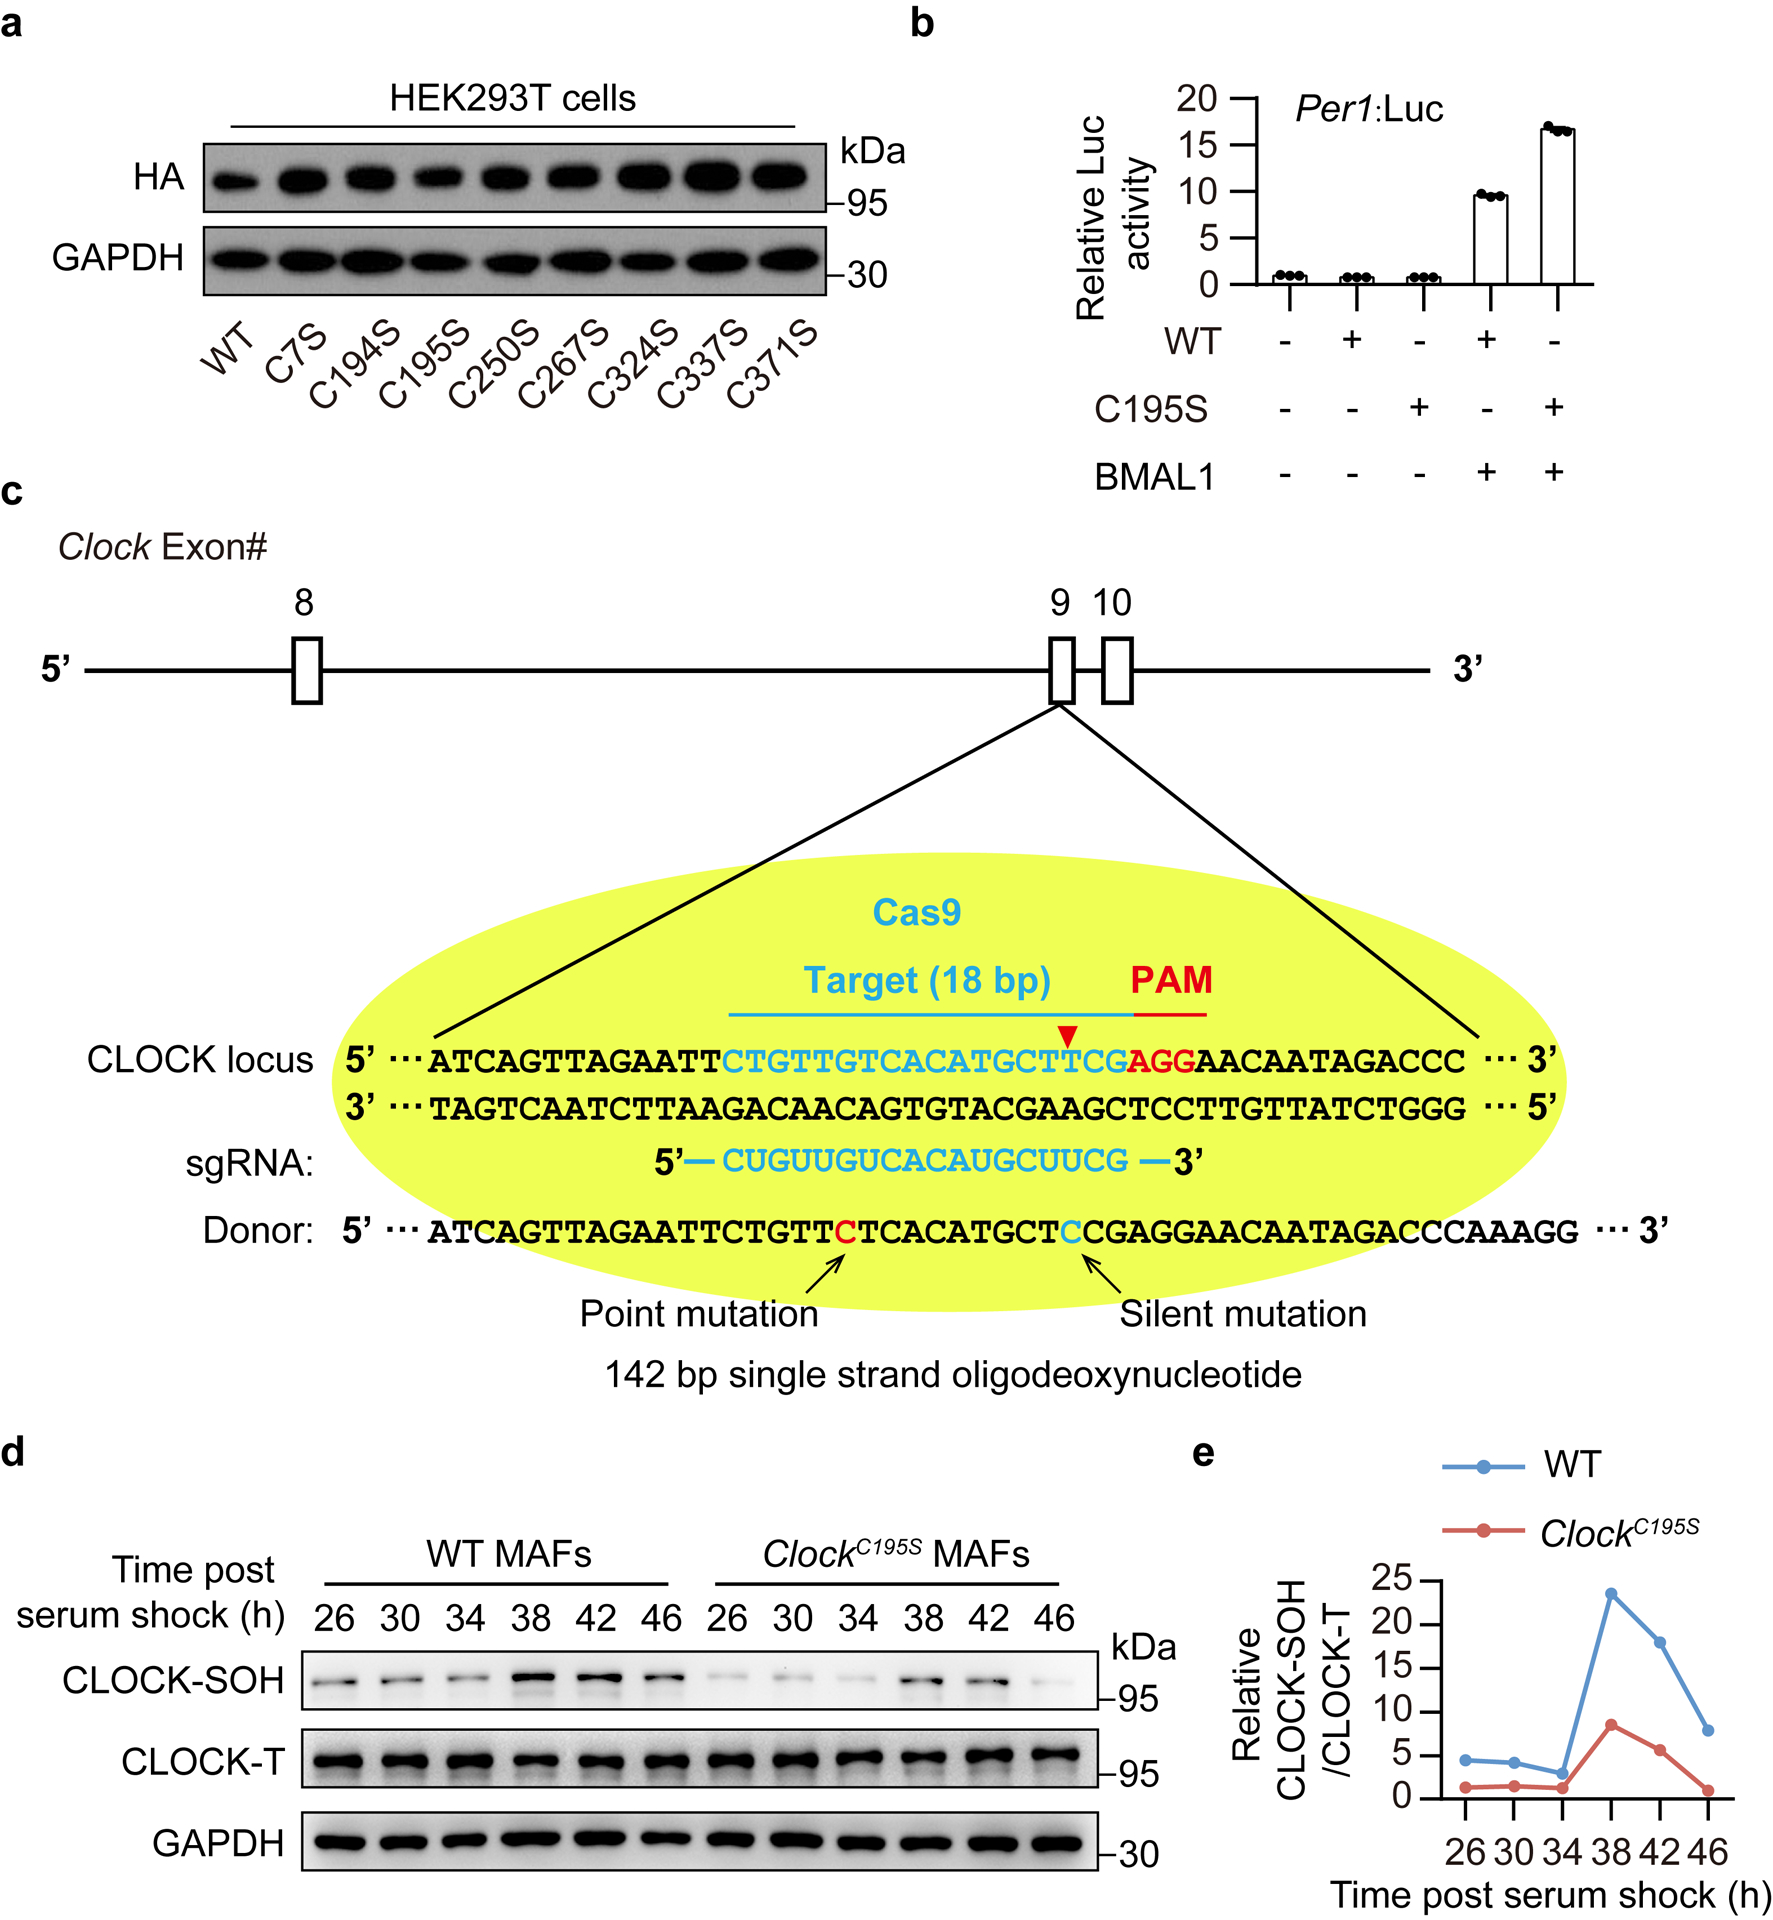
To determine which cysteine residues are involved in the H2O2-mediated oxidative regulation of CLOCK, we comparatively analyzed the evolutionary conservation of the eight cysteine residues within N-terminal region of CLOCK (Fig. 3a). Several cysteine residues in CLOCK are conserved across phyla, especially for Cysteine195 (C195) and C371 in the two different PAS domains (Fig. 3a). Remarkably, among these cysteine residues, substitution at C195 by Serine not only significantly enhanced the activity of Period 1 (Per1):Luc (approximately two-fold) (Fig. 3b and Extended Data Fig. 3a,b) but also upregulated the mRNA levels of D site of albumin promoter (albumin D-Box) binding protein (Dbp) (Fig. 3c) compared with wild-type (WT) CLOCK in the presence of BMAL1 overexpression, suggesting a critical role of C195 on the transcriptional activity of CLOCK. In addition, the levels of CLOCK-SH were greatly decreased (Fig. 3d) and less sensitive to H2O2 treatment (Fig. 3e) in the C195S mutant compared with the WT CLOCK while the total protein levels remain unchanged. On the other hand, the alterations of CLOCK-SOH in cells were disturbed by C195S mutant (Fig. 3f). Indeed, C195 was one of the most H2O2-sensitive cysteines in recombinant CLOCK24 (Fig. 3g) and underwent sulfenic acid modification (dimedone-labelled)25 after H2O2 treatment (Fig. 3h).
Figure 3. Cysteine195 mediates the rhythmic oscillations of CLOCK’s redox state.
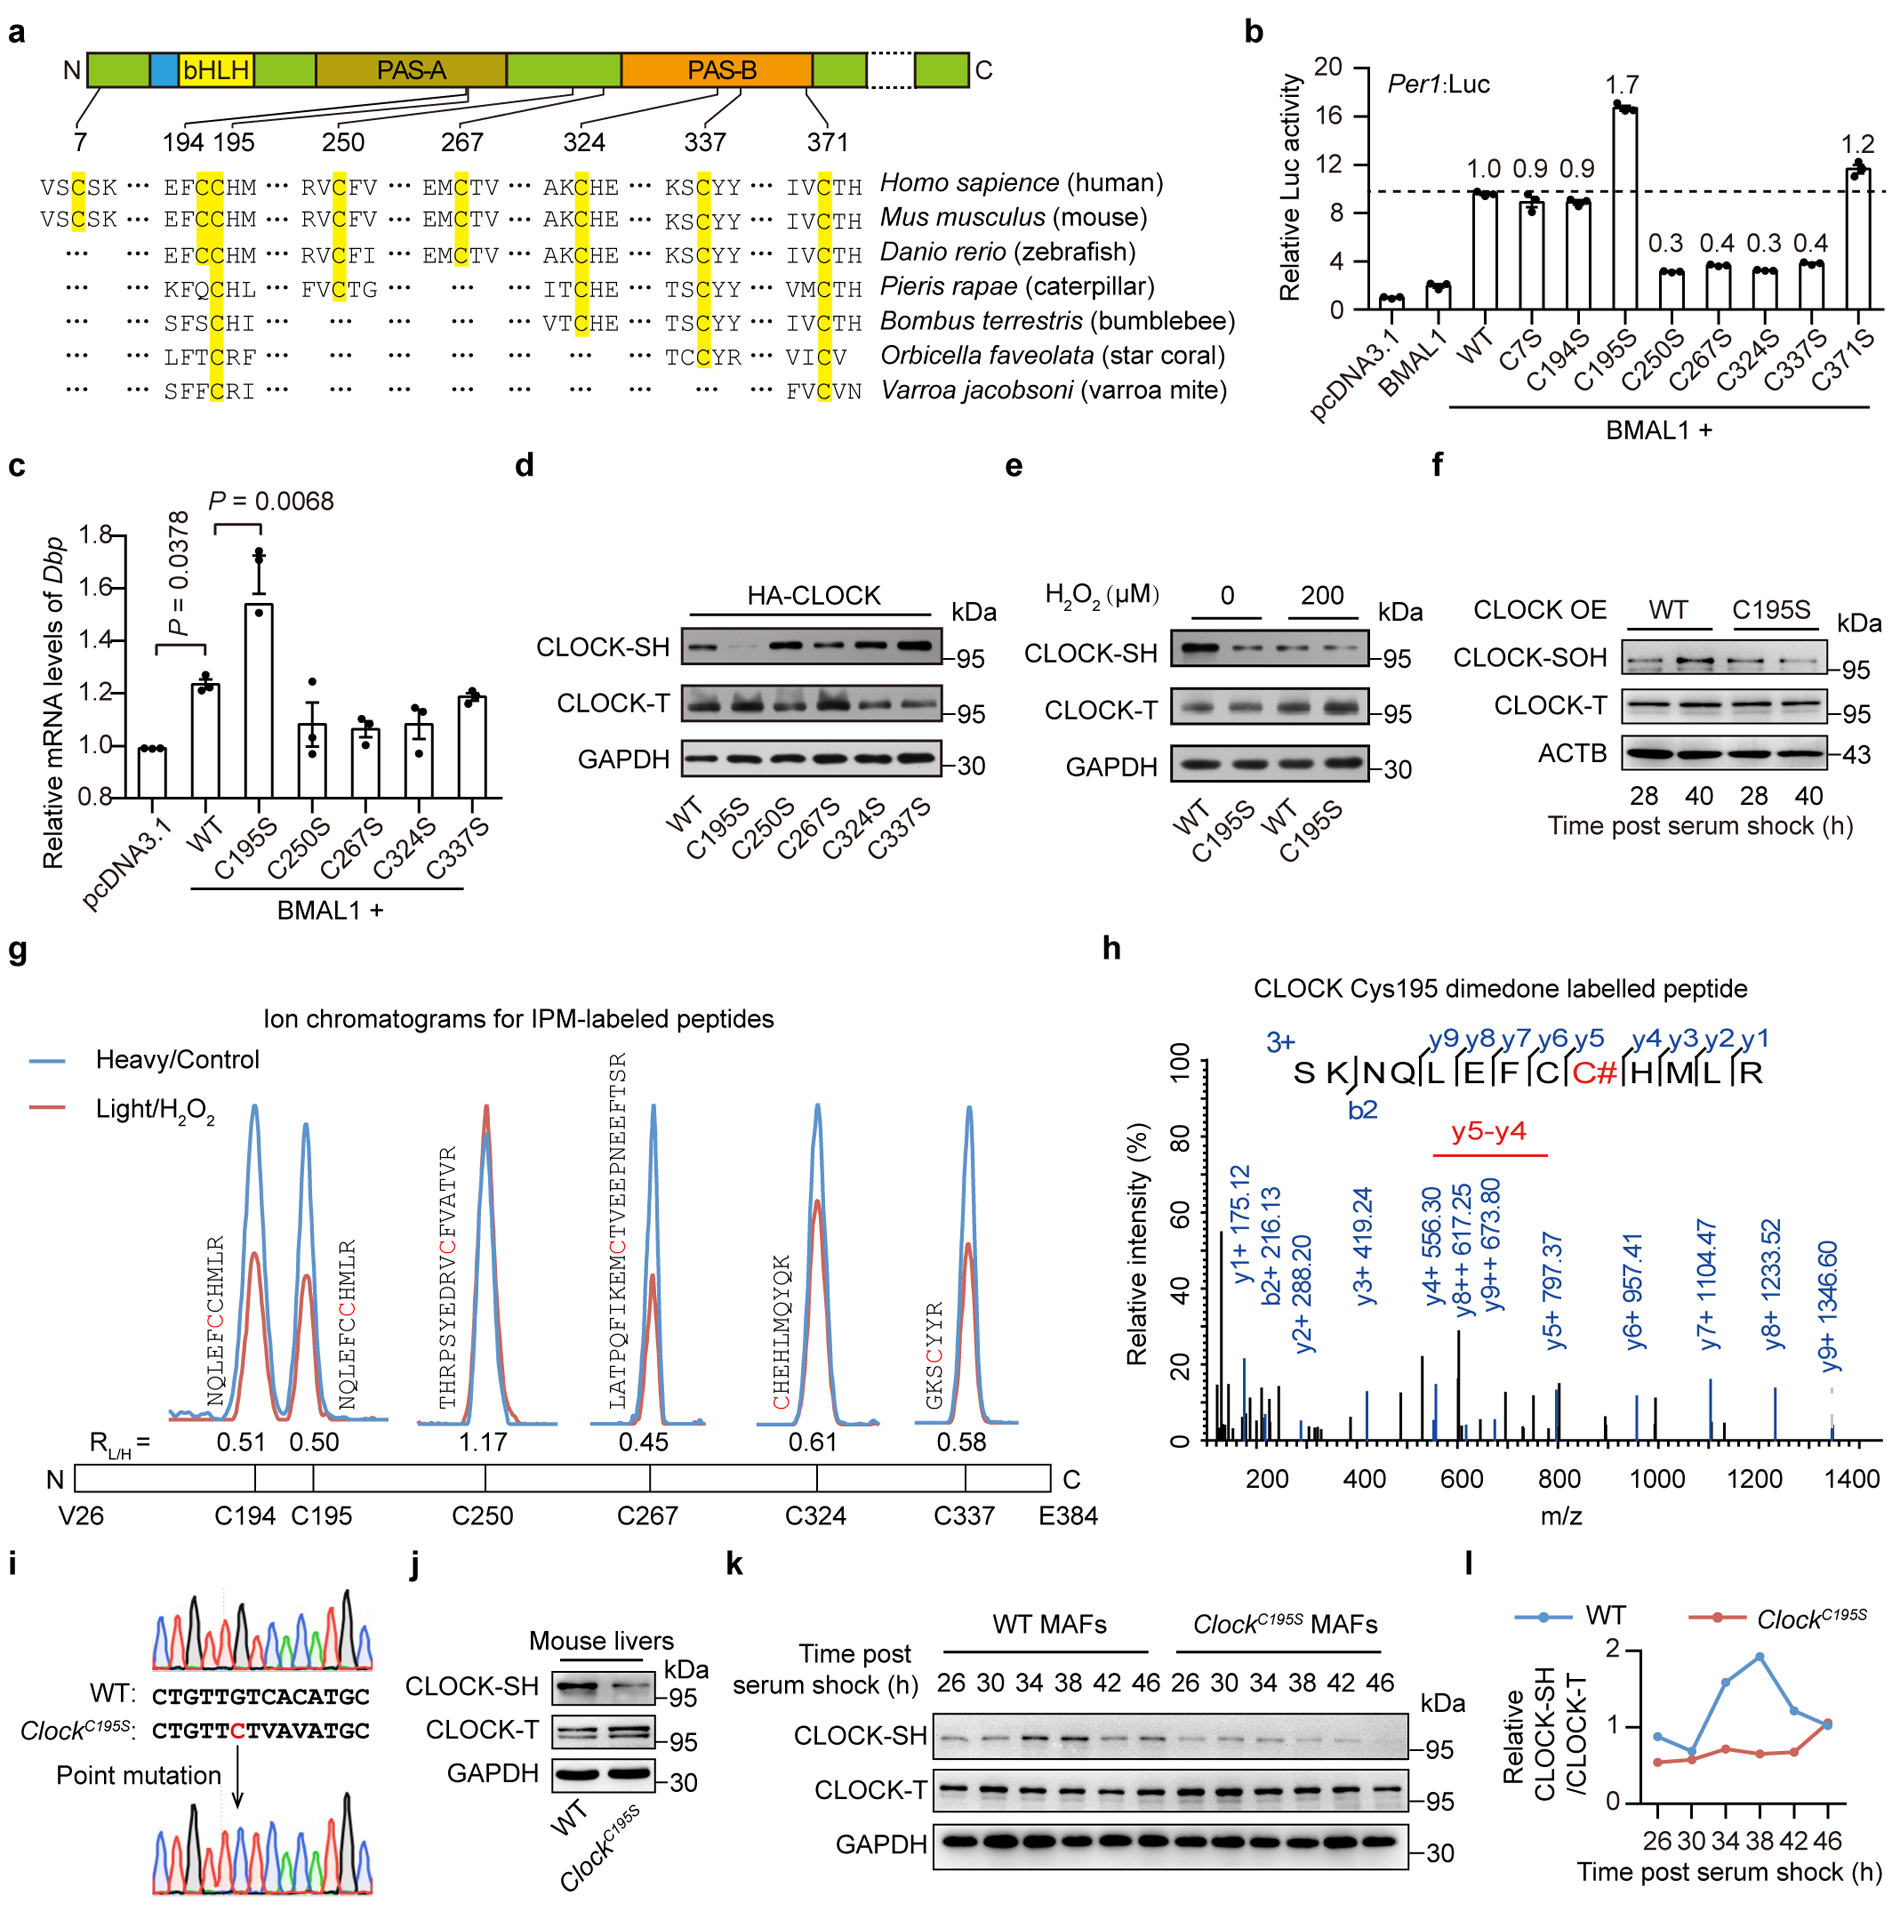
a, Analysis of evolutionary conservation of cysteines in CLOCK. b, Relative luciferase activities of Per1:Luc in HEK293T cells transfected with WT or a series of cysteine mutant CLOCK plasmids in the presence of BMAL1 overexpression (n = 3 independent biological samples). Data are presented as the means ± SEM. c, Relative mRNA levels of Dbp in N2a cells transfected with WT or corresponding mutant CLOCK in the presence of BMAL1 overexpression (n = 3 independent biological samples). P values were calculated using an unpaired two-tailed Student’s t test. Data are presented as the means ± SEM. d,e, Representative western blot of free thiols in WT and corresponding mutant CLOCK (d) or followed by treatment with 200 μM H2O2 (e). f, Representative western blot showing the levels of sulfenylated thiols in WT- and C195S-CLOCK at 28 h and 40 h post serum shock. g, Representative mass spectrum (MS) ion chromatograms for the peptides corresponding to the iodoacetamide-alkyne probe (IPM)-labelled cysteines from H2O2 (150 μM)-treated recombinant CLOCK (amino acids 1–351) or control CLOCK. H2O2 treatment significantly decreased the levels of reduced C195 and C267 labelled by IPM in recombinant CLOCK (0.5-fold as the cut-off value). h, Representative MS of dimedone-labelled recombinant CLOCK peptide at C195. C#, dimedone-labelled C195. i, Sequencing of PCR products from wild-type mice (top) and ClockC195S mice (bottom). Black arrow indicates the location of mutation introduced by CRISPR/Cas9. The replaced nucleotide is shown in red. j, Representative western blot showing levels of CLOCK-SH labelled by BIAM in livers from WT and ClockC195S mice at CT28. Each genotype consists of a mixture of liver extracts from three mice. k,l, Representative western blot (k) and quantification (l) of CLOCK-SH labelled by BIAM in MAFs from WT and ClockC195S mice for one circadian cycle. n = 2 independent experiments for f-l and n = 3 independent experiments for d,e with similar results. Source data are provided in Statistics Source Data Figure 3. Unprocessed blots are shown in Source Data Figure 3.
To determine whether C195 mediates the rhythmic oscillations of the redox state of CLOCK protein in vivo, we introduced the C195S substitution into the endogenous Clock gene in mice using the CRISPR/Cas system, generating C195S knockin (ClockC195S) mice (Fig. 3i and Extended Data Fig. 3c). Interestingly, an obvious decrease in the amounts of CLOCK-SH was observed in ClockC195S livers compared with WT while the total CLOCK levels remained no change (Fig. 3j). Remarkably, the robust oscillations of CLOCK’s redox state, which were also observed in WT mouse adult fibroblasts (MAFs), were substantially impaired in ClockC195S MAFs (Fig. 3k,l and Extended Data Fig. 3d,e), indicating that C195 mediates the rhythmic oscillations of the redox state of CLOCK protein in vivo.
Redox control of CLOCK function
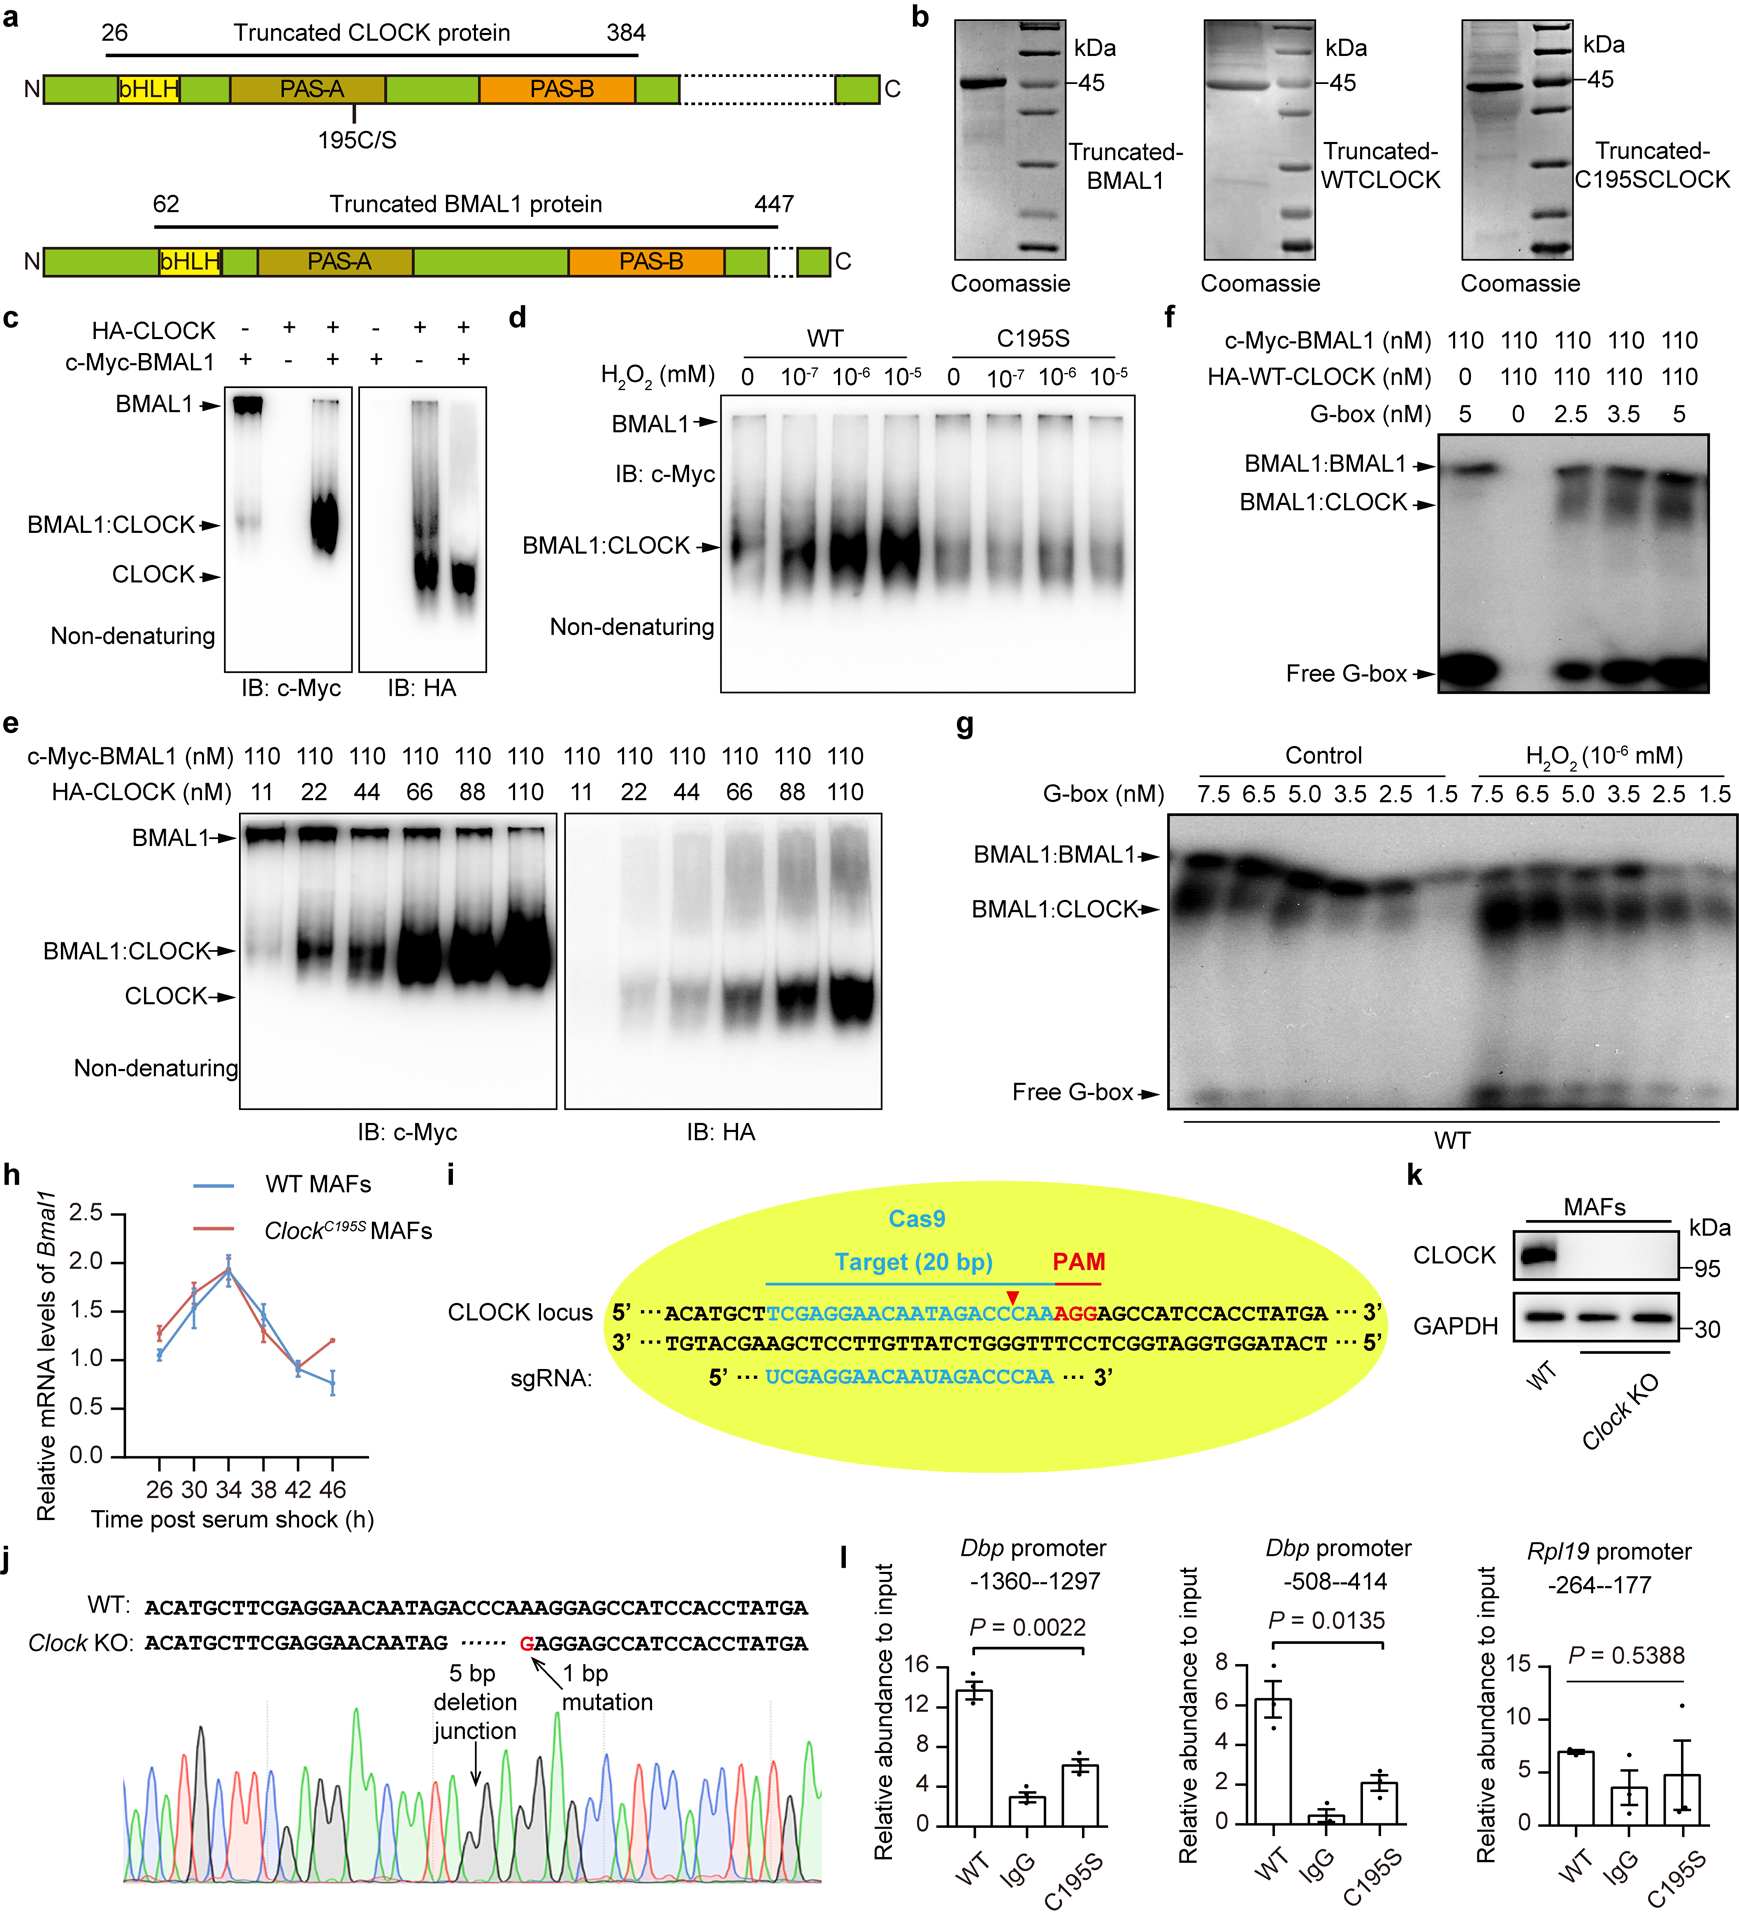
Based on the three-dimensional structure of CLOCK:BMAL1, C195, which is conserved among bHLH-PAS TFs, is located in a β barrel that resides at the CLOCK PAS-A domain, where it interacts with BMAL1 and forms hydrogen bonds with Valine213 (V213)26 (Fig. 4a). Thus, we speculated that redox modification of CLOCK on C195 would influence its interaction with BMAL1. Indeed, by using purified truncated proteins (Extended Data Fig. 4a,b), we observed that H2O2 significantly promoted the interaction between CLOCK and BMAL1, but this effect was completely inhibited by C195S mutation (Fig. 4b and Extended Data Fig. 4c,d). This was confirmed by a Scatchard analysis27 showing that binding affinities of CLOCK to BAML1 as well as the heterodimer to the G-box probe from Per2 promoter28 were significantly increased by H2O2 treatment and C195S completely blocked these increases (Fig. 4c–f and Extended Data Fig. 4e–g). These results indicate that the C195 residue of CLOCK is essential for the redox control of the interaction between CLOCK and BMAL1 and their DNA-binding activity. This notion was further supported by the observation that, in WT MAFs, H2O2 treatment significantly upregulated CLOCK’s downstream CCGs, whereas this upregulation was significantly dampened in ClockC195S MAFs (Fig. 4g).
Figure 4. Redox regulation of CLOCK at Cysteine195 is essential for normal clock function.
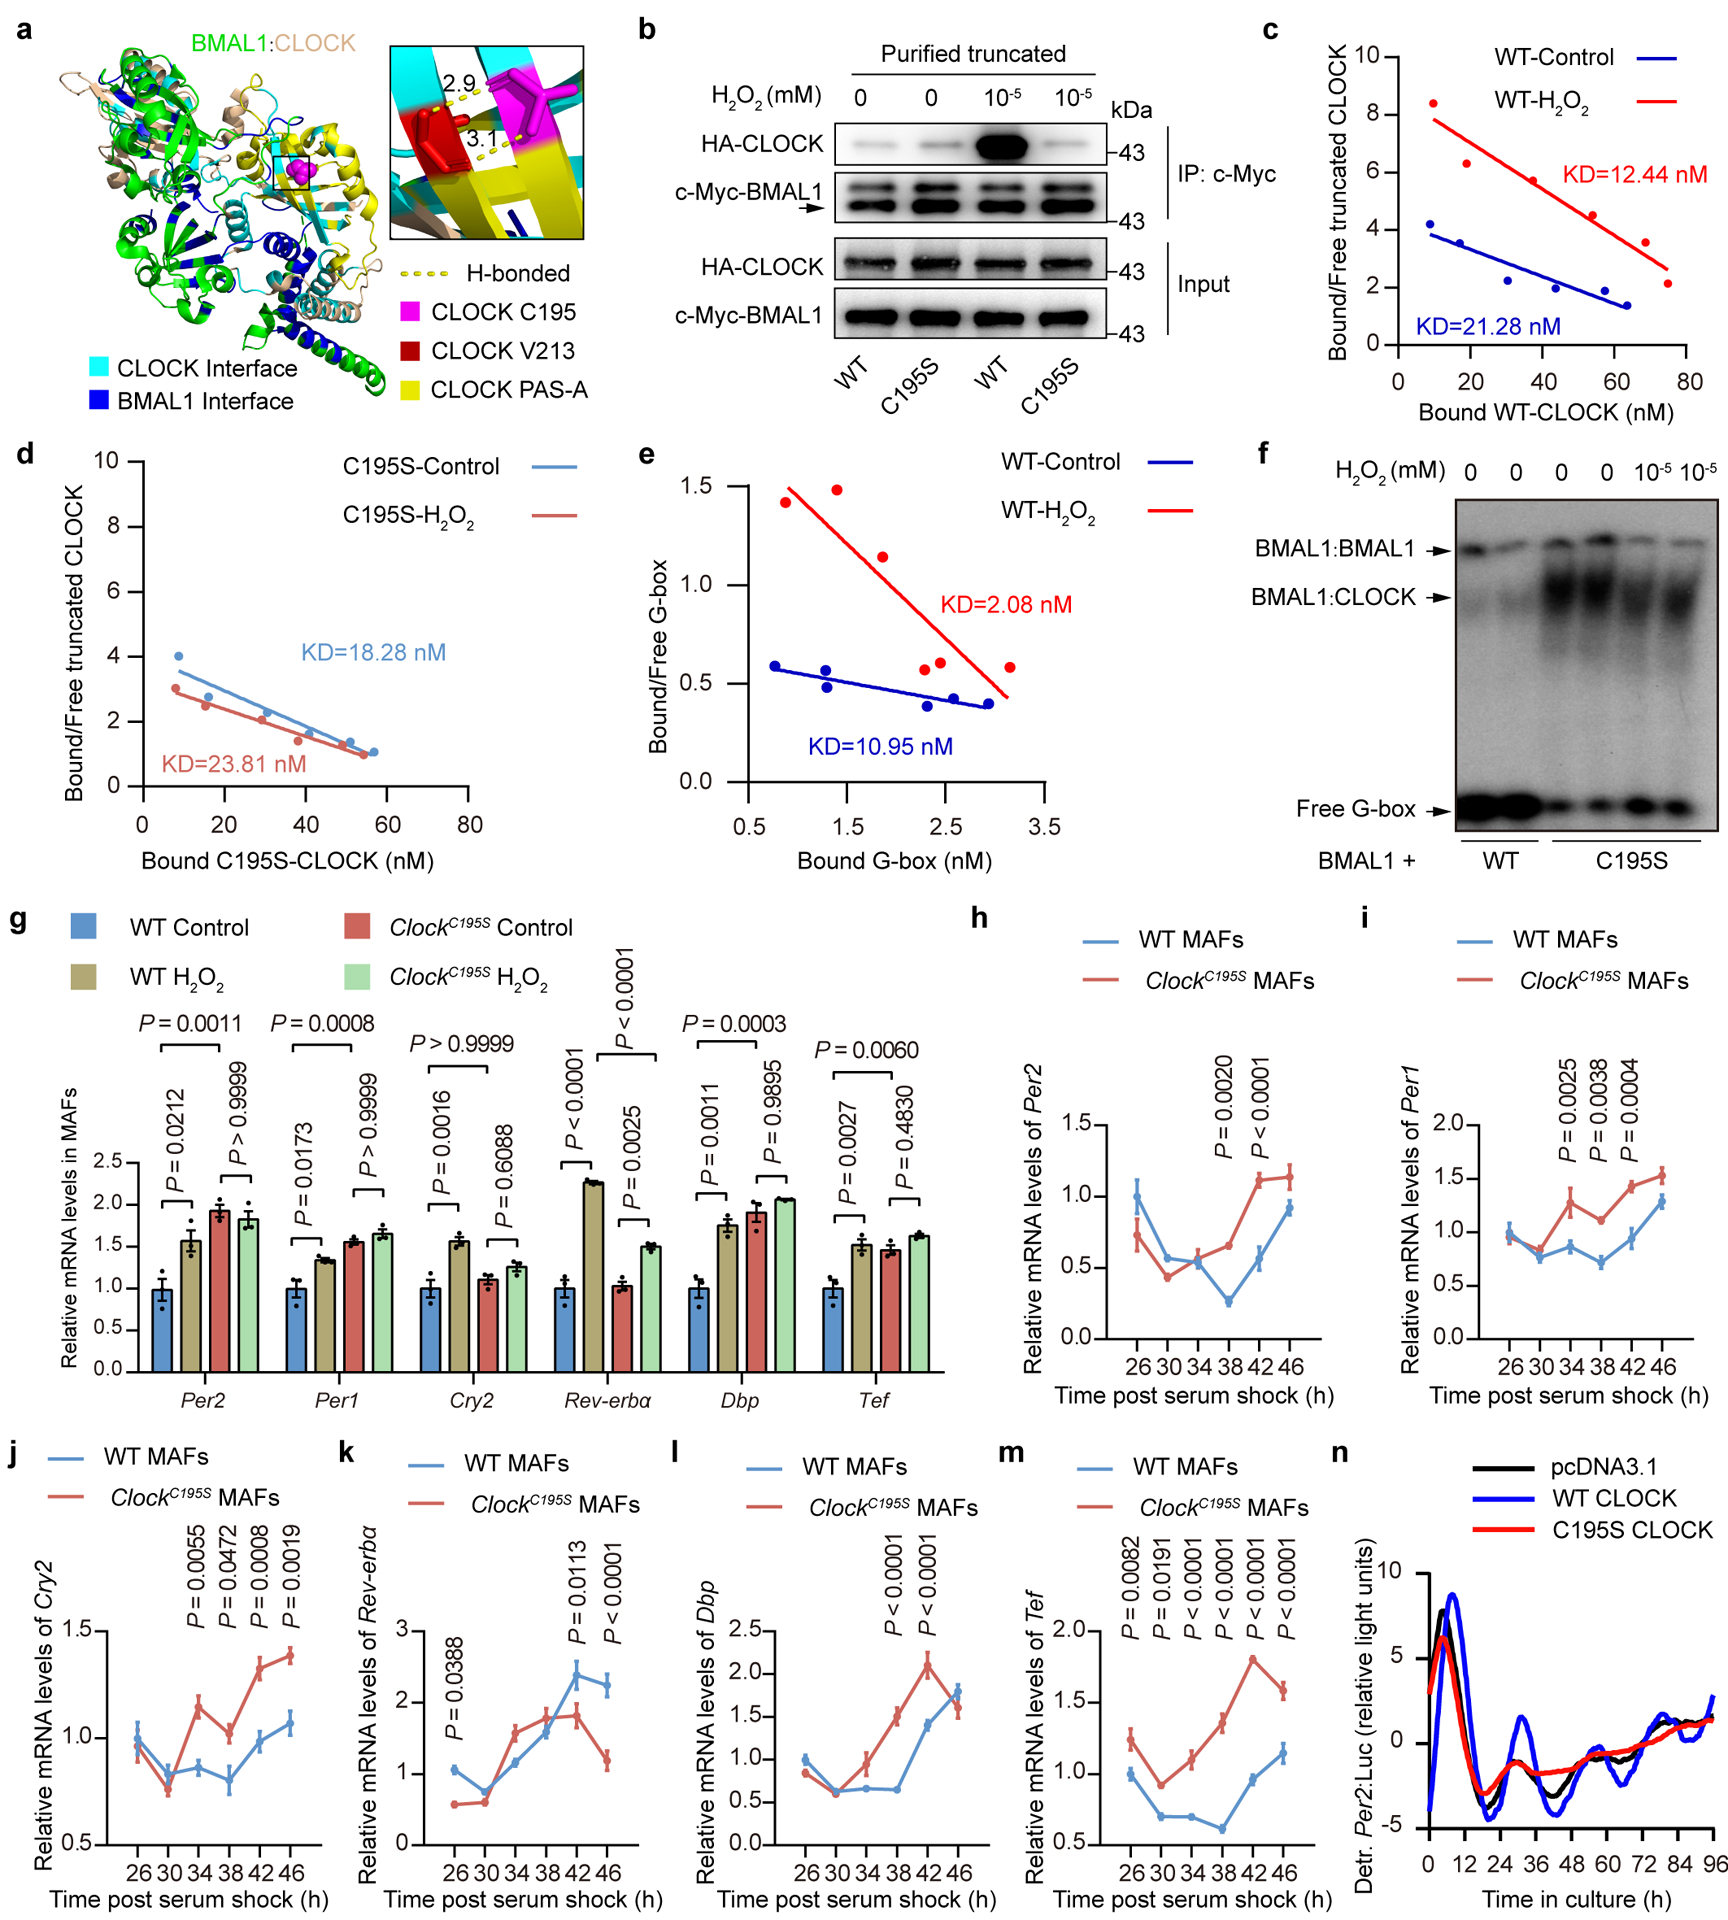
a, Environment of the C195 thiol in the CLOCK:BMAL1 crystal structure. b, Representative western blot showing the interactions between recombinant BMAL1 (amino acids 49–434) and recombinant WT- or C195S-CLOCK after treatment with or without H2O2 (10−5 mM). c,d, Scatchard analysis of the equilibrium binding of recombinant BMAL1 to recombinant WT-CLOCK (c) and C195S-CLOCK (d) treated with or without H2O2 (10−6 mM). e, Scatchard analysis of the equilibrium binding of the heterodimer of recombinant BMAL1:WT-CLOCK treated with or without H2O2 (10−6 mM) to a G-box probe. f, Representative EMSA of the heterodimer of BMAL1 and WT- or C195S-CLOCK proteins treated with or without H2O2 (10−6 mM) binding to the G-box probe. g, Relative mRNA levels of Per2, Per1, Cry2, Rev-erbα, Dbp, and Tef in WT MAFs and ClockC195S MAFs treated with or without H2O2 (50 μM) for 10 h (n = 3 independent biological samples). h-m, Relative mRNA levels of Per2 (h), Per1 (i), Cry2 (j), Rev-erbα (k), Dbp (l), and Tef (m) in WT and ClockC195S MAFs over the circadian cycle (n = 3 independent biological samples per time point). P values are shown for the comparisons of ClockC195S with WT. n, Representative baseline detrended bioluminescence recordings from synchronized Clock KO MAFs rescued by WT or C195S mutant CLOCK. P values were calculated using one-way ANOVA with a Bonferroni’s post hoc test (g) and an unpaired two-tailed Student’s t test (h-m). Data are presented as the means ± SEM. n = 3 independent experiments for b,f and n = 2 independent experiments for c-e and n = 6 independent experiments for n with similar results. Source data are provided in Statistics Source Data Figure 4. Unprocessed blots are shown in Source Data Figure 4.
Next, to assess the importance of the redox-sensitive C195 residue of CLOCK in vivo, we investigated the transcriptional rhythms of core circadian genes in WT and ClockC195S MAFs over circadian cycles. The results revealed that the rhythmicity of Per2, Per1, Cryptochrome 2 (Cry2), and Rev-erbα transcripts was significantly dampened (Fig. 4h–k) and CLOCK’s downstream CCGs were significantly upregulated (Fig. 4l–m) in ClockC195S MAFs compared with WT MAFs while the mRNA levels of Bmal1 oscillated similarly between the two genotypes (Extended Data Fig. 4h).
We further confirmed the importance of the redox-sensitive C195 residue in CLOCK on biological rhythms by performing rescue experiments using MAFs derived from CRISPR/Cas9-mediated Clock knockout (KO) mice (Extended Data Fig. 4i–k), which exhibited relatively weaker circadian rhythms29. Interestingly, ectopically expressed CLOCK conferred Clock KO fibroblasts with more robust circadian rhythmicity; in contrast, transfection of the C195S mutant allele substantially impaired circadian rhythmicity after one or two cycles of oscillations (Fig. 4n), which might partially due to the altered binding activity of C195S to the promoter of its target genes (Extended Data Fig. 4l). The first cycle represents immediately activated transcription which is reported to be due to the serum response factor (SRF)-myocardin-related transcription factors (MRTF) pathway30.
Modulations of H2O2 rhythms and CLOCK function
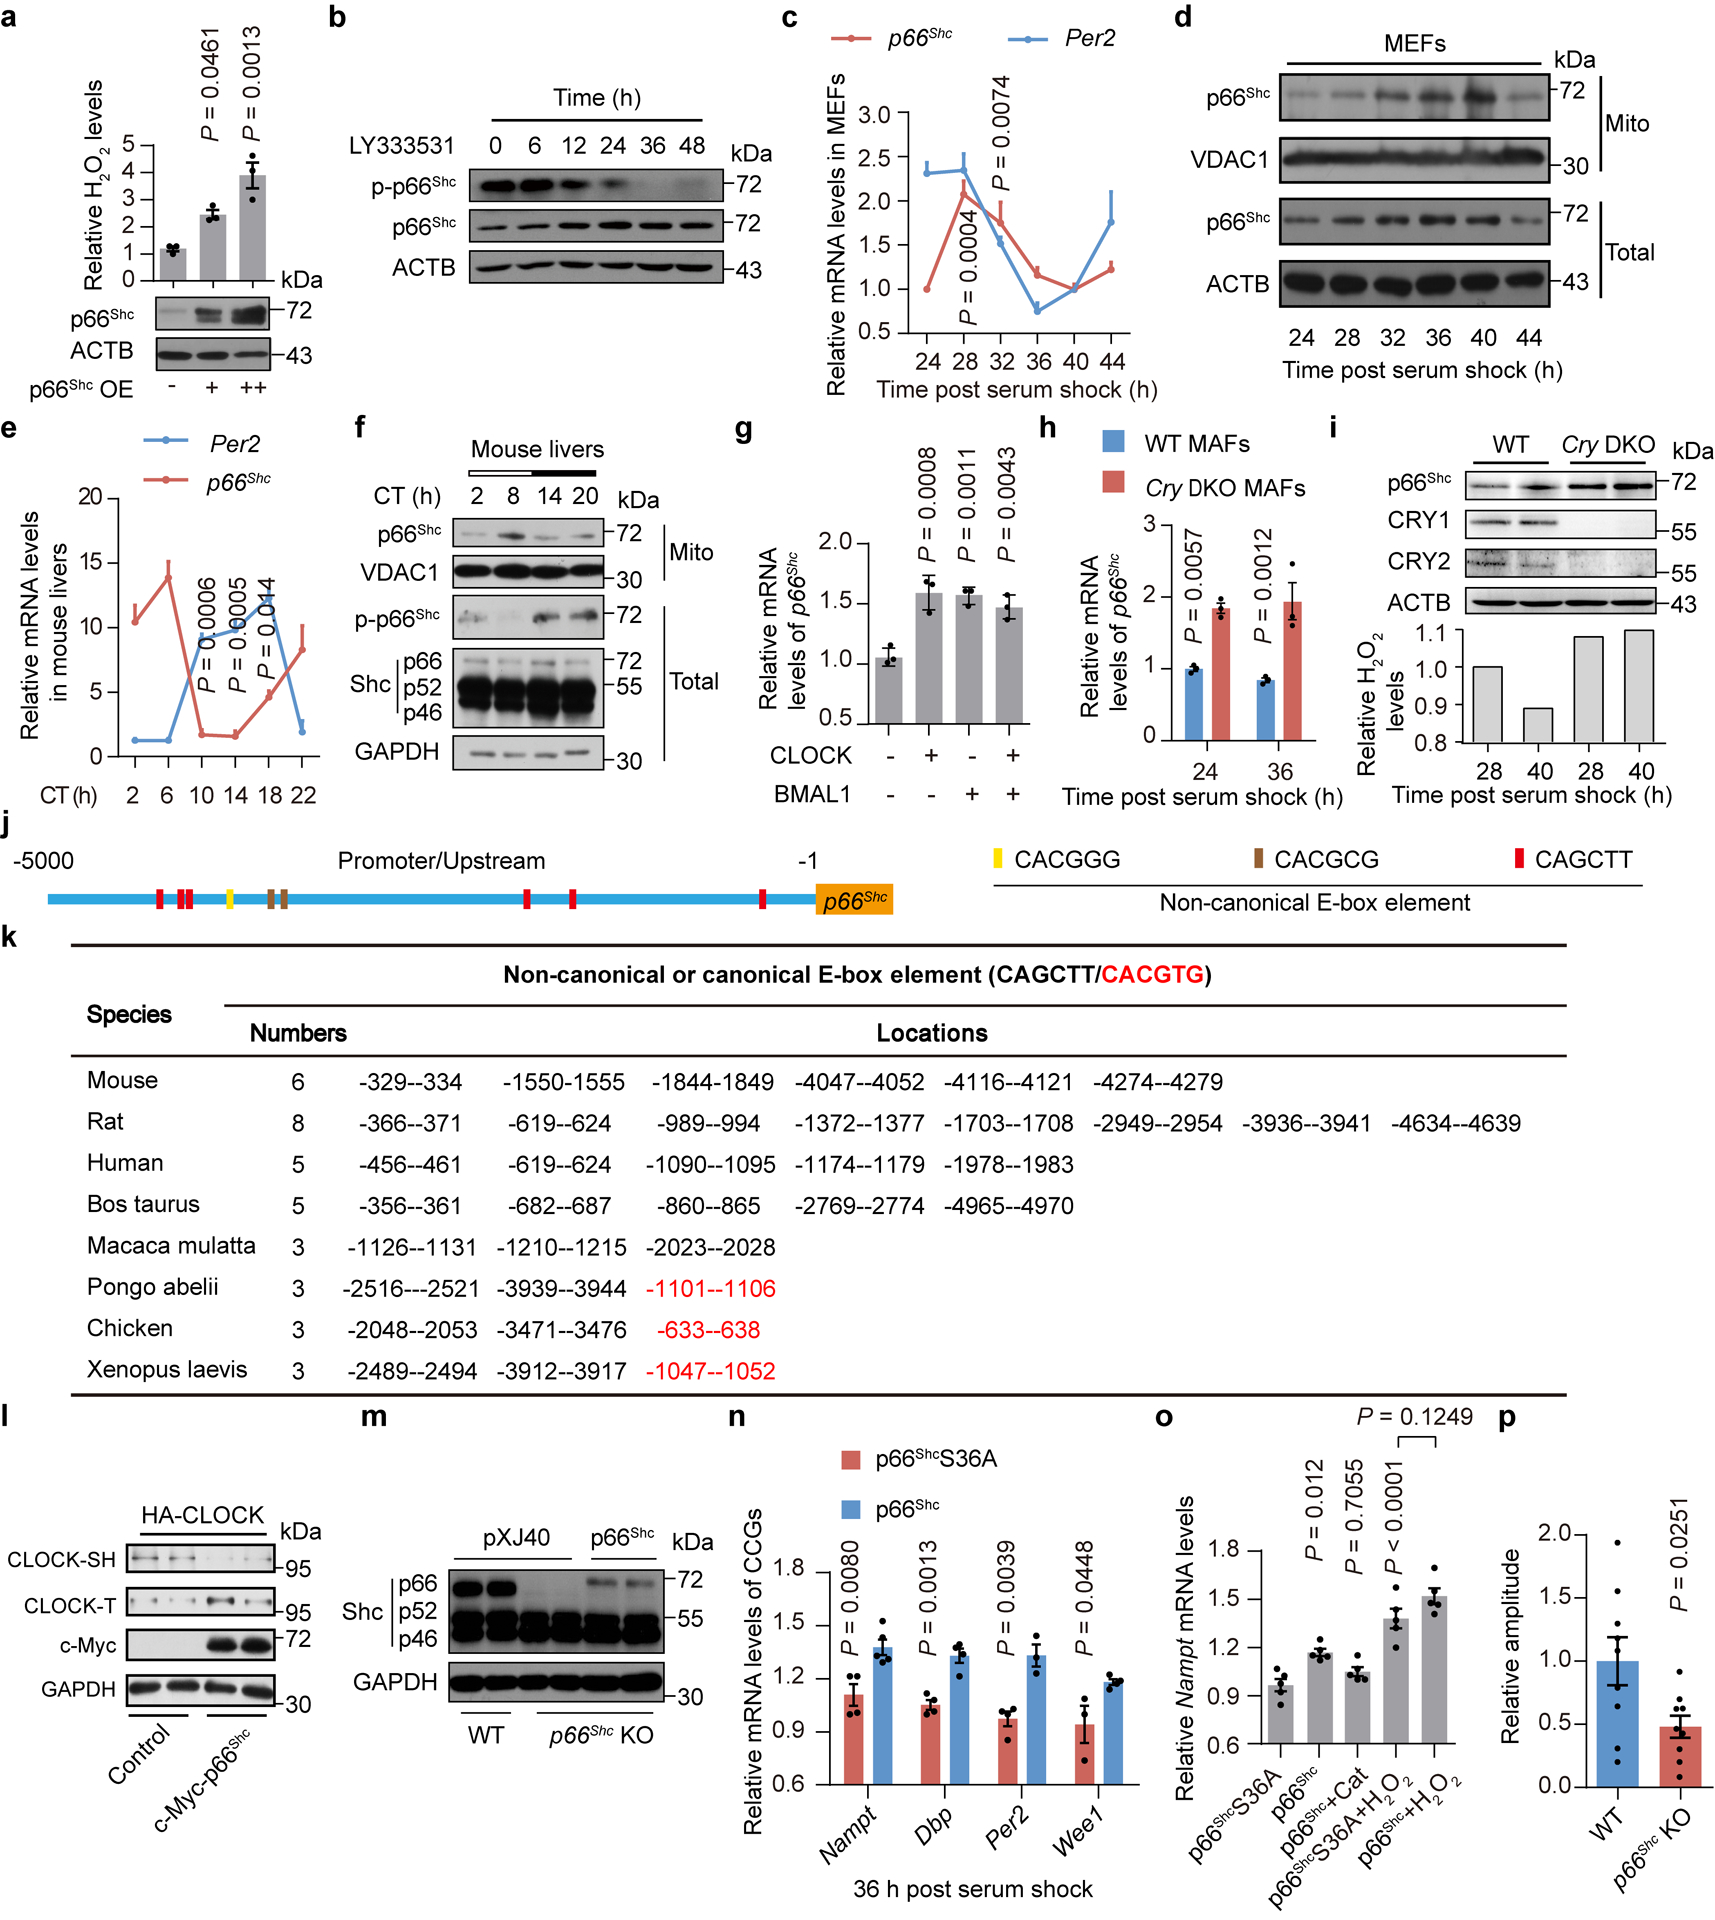
Intracellular H2O2 is generated in a highly regulated manner from various sources9, among which mitochondria produce H2O2 via exquisite mechanisms through specialized enzymes, including p66Shc9. As p66Shc is a genetic determinant of lifespan in mammals31 and the major generator of endogenous H2O29,32, we, therefore, tested whether p66Shc was involved in the process of maintaining the diurnal oscillation of endogenous H2O2 and the redox modification of CLOCK.
First, we confirmed that p66Shc overexpression elevated H2O2 concentrations in a dose-dependent manner (Extended Data Fig. 5a), while p66Shc KO significantly decreased H2O2 levels by at least 30% in MEFs (Fig. 5a). As phosphorylation of p66Shc at Ser36 is needed to transfer p66Shc from the cytosol to mitochondria and for p66Shc to produce H2O2 through the oxidation of cytochrome c33, we further examined the role of p66Shc on H2O2 levels using LY333531, a compound that inhibits this functional phosphorylation34 (Extended Data Fig. 5b). Indeed, LY333531 only reduced H2O2 production in WT MEFs, but not p66Shc KO MEFs (Fig. 5a). Moreover, levels of p66Shc mRNA and protein exhibited a robust circadian rhythm in both MEFs and mouse livers (Extended Data Fig. 5c–f). Accordingly, non-canonical E-box motifs, which are the common hallmark of the promoters of CCGs in mammals35, were observed within 5-kb promoter region in mouse p66Shc promoter (Extended Data Fig. 5j,k) and the expression of p66Shc could be modulated by TTFLs (Extended Data Fig. 5g–i). These data support a role for p66Shc in the circadian rhythm of endogenous H2O2 levels. Indeed, p66Shc KO not only significantly reduced the H2O2 concentration in MEFs (Fig. 5b) and in livers (Fig. 5c) throughout the circadian cycle but also dampened the circadian amplitudes of H2O2 oscillations by 40% (Fig. 5b). In addition, we also noted a significant decrease in both the levels and rhythmic amplitudes of H2O2 upon LY333531 treatment (Fig. 5d). In line with the role of p66Shc on H2O2 oscillations, p66Shc ablation affected the circadian oscillations of CLOCK redox modification levels in both livers and MEFs (Fig. 5e,f and Extended Data Fig. 5l).
Figure 5. P66Shc is indispensable for robust oscillations of H2O2 levels and normal CLOCK function.

a, Relative H2O2 levels in WT and p66Shc KO MEFs treated with alcohol or LY333531 (n = 3 independent biological samples). b-d, Oscillations of H2O2 levels in MEFs (b) or liver (c) from WT and p66Shc KO mice or in WT MEFs treated with alcohol or LY333531 (1 μM) (d) (n = 3 independent biological samples per time point, except the liver from WT mice where n = 5 animals). e,f, Free thiols of CLOCK in MEFs (e) or livers (f) from WT and p66Shc KO mice for one circadian cycle. g,h, Relative mRNA levels of CCGs in WT and p66Shc KO MEFs (g) or KO MEFs treated with p66Shc over-expression or Clock knockdown (h) (n = 3 independent biological samples). i, Representative baseline detrended bioluminescence recordings and period lengths of mPER2::LUC liver explants from WT or p66Shc KO mice (n = 7 independent biological samples). j,k, Representative baseline detrended bioluminescence recordings, period lengths and representative western blot of total p66Shc protein or phosphorylation at Ser36 from synchronized PLuc cells treated with p66Shc knockdown by siRNA (j) (n = 3 independent biological samples, except the control where n = 5), or CGP53353, a phosphorylation inhibitor of p66Shc at Ser36 (k) (n = 3 independent biological samples). P values in b,c,g,i are shown for the comparisons of p66Shc KO with WT. P values in d,j,k are shown for the comparisons of control with others. P values in h are shown for the comparisons of p66Shc overexpression with others. P values were calculated using an unpaired two-tailed Student’s t test (b,c,d,g,i) and one-way ANOVA with a Bonferroni’s post hoc test (a,h,j,k). Data are presented as the means ± SEM. n = 2 independent experiments for e,f and n = 6 independent experiments for j,k with similar results. Source data are provided in Statistics Source Data Figure 5. Unprocessed blots are shown in Source Data Figure 5.
We then asked whether p66Shc regulated the transcriptional activity of CLOCK. As expected, p66Shc KO decreased the mRNA levels of CCGs (Extended Data Fig. 5m and Fig. 5g), which was rescued by p66Shc overexpression in a manner that was dependent on CLOCK (Extended Data Fig. 5m and Fig. 5h). We also confirmed that the effects of p66Shc on CLOCK relied on H2O2 production with S36A mutation which blocks H2O2 production effects of p66Shc31 (Extended Data Fig. 5n,o). We further determined the role of p66Shc on circadian oscillations by generating p66Shc KO mice carrying the mPer2Luciferase reporter gene (mPER2::LUC). Notably, p66Shc KO liver explants displayed a longer period and weaker amplitude than WT explants (Fig. 5i and Extended Data Fig. 5p). Furthermore, both knockdown of p66Shc and inhibition of p66Shc phosphorylation at Ser36 significantly elongated the circadian period in synchronized PLuc cells (Fig. 5j,k). Taken together, these results support the conclusion that p66Shc is essential for robust rhythmic oscillations of endogenous H2O2 levels and normal CLOCK function.
H2O2 rhythms are essential for biological clocks
We next investigated how an altered H2O2 rhythm affected hepatic circadian gene expression by comparing liver transcriptomes from p66Shc KO mice and their corresponding WT littermates throughout the circadian cycle. RNA sequencing (RNA-seq) analysis revealed that, of the 1,449 oscillating transcripts identified in WT mouse livers (P < 0.01 as the cut-off value), only 420 genes (29.0%) oscillated similarly in p66Shc KO mouse livers, and surprisingly, 1053 genes were newly oscillating exclusively in the p66Shc KO group (Fig. 6a–c). Interestingly, a significant enrichment of the canonical CLOCK E-box motif (CACGTG) was observed in the promoters of altered oscillating transcripts due to the loss of p66Shc (Fig. 6d), consistent with the hypothesis that the effects of an altered H2O2 rhythm on circadian oscillations partially rely on a redox-sensitive CLOCK. This hypothesis was further supported by the observation that altered oscillating transcripts extensively overlapped (67.0%) with the cistrome of CLOCK (CT12)36 (Fig. 6e). Phase analysis showed that the peak expression of oscillatory genes in WT livers was distributed across all phases, with CT4 and CT12 having the most circadian-regulated genes (Extended Data Fig. 6a), similar to previous reports36. In sharp contrast, the p66Shc KO group showed a rather irregular phase pattern (Extended Data Fig. 6a). Strikingly, phase analysis of the 420 genes that retained oscillations in both WT and p66Shc KO mice indicated that 65% of circadian genes showed a shift in phase in p66Shc KO mice (Extended Data Fig. 6b).
Figure 6. P66Shc KO reprograms hepatic transcriptome oscillations and metabolic homeostasis.
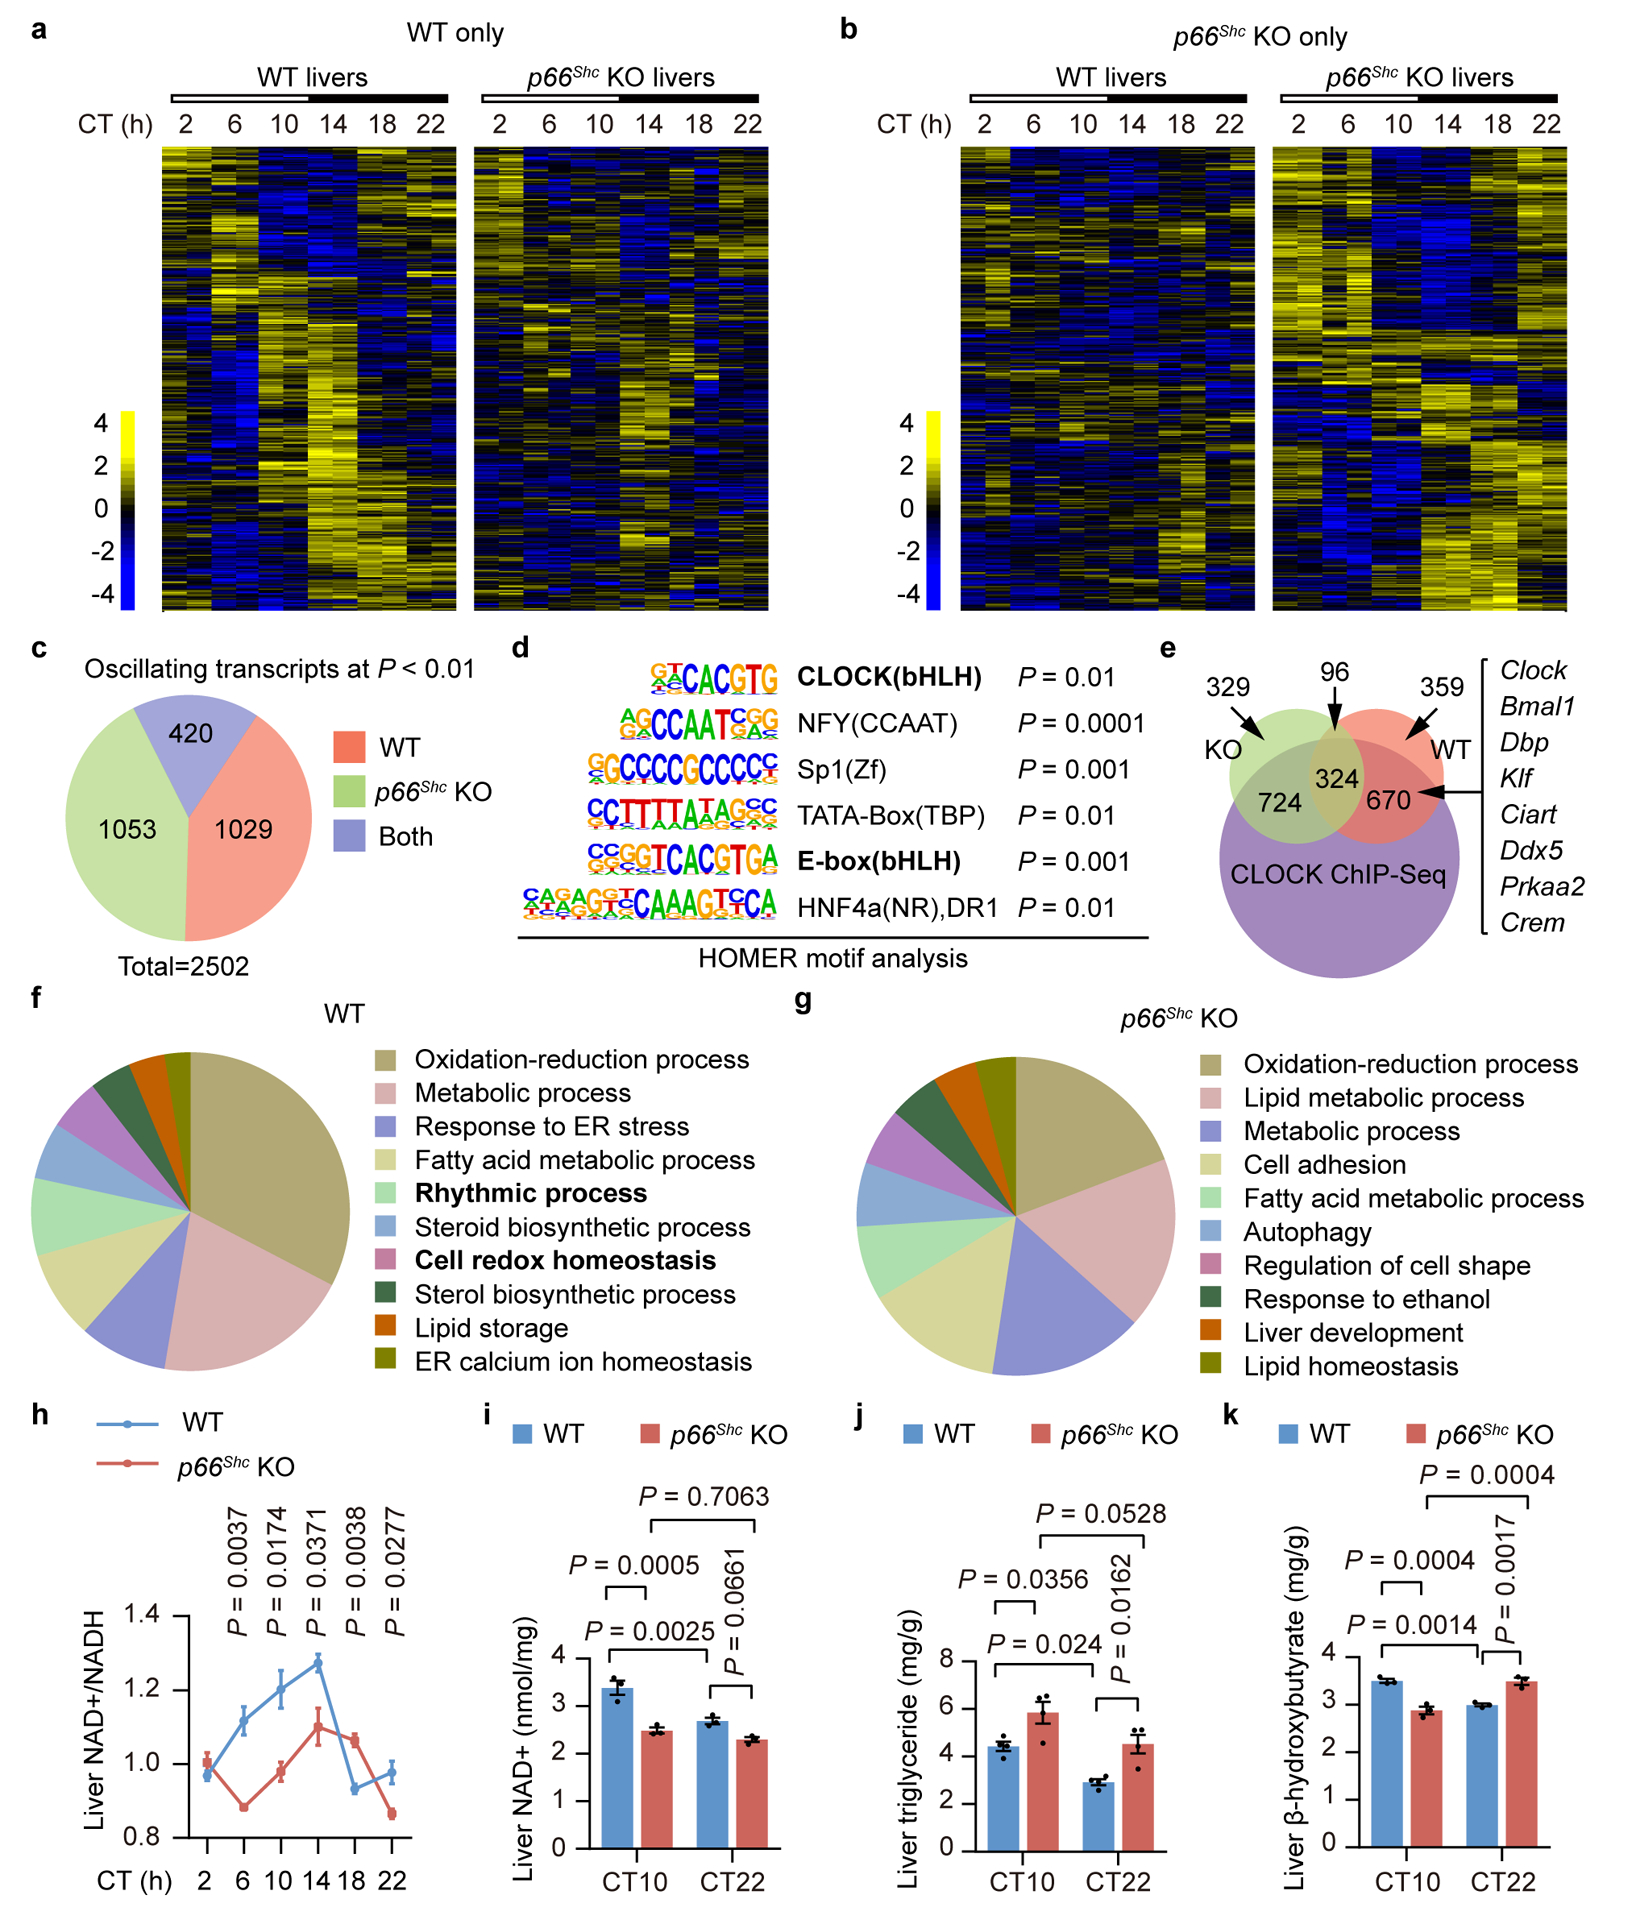
a,b, Heatmaps for genes uniquely oscillating in WT (a) or p66Shc KO (b) mouse livers (P < 0.05, JTK_Cycle). RNA-seq analysis of the whole transcriptome was performed using total RNA obtained from three mouse livers each time point, which were pooled and then divided into two samples, at 4-h intervals for one circadian cycle under DD conditions. c, Pie charts indicate actual numbers of oscillating transcripts only in the WT, only in the p66Shc KO, or in both the WT and p66Shc KO groups (P < 0.01, JTK_Cycle). d, HOMER known motif analysis of transcription factor-binding sites enriched in promoters of the gene whose expression was altered when p66Shc was disrupted. ZOOPS scoring (zero or one occurrence per sequence) coupled with the hypergeometric enrichment calculations was used to determine motif enrichment (total target sequences = 1823, total background sequences = 28426), and P < 0.05 was considered statistically significant. e, Venn diagram of overlap between transcripts with altered circadian oscillations and CLOCK cistrome at CT12 determined by ChIP-seq. f,g, Top 10 GO terms for biological processes in which oscillatory expression is lost in p66Shc KO mice (f) or newly oscillating genes exclusively expressed in the p66Shc KO group (g) identified using the DAVID pathway analysis tool. h, Oscillations of NAD+/NADH levels in livers from WT and p66Shc KO mice (n = 3 independent biological samples per time point). P values are shown for the comparisons of p66Shc KO with WT. i-k, Relative NAD+ (i), triglyceride (j), and β-hydroxybutyrate (k) levels in WT and p66Shc KO mouse livers (n = 3 independent biological samples, except the triglyceride where n = 4). P values in h are shown for the comparisons of p66Shc KO with WT. P values were calculated using an unpaired two-tailed Student’s t test (h) and one-way ANOVA with a Bonferroni’s post hoc test (i,j,k). Data are presented as the means ± SEM. Source data are provided in Statistics Source Data Figure 6.
Based on the results of the pathway analysis, altered oscillating transcripts mediated by p66Shc KO were enriched in the terms oxidation-reduction process and metabolic process, among others (Fig. 6f,g). Therefore, we further explored the role of p66Shc in metabolism. Consistent with previous reports37, the redox state of nicotinamide adenine dinucleotide (NAD)+/NADH, which is closely interrelated with metabolism and the circadian clock38,39, oscillated rhythmically in WT livers (Fig. 6h). Strikingly, these robust oscillations were significantly disturbed in p66Shc KO livers (Fig. 6h). In addition, p66Shc KO also induced a disturbance in hepatic NAD+ (Fig. 6i), triglyceride (Fig. 6j), and β-hydroxybutyrate levels (Fig. 6k).
We further sought to determine whether the p66Shc KO-mediated perturbation of the endogenous H2O2 modulates the circadian behaviour of mice. Although p66Shc was previously reported to be expressed at barely detectable levels in the mature central nervous system in mice40, surprisingly, we found that it was not only expressed in the suprachiasmatic nucleus (SCN), the central circadian pacemaker41 (Extended Data Fig. 7a), but also showed obvious rhythmicity at both the mRNA and protein levels (Extended Data Fig. 7b and Fig. 7a,b). Additionally, endogenous H2O2 levels in SCN from WT mice exhibited significant time-of-day variations, whereas these variations were abolished in SCN from p66Shc KO mice (Fig. 7c). Subsequently, we studied the effects of p66Shc gene deletion on the circadian behaviour of mice. Actograms showed that the circadian period of KO mice was significantly increased compared with that of WT mice in males (Fig. 7d,e) as well as in female mice (Extended Data Fig. 7c). In addition, phase-delaying effects of early night light were greatly potentiated in p66Shc KO mice at CT14 compared with that of WT mice (Fig. 7f,g).
Figure 7. P66Shc modulates circadian behaviours in mice.
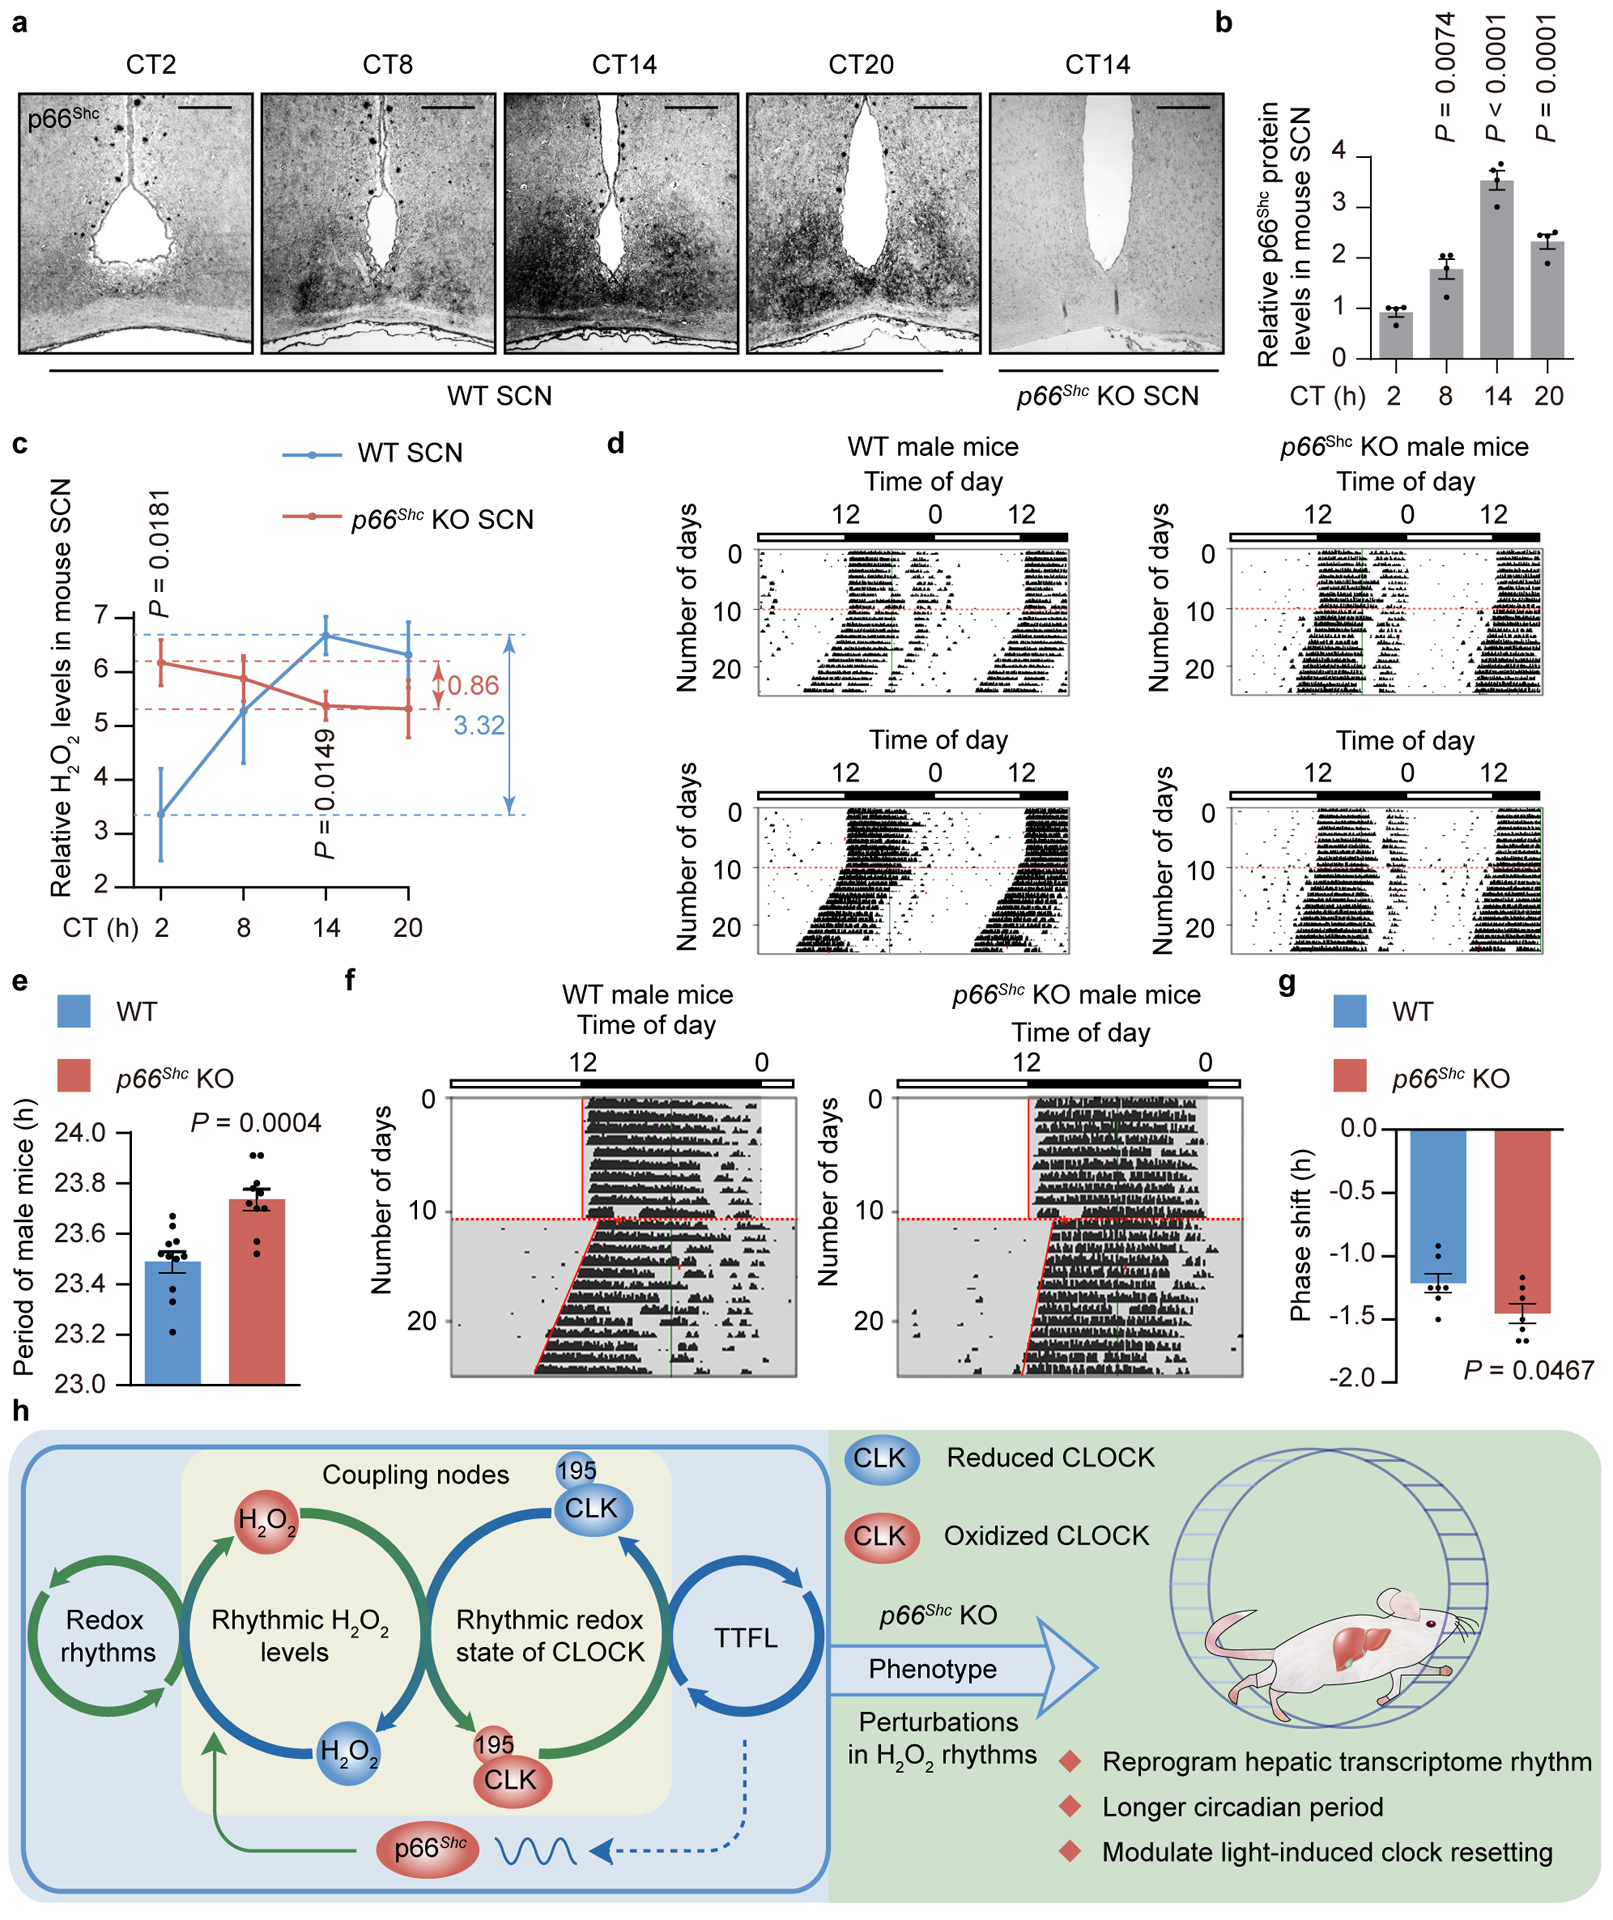
a,b, Representative immunohistochemical staining of p66Shc protein in SCN at 6-h intervals over a 24-h period under DD conditions; p66Shc KO SCN served as a negative control. Scale bar, 100 μm. Bar diagrams show quantitative data from 4 independent biological samples. P values are shown for the comparisons to CT2. c, Relative H2O2 levels in WT and p66Shc KO SCN for one circadian cycle (n = 6 independent biological samples, except the WT at CT2 and CT14 and p66Shc KO at CT2 and CT20 where n = 5). d,e, Representative double-plot actograms of wheel-running activities (d) and period lengths (e) from two WT (left) and two p66Shc KO male mice (right) under DD conditions after LD entrainment (n = 11 mice for WT and n = 10 mice for p66Shc KO). Red lines indicate the day on which DD conditions were initiated. f,g, Representative actograms of wheel-running activities (f) and phase shifts (g) from WT (left) and p66Shc KO male mice (right) under DD conditions after exposure to a single light pulse (15 min, 400 lux) at CT14 (n = 7 mice for WT and n = 8 mice for p66Shc KO). Red asterisks denote a light pulse. P values in c,e,g are shown for the comparisons of p66Shc KO with WT. P values were calculated using an unpaired two-tailed Student’s t test (c,e,g) and one-way ANOVA with a Bonferroni’s post hoc test (b). Data are presented as the means ± SEM. h, Model showing that redox rhythms and TTFLs are intrinsically coupled to cooperatively regulate the biological clock through diurnal oscillations of endogenous H2O2 and rhythmic redox modification of CLOCK. Source data are provided in Statistics Source Data Figure 7.
Taken together, the data provide the convincing genetic evidence that p66Shc is required to maintain normal circadian rhythms, suggesting an important role for the oscillations of endogenous H2O2 levels in the hepatic circadian gene expression, metabolic homeostasis, and behavioural rhythms of mice.
Discussion
Here, we provide a convincing demonstration supporting the notion that daily H2O2 oscillations are intrinsically linked to the circadian system through the reversible oxidative modification of CLOCK and are essential mechanistic timekeeping components (Fig. 7h). These findings suggest important biological functions of the diurnal oscillations of endogenous H2O2 levels in the circadian rhythm of mammals and a critical role for rhythmic CLOCK redox modification in bridging the gap between redox signalling oscillations and TTFLs.
Our results also indicate a physiological function for p66Shc in tuning the internal physiology of an organism to the external environment by modulating the rhythm of endogenous H2O2 levels. Interestingly, the expression of p66Shc showed obvious rhythmicity in both livers and SCN, suggesting that p66Shc-mediated redox signalling rhythms may be conversely subject to circadian regulation. Indeed, rhythms in peroxiredoxin oxidation, which were reported to exist in cells lacking core circadian components and in Drosophila with per01 and ClkJrk disruptions, were also influenced by the TTFLs5,42. Thus, our data support a model in which accurate timekeeping mechanisms in mammals are sustained by a reciprocal interaction in which the circadian system drives the rhythms of endogenous H2O2 levels (mostly through rhythmic expression of p66Shc), and conversely, diurnal oscillations of endogenous H2O2 levels, via the redox states of CLOCK, regulate the core oscillator generated by conventional TTFLs (Fig. 7h).
Changes in the nutritional and metabolic states43, aging39,44 epigenetic state45, microbiota46, and even pathophysiological conditions of other tissues47 have been reported to reprogram the hepatic transcriptome, leading to hepatic metabolism reprogramming48 and even aberrant circadian behaviours49,50. Intriguingly, similar phenotypes were also observed in animals with disturbed endogenous H2O2 rhythms mediated by p66Shc KO. Considering the roles of p66Shc in metabolic diseases51 and aging31, which are characterized by higher p66Shc activity52,53, and the growing recognition that a redox imbalance54 and circadian disruption55 contribute to the molecular pathogenesis of metabolic disorders and aging, we are tempted to speculate that rhythmic oscillations in endogenous H2O2 levels and TTFLs are intimately intertwined through a CLOCK redox modification to constitute a network structure that is indispensable for maintaining fitness in a constantly changing environment.
Methods
Animals.
P66Shc KO mice were kindly provided by P. G. Pelicci and M. Giorgio (European Institute of Oncology, Milan, Italy)31. MPer2::LUC mice were purchased from the Jackson Laboratory (#006852). P66Shc KO mice were crossed to mPer2::LUC mice. From the heterozygous offspring, we created a double homozygous p66Shc KO; mPer2::LUC. The CRISPR-mediated Clock knockout (Clock KO) mice were produced in our lab. The CRISPR-mediated CLOCK C195S knockin (ClockC195S) mice were produced by Beijing View Solid Biotechnology, China. All mice were maintained on the C57BL/6J background and were housed in a standard animal maintenance facility on a 12-h light/dark (L/D) cycle. Eight- to ten-week old male and female p66Shc KO and WT mice were used for experiments. Six- to eight-week old male Clock KO and ClockC195S mice as well as the littermate control were used for isolation of mouse adult fibroblasts (MAFs). For the tissue culture experiments, four- to six-week old male double homozygous p66Shc KO; mPer2::LUC mice were used. All animal protocols were approved by the Animal Care and Use Committee at the Institute of Basic Medical Sciences, Chinese Academy of Medical Sciences, and Peking Union Medical College. WT littermate controls were used throughout the analyses.
Cell lines.
N2a murine neuroblastoma cells and HEK293T cells were obtained from the National Infrastructure of Cell Line Resource in China. U2OS cells harboring Per2:dLuc (PLuc cells) were generated following a previously described protocol56. Mouse embryonic fibroblasts (MEFs) were prepared and cultured using routine methods performed in our laboratory57 and were derived from either p66Shc KO mice or normal (control) mice. Mouse adult fibroblasts (MAFs) were derived from Clock KO mice or ClockC195S mice or Cry DKO or their corresponding control mice.
Antibodies and reagents.
The primary antibodies used for immunoblotting were Shc (cat# 610878, 4080749, 30/SHC, BD bioscience) , Shc (phospho-S36) (cat# ab54518, 6E10, Abcam), CLOCK (cat# 5175, 02/2014–1, D45B10, Cell Signaling Technology), cryptochrome 1 (Cry1) (cat# ab104736, GR10228–1, Abcam), Cry2 (cat# PA5–13125, GR22476–1, Thermo Scientific), HA (cat# 3724, 08/2015–9, C29F4, CST), c-Myc (cat# M5546, 103M4769, monoclonal 9E10, Sigma), beta-actin (ab8227, Abcam), glyceraldehyde 3-phosphate dehydrogenase (GAPDH) (cat# ab8245, 291713–3, 6C5, Abcam), voltage-dependent anion channel 1 (VDAC1) (cat# ab15895, Abcam), and horseradish peroxidase (HRP)-conjugated streptavidin (cat# S911, 1402208, Thermo Scientific). All antibodies were used at 1:1000 dilution except beta-actin, GAPDH which were used at 1:3000 dilution. HRP-conjugated streptavidin was used at 1:2000 dilution. Immunostaining was performed with the p66Shc antibody (cat# ab131515, Abcam). ChIP was performed with the HA (cat# 3724, 08/2015–9, C29F4, CST). Other reagents used in this study included Lipofectamine RNAiMAX (13778–075, Invitrogen), ScreenFect A Transfection Reagents (S3001, InCella), VigoFect Transfection Reagent (T001, Vigorous Biotechnology), X-tremeGENE HP DNA Transfection Reagent (06366236001, Roche), LY333531 (SML0693, Sigma), CGP53353 (C7866, Sigma), BIAM (B1591, Molecular Probes), NEM (E3876–5G, Sigma), DCP-Bio1 (EE0028, Kerafast), 2-benzyl-1,2-thiazinan-5-one 1,1-dioxide (BTD) (produced in Kate S. Carroll’s lab), hydrogen peroxide solution (H2O2) (88597, Sigma), catalase from bovine liver (C1345–1G, Sigma), streptavidin-magnetic (88817, ThermoFisher), Ni-NTA His bind Resin (70666–5, Novagen), biotin (B4639–100MG, Sigma), the Hydrogen Peroxide/Peroxidase Assay Kit (fluorometric) (STA-344, Cell Biolabs), T4 Polynucleotide Kinase (M0201L, NEB), Alkaline Phosphatase, Calf Intestinal (CIP) (M0290S, NEB), ATP, [g-32P] (BLU002A/NEG002A, PerkinElmer), and NE-PER Nuclear and Cytoplasmic Extraction Reagents (78833, Thermo Scientific), proteinase inhibitors (C0001, TargetMol), PMSF (ST505, Beyotime), and IP lysis buffer (P0013, Beyotime).
Constructs and site-directed mutagenesis.
The eukaryotic expression vector encoding the p66Shc gene was a generous gift from Dr. Li58,59. The pcDNA3-HA-CLOCK and pcDNA3-HA-BMAL1 vectors were generous gifts from Dr. Kondratova60. The HyPerRed plasmid was originally constructed in the laboratory of Dr. Belousov and ordered from Addgene (Plasmid #48249)15. Per1 (1.8 kb) promoter fragments were amplified from mouse genomic DNA by PCR and cloned into the pGL3 firefly luciferase vector (Promega) as previously described61. Truncated BMAL1 and CLOCK were constructed as routinely done in our lab. Site-directed mutagenesis was performed using the Fast Mutagenesis System kit (FM111, Transgene) and confirmed by sequencing. Codons for eight cysteine residues in the coding sequence of pcDNA3-HA-CLOCK (C7, C194, C195, C250, C267, C324, C337, and C371) were replaced by serine codons.
CRISPR/Cas9-mediated Clock gene knockout.
The pcS7-Cas9 plasmid containing the optimized Cas9 gene and T7 promoter was purchased from Viewsolid Biotech and the pUC57-sgRNA expression vector was a gift from Dr. Xingxu Huang62 (Addgene plasmid #51132). Cloning of the sgRNA into the vector was performed according to the protocol from Church Lab (http://www.addgene.org/crispr/church/). The pcS7-Cas9 and pUC57-sgRNA vector were respectively linearized using the endonucleases NotI and DraI, respectively. The linearized plasmids were then extracted with phenol chloroform and used as template for in vitro transcription using the mMESSAGE mMACHINE® T7 Kit (AM1344, Invitrogen). The Cas9 RNA and sgRNA were precipitated with LiCl and purified using the QIAGEN RNeasy Cleanup Kit. Female C57BL/6J mice and ICR mice were used as embryo donors and foster mothers, respectively. Cas9 mRNA and sgRNA were mixed and injected into zygotes. Thereafter, the injected zygotes were transferred into the uterus of a pseudopregnant female ICR mouse.
CRISPR-mediated CLOCK C195S knockin (ClockC195S) mice.
CRISPR-mediated CLOCK C195S knockin (ClockC195S) mice were produced by Beijing View Solid Biotechnology, China as described previously63. After microinjection of Cas9 mRNA, corresponding Clock-C195S-gRNA1 (Figure S3C) and donor DNA (Table S2), zygotes were transferred to pseudopregnant females. Two-week-old newborn mice were genotyped by sequencing the PCR products amplified from tail-derived DNA (Clock-C195S-F: 5’-AGGCTAGACTGTTACCAAGA GAC-3’; Clock-C195S-R: 5’-GTGTGCGTTTGTATAGTTCCTTCA-3’). The mutant mice were mated with wild-type C57BL/6J mice to obtain heterozygous ClockC195S mice.
Isolation of mouse adult fibroblasts (MAFs).
The mouse ear was cut into a 1.5 mL microcentrifuge tube containing 0.5 ml alcohol. After washed with 0.5mL HBSS, 0.5 mL collagenase (final concentration after addition is 1000U/mL) was added followed by incubation at 37°C for 25 minutes. Wash once with HBSS by mixing and centrifuging, discarding the supernatant. Add 0.5mL 0.05% trypsin, mix thoroughly, and incubated at 37℃ for 20 minutes. After resuspend the pellet in 0.5 mL DMEM containing 10% FBS, triturate (pipet up and down) to break up cell aggregates. Plate suspension into a 3.5 cm cell culture dish and add 2 mL DMEM containing 10% FBS. Incubate in a 37°C, 5% CO2 humidified incubator.
Cell culture and transfection.
N2a cells, HEK-293T cells, MEFs, or PLuc cells were cultured in Dulbecco’s Modified Eagle’s Medium (DMEM) supplemented with 10% fetal bovine serum (FBS), 100 units/mL penicillin, and 100 mg/mL streptomycin at 37°C in a 5% CO2 atmosphere. For experiments performed at specific time point, the appropriate density of cells was seeded and grown for 24 h until confluent. Cells were then synchronized with 50% horse serum for 2 h, followed by replacement with 0.4% DMEM for the subsequent culture. Cells were harvested at 4-h intervals for one circadian cycle from 24 to 44 h. In separate experiments, 293T and N2a cells were transfected with expression plasmids using VigoFect transfection reagent and MEFs were transfected with expression vectors using ScreenFect A Transfection Reagents, according to the manufacturer’s recommendations. U2OS cells were transfected with pPB-HyPerRed/GFP-puDtk and pBase plasmid and selected through flow cytometry sorting for three times to get the U2OS stably expressing HyPerRed and GFP.
Proteins purification.
The HEK293T cells were transfected with pcDNA3.1-His-Myc-BMAL1, pcDNA3.1-His-HA-WT-CLOCK, or pcDNA3.1-His-HA-C195S-CLOCK plasmids for 48 h, respectively. Cells were collected with 1ml Ni-NTA bind buffer in 1.5 ml centrifuge tube. After ultrasonicated and centrifugated for 5min at 15,000 g, supernatant was collected and 100 μl of a 50% slurry of Ni-NTA His bind Resin was added into each tube. After mixed gently for 1 h at 4 ℃, the mixtures were centrifugated for 10 s at 15,000 g to pellet the resin. The supernatant was transferred to a fresh tube. After washed twice by 300 μl of Ni-NTA Wash Buffer (300 mM NaCl, 50 mM sodium phosphate buffer, 20 mM imidazole, pH 8.0), the resin was eluted with 200 μl Ni-NTA Elute Buffer (300 mM NaCl, 50 mM sodium phosphate buffer, 250 mM imidazole, pH 8.0). Buffer was exchanged with storage buffer (2.5% (v/v) glycerol, 1 mM EDTA) through a Microcon centrifugal filter device (UFC901096, Millipore).
Fluorescence time-lapse microscopy and data analysis.
N2a cells plated on coverglasses in chambered dishes (Lab-Tek Chambered #1.0 Borosilicate Coverglass System, 155383, Thermo Fisher Scientific) were transfected with HyPerRed. Twenty-four hours after transfection, cells were synchronized with horse serum, and then the medium was replaced with 0.5 mL of phenol red-free DMEM supplemented with 0.4% FBS. A U2OS cell line stably expressing both GFP and HyPerRed probe was seeded at a low density into a culture. Forty-eight hours later, the cell culture was kept for 24 h under constant conditions in the incubation chamber of the microscope and continuously recorded fluorescence signals over the circadian cycle. Cultures were placed in a 37°C chamber equilibrated with humidified air containing 5% CO2 throughout the microscopy experiment. Time-lapse microscopy was performed with an Olympus IX81 (UltraVIEW VOX) microscope with a 10 × objective. Cells were photographed every 30 min (excitation at 561 nm, detection at 620 nm). Differential interference contrast (DIC) images of the same frames were also captured to examine the cell morphology. Images were ultimately processed using ACDsee15 and Adobe Photoshop CS6 software.
Fluorescence signals detection with microplate reader.
The U2OS cell line stably expressing both GFP and HyPerRed probe was seeded at a high density into a culture. Forty-eight hours later, the cell culture was kept for 48 h under constant conditions in an incubation chamber with humidified air containing 5% CO2 post serum shock and the fluorescence signals of GFP and HyPerRed were read with a fluorescence microplate reader (Citation 5, BioTek) (excitation at 575 nm, emission at 620 nm for HyPerRed, excitation at 469 nm, emission at 525 nm for GFP), a method allowed us to detect the fluorescence intensity of GFP and HyPerRed at the same time at 5-min intervals over the circadian cycles without over-stimulating the cultured cells.
Tissue collection and biotinylated IAM labeling and immunoblotting.
Eight- to ten-week-old mice were entrained to a 12-h light-darkness (LD) cycle for at least 10 days and then transferred to constant dark (DD) for 2 days prior to treatment. After dark adaptation, the mice were sacrificed at defined circadian times under dim red light, and the brains and livers of the mice were harvested and stored at −80°C until use for peroxide detection, immunoblotting, quantitative real-time PCR, and RNA sequencing.
Coronal brain sections (1.5 mm) containing the SCN were cut into two 150-mm-thick sections on a freezing microtome to obtain SCN-enriched samples. The SCN was then visualized under a microscope and collected with a syringe needle. SCN samples from three mice were pooled at each time point for RNA or protein extraction.
For the analysis of liver samples, approximately 0.025 g of frozen liver was weighed and homogenized in 1 mL of immunoprecipitation (IP) buffer containing proteinase inhibitors, catalase (200 unit/mL), and BIAM (20 μM)/DCP-Bio1 (2 mM)/BTD (2 mM) using a tissue grinder, and after sonication three times (15 s each separated by 30-s intervals), the mixture was incubated at room temperature on a rotary shaker for 60 min. Soluble proteins were then collected by centrifugation (12,000 × g for 10 min) and applied to Amicon Ultra-15 centrifugal 10 K filter devices to remove free BIAM/DCP-Bio1/BTD. An isotopically labeled and UV-cleavable azido-biotin tag (Az-UV-Biotin) was then conjugated to the BTD-modified peptides using copper catalyzed alkyne azide cycloaddition reaction (CuAAC, click chemistry)22. Samples were then rotated with 60 μL of streptavidin-magnetic beads for 4 h at 4°C (with shaking), followed by bead separation, washing, and boiling. Finally, samples were resolved by SDS/polyacrylamide gel electrophoresis (PAGE) and stained with Coomassie blue dye or immunoblotted with antibodies. Western blot images were captured by Tanon-5200 Chemiluminescent Imaging System (Tanon Science & Technology) or X-RAY Film Automatic Processor (Shanghai Shenbei Group Film Machinery Factory).
Hydrogen peroxide assay.
The peroxide concentrations in cells or mouse livers were detected with an OxiSelect™ Hydrogen Peroxide/Peroxidase Assay Kit which is designed based on the Amplex Red (ADHP)64. Briefly, cells resuspended at 1–2 × 10⁶ cells in 0.4 mL of 1 × Assay Buffer or 0.03 mg of mouse tissues homogenized with a tissue grinder in 0.6 mL of 1 × Assay Buffer were sonicated and centrifuged to remove debris. Lysates were assayed after the addition of 50 μL of each sample and ADHP/HRP Working Solution into an individual well of a microtiter plate. After a 30-min incubation at room temperature in the dark, the plate was read with a fluorescence microplate reader equipped for excitation at 530–570 nm (550 nm) and for emission at 590–600 nm (595 nm). Concentrations of peroxide in samples were calculated by comparing the relative fluorescence units (RFUs) of each sample to the standard curves, which were prepared at the same time.
Lentivirus generation and infection.
The sequence of the siRNA targeting the Clock mRNA was designed on the Sigma-Aldrich website (http://www.sigmaaldrich.com/china-mainland/zh/life-science/functional-genomics-and-rnai/shrna/individual-genes.html). The oligonucleotides containing siRNA sequences (5’-GAGAACATTCAGAGGTTTATA-3’) were inserted into the pLKO.1 construct, which was transfected into 293T cells with psPAX2 and pMD2.G65. The supernatant containing the mature virus was harvested 48–72 h after transfection and used to infect cells.
Subcellular fractionation of cells.
Cytoplasmic and nuclear extracts from mammalian cultured cells were separated and prepared with the NE-PER Nuclear and Cytoplasmic Extraction Reagents Kit. Mitochondria were separated using a previously described method66.
Biotinylated IAM/DCP-Bio1 labeling and immunoblotting for cultured cells.
The methods used for BIAM labeling were similar to previously reported methods21, with minor modifications. N2a cells, U2OS, MAFs, or MEFs were cultured to an appropriate density in 100-mm dishes as described above before transfection with expression vectors, synchronization, or peroxide stimulation. After washing with PBS, cells were rapidly frozen in liquid nitrogen and stored at −70°C. Cells frozen in culture dishes were exposed to 1 mL of IP buffer containing catalase (200 unit/mL), 20 μM BIAM or 2 mM DCP-Bio1 detached from the dish, and transferred to a 1.5-mL microcentrifuge tube. After sonication three times (15 s each separated by 30-s intervals), the mixture was incubated at room temperature on a rotary shaker for 60 min. The reaction mixture was centrifuged at 10,000 × g for 20 min at 4°C and applied to Amicon Ultra-15 centrifugal 10 K filter devices to remove free BIAM/DCP-Bio1. The resulting supernatant was incubated with 60 μL of streptavidin-magnetic beads for 4 h at 4°C (with shaking). The same dose of biotin-blocked beads was used as a negative control to confirm the selectivity of the streptavidin-magnetic beads. Beads were then separated by centrifugation, washed three times with 1 mL of IP buffer, and boiled in 60 μL of 2 × SDS sample loading buffer. The eluted proteins were subjected to SDS-PAGE, and the separated proteins were transferred to a nitrocellulose membrane. BIAM-/DCP-Bio1-labeled proteins were subjected to an immunoblot analysis with antibodies and enhanced chemiluminescence (ECL) reagents. Alternatively, the labeled supernatant was incubated with 5 μg of CLOCK antibody overnight at 4°C, followed by precipitation with Protein G magnetic beads. After three washes with IP Buffer, the separated beads were boiled, and the eluted proteins were examined by immunoblotting with HRP-conjugated streptavidin and ECL reagents.
Electrophoresis mobility shift assay (EMSA).
For EMSA, a 64 nucleotide DNA containing G-Box sequence CCGCGTCGCCCTGCGCTGTCACATAGTGGAAAACGTGACCGCGCG CGCTGAGCCCGCCCCTGCG was synthesized (Sangon) and annealed with a complementary DNA strand by heating at boiling water for 10 min and slowly cooling down to room temperature. The purified WT-CLOCK (0.1 μg) or C195S-CLOCK (0.1 μg) and BMAL1 (0.1 μg) protein were incubated with or without H2O2 (10−5 mM) for 10 min. After that, the protein mixtures were incubated with increasing amounts of 32P-labeled G-box probe ranging from 1.5 to 7.5 nM in binding buffer (5 mM Tris, pH 7.5, 25 mM KCl, 0.5 mM DTT, 5 mM MgCl2, 0.05% NP40, 10 mM EDTA, 2.5% glycerol, 0.05 mg/ml poly(dI·dC)) in a 20 μl-reaction system for 30 min. The samples were then loaded on 5% native polyacrylamide gel which had pre-run in 0.5×TBE for 60 min and run at constant 100V voltage in 0.5×TBE at 4℃. The bound/free ratio was calculated, and the values were plotted against the concentration of bound probe (nM) to obtain Scatchard plots in which the KD = −1/slope.
Non-denaturing polyacrylamide gel electrophoresis (PAGE) assay.
Electrophoresis was performed as described before with some modifications67. Briefly, purified WT-CLOCK (110 nM) and BMAL1 (110 nM) proteins were incubated with different concentrations of H2O2 (0, 10−7, 10−6, or 10−5 mM) for 10 min in PBS. After mixing with non-denaturing loading buffer, the protein mixtures were loaded on a 6% non-denaturing PAGE gel. Using 25 mM Tris-HCl (pH 8.8) and 192 mM glycine as the running buffer, the gel was run at 4°C with a constant current of 40 mA for 1 h. The gel was incubated with 25 mM Tris-HCl (pH 8.3), 192 mM glycine, and 0.1% SDS for 10 min before Western blotting. Blots were incubated with a c-Myc antibody. Afterwards, primary and secondary antibodies were removed from the PVDF membrane with stripping buffer and the PVDF membrane was re-probed with an HA antibody. For affinity constant (KD) determination, the non-denaturing PAGE assay with a constant amount of BMAL1 protein (110 nM) and various concentrations of WT- or C195S-CLOCK proteins (11, 22, 44, 66, 88, or 110 nM) treated with H2O2 (10−6 mM) or not was performed. The amount of free BMAL1 protein was determined by comparing the intensity of the immunoblot of free BMAL1 to the standard curve of free BMAL1 established each time the assay was performed. The amount of the bound BMAL1 (total BMAL1 – free BMAL1) and the amount of bound CLOCK, which equals to the amount of bound BMAL1, then the amount of free CLOCK (total CLOCK – bound CLOCK) were determined. The bound/free ratio of CLOCK was calculated, and the values were plotted against the concentration of bound CLOCK (nM) to obtain Scatchard plots in which the KD = −1/slope.
Protein interaction experiment in vitro.
Myc-tagged BMAL1 protein was incubated with WT-CLOCK or C195S-CLOCK protein in room temperature for 30 min with or without H2O2 (10−5 mM). Then the protein mix was added with 3 μl anti-Myc tag antibody overnight in 4℃. After the protein-antibody mix solution was transfered into 600 μl IP buffer, Dynabeads Protein G was added. After incubated for 4 h at 4°C, beads were washed three times with IP buffer, and boiled in 60 μl of 2 × SDS sample buffer. The eluted proteins were subjected to SDS-PAGE for examining the interaction between CLOCK and BMAL1.
ChIP.
The N2a cells were transfected HA-WT-CLOCK and HA-C195S-CLOCK plasmids for 48 h. ChIP assays were performed as previously described68. The antibody used in ChIP is anti-HA antibody. DNA was detected by quantitative real-time PCR. The primer sequences are provided in Supplementary Table 2.
Reverse transcription and quantitative real-time PCR.
Total mRNA was extracted from cells or mouse tissues using TRIzol (Invitrogen), as previously described59. Primer sequences for specific genes are presented in Supplementary Table 2.
CatTFRE DNA pull-down and mass spectrometry.
CatTFRE was performed as previously described18 with minor modification. Briefly, the catTFRE DNA was prepared by PCR with biotinylated primers. Mouse liver nuclear extracts were prepared with NE-PER Nuclear and Cytoplasmic Extraction Reagents Kit (Thermo). Three milligrams of liver nuclear extracts were incubated with H2O2 (200 μM) or alcohol (control) at room temperature on a rotary shaker for 60 min. Soluble proteins were then collected by centrifugation (20,000 × g for 10 min) and applied to Amicon Ultra-15 centrifugal 10 K filter devices to remove free NEM. Two milligrams of H2O2-treated or control samples were then incubated with pre-immobilized biotinylated catTFRE on Dynabeads (Dynabeads M-280 Streptavidin, Invitrogen). After multistep processing, samples were finally re-dissolved in solvent (0.1% formic acid in water) and subjected to a liquid chromatography-tandem mass spectrometry (LC-MS/MS) analysis performed with a Q-Exactive Plus or FUSION mass spectrometer (Thermo), as previously described69.
Dimedone-mass spectrometry.
One microgram of recombinant CLOCK protein (Creative Biomart) was incubated with 1 mM hydrogen peroxide for 10 min at 37°C, at which point dimedone was added to a final concentration of 5 mM and the samples were incubated for an additional 1 h. After the dimedone treatment, 10 mM DTT was added, and the samples were incubated for an additional 30 min at 37°C. Subsequently, samples were incubated with 20 mM indole-3-acetic acid (IAA) for an additional 30 min, after which trypsin digestion was performed overnight. LC-MS/MS analyses were performed using a Q-Exactive Plus instrument equipped with an Easy-nLC1000 system.
Measurement of site-specific H2O2-sensitivity of CLOCK cysteines.
In vitro H2O2-sensitivity of CLOCK cysteines was measured with a quantitative chemoproteomic approach termed as QTRP (Quantitative Thiol Reactivity Profiling) as previously reported24. In brief, 5 μg of recombinant CLOCK proteins were reduced with 1 mM DTT for 30 min at room temperature. After reaction, excess DTT was removed by Zeba™ Spin Desalting Column (Thermo Scientific) pre-equilibrated with PBS, pH 7.4. Reduced CLOCK proteins were then reacted with or without H2O2 (150 μM) for 10 min at room temperature. The reaction was quenched with catalase. Proteins were labeled with 100 μM thiol-reactive IPM probe for 30 min at room temperature. The reversibly oxidized cysteines were reduced with 1 mM DTT at 75°C for 15 min and alkylated with 5 mM IAM for 30 min in the dark at the room temperature. Proteins were then digested with sequencing grade trypsin (Promega) at a 1:50 (enzyme/ substrate) ratio overnight at 37°C. The resulting tryptic peptides were desalted with C18 tips, evaporated to dryness under vacuum, and reconstituted in a solution containing 30% ACN at pH 6. An isotopically labeled and UV-cleavable azido-biotin tag (Az-UV-Biotin) was then conjugated to the IPM-modified peptides using copper catalyzed alkyne azide cycloaddition reaction (CuAAC, click chemistry). Click chemistry was performed by the addition of 0.8 mM either light Az-UV-biotin for H2O2 treated sample or heavy Az-UV-biotin for untreated sample, 8 mM sodium ascorbate, 1 mM TBTA, and 8 mM CuSO4. Samples were allowed to react at room temperature for 2 h with rotation in the dark. The light and heavy biotinylated peptide samples were then mixed together, cleaned with SCX spin columns to remove excess reagents, and captured with pre-washed streptavidin sepharose beads for 2 h at room temperature. Streptavidin beads then was washed with 50 mM NaAc, 50 mM NaAc containing 2 M NaCl, and water twice, respectively, and resuspended in 25 mM ammonium bicarbonate buffer. The probe-modified peptides were then photoreleased under 365 nm UV light, desalted with C18 tips, evaporated to dryness, and stored at −20°C until LC-MS/MS analysis.
RNA-seq.
Eight- to ten-week-old male p66Shc KO mice and their littermate control mice were entrained to a 12-h LD cycle for at least 10 days and then transferred to complete darkness. After dark adaptation, six mice (three WT and three for p66Shc KO) were sacrificed every 4 h for 24 h under dim red light, and livers were harvested and stored at −80°C until use in the RNA-seq analysis. Total mRNA was extracted from all three mice at each time point, pooled and then divided into two samples. Twenty-four samples were then sent for sequencing. A total amount of 2 μg RNA per sample was used as input material for the RNA sample preparations. Sequencing libraries were generated using NEBNext® Ultra™ RNA Library Prep Kit for Illumina® (#E7530L, NEB, USA) following the manufacturer’s recommendations and index codes were added to attribute sequences to each sample. The clustering of the index-coded samples was performed on a cBot cluster generation system using HiSeq PE Cluster Kit v4-cBot-HS (Illumina) according to the manufacturer’s instructions. After cluster generation, the libraries were sequenced on an Illumina Hiseq 4000 platform and 150 bp paired-end reads were generated. The transcript abundance is expressed as FPKM (fragments per kilobase of exon model per million mapped reads) values (Supplementary Table 3).
Immunohistochemistry.
Mice were sacrificed under the indicated conditions and transcardially perfused with cold saline, followed by perfusion with 4% paraformaldehyde (weight/volume in 10 mM PBS, pH 7.4). Next, brains were harvested and fixed with a 4% phosphate-buffered paraformaldehyde solution overnight. Then, the whole tissue was transferred to 30% sucrose (weight/volume) and incubated overnight at 4°C, after which the fixed brain was embedded in paraffin and cross-sections (5 μm) were prepared. Slides were deparaffinized, and endogenous peroxidase activity was quenched with 3% (volume/volume) hydrogen peroxide in 10% PBS for 30 min. After blocking nonspecific binding sites with 10% goat serum at room temperature for 30 min, slides were incubated with diluted primary antibodies overnight at 4°C, followed by the biotinylated secondary antibody for 30 min at 37°C and with a HRP-labeled streptavidin solution at 37°C. Finally, slides were stained with diaminobenzidine (DAB) and counterstained with hematoxylin, and then evaluated under a microscope.
Reporter assays.
HEK293T cells were seeded into 24-well dishes at a density of 3 × 10⁵ cells per well 24 h before transfection. Cells were transfected with the Clock, Bmal1 or p66Shc overexpression constructs, reporter constructs, and the control Renilla luciferase plasmid at a ratio of 0.5:0.25:0.02 μg per well. Twenty-four hours after transfection, cells were harvested for luciferase assays according to the instructions provided with the Promega Dual-Luciferase Reporter Assay System.
Real-time luciferase assays, drug treatment, and transfection.
U2OS cells harboring Per2:dLuc (PLuc cells) were grown to confluence in 3.5-cm dishes, placed in explant medium (1 × DMEM, 1 × B27 supplement, 4.2 mM NaHCO3, 10 mM HEPES, 25 U/mL penicillin, 25 U/mL streptomycin, 19 mM D-glucose, and 0.1 mM luciferin)70. CGP53353, or vehicle was added to the medium before the dishes were sealed. For siRNA, PLuc cells were plated in standard medium. On the next day, the medium was changed, and two siRNAs targeting human p66Shc (AATGAGTCTCTGTCATCGCTG and AACCTGAGGCTGGCCAACCCG) or negative controls with a similar GC% were complexed with Invitrogen Lipofectamine RNAiMAX according to the manufacturer’s protocol. The medium was replaced 6 to 8 h after transfection. Three days later, the cells were placed in explant medium and sealed. For plasmid transfection, MAFs were plated in 35-mm dishes at a density of 105 cells per well 24 h before transfection. These cells were transfected with X-treme GENE HP DNA Transfection reagent (Roche) according to the manufacturer’s instructions. The cells in each well were transfected with 2 μg of the Per2:Luc reporter plasmids and WT Clock or C195S Clock plasmids. After 72 h, the medium in each well was replaced with 2 mL of explant medium. Data were collected in a LumiCycle luminometer at 37°C for 5–7 days and analyzed using LumiCycle Analysis software (Actimetrics, version 2.44).
Tissue culture.
Mouse livers were isolated and kept in half-frozen Hank’s Balanced Salt Solution (HBSS). Tissues were immediately transferred to tissue culture inserts (EMD Millipore, Billerica, MA, USA) and cultured in 35 mm dishes containing 1 ml of explant medium. Data were collected in a LumiCycle luminometer at 37°C for 5–7 days and analyzed using LumiCycle Analysis software (version 2.44).
Locomotor activity.
The wheel-running activity of 8- to 10-week-old male/female mice that were individually housed in cages was assessed with wireless running-wheel systems (MED Associates, ENV-044) and recorded by a sensor hub (MED Associates, DIG-804) according to the manufacturer’s instructions. Mice were entrained to a 12-h LD cycle (400 lux), and their activities were recorded for at least 10 days, after which the mice were subsequently released into DD and monitored continuously for 20 days. Actograms were generated using the 6-min bins of activity and double-plotted for easier visualization. A representation of the activity profile over 24 h was also generated for ease of examination. The period length was calculated using ActiView software (Mini Mitter, version 1.2) and ClockLab software (Actimetrics, Wilmette, OR, USA, version 6).
Statistics and reproducibility.
For all statistical tests, a P value of < 0.05 was considered statistically significant, and all tests were 2-tailed. Normality were assessed using the Shapiro-Wilk test with the SPSS software package (version 19.0). Normally distributed datasets were analyzed with the unpaired Student’s t test for 2 independent groups and one-way analysis of variance (ANOVA) followed by Bonferroni’s post hoc test for multiple comparisons of ≥ 3 groups. Quantitative results are expressed as the means ± SEM. All statistical analyses were performed using GraphPad Prism (version 6.01) software. For the analysis of rhythmic genes, the nonparametric test JTK_CYCLE was used with R (version 3.5.1), incorporating a window of 20–28 h for the determination of circadian periodicity. Statistical parameters, including statistical analysis, statistical significance, and n values are reported in the Figure legends. Experiments were repeated 3 times independently with similar results obtained, except the experiments in Figures 2f,h, 3f–l, 4c–e, 5e,f, and Extended Data Figures 2e,h, 3a,d,e, b–g,j,k, and 5l where n = 2 independent experiments with similar results.
Code availability
Codes used in this study (for example, JTK_CYCLE for rhythmic analysis) are referenced in the Methods sections above. Any other code used in the study can be obtained from the author on reasonable request.
Data availability
RNA-Seq data that support the findings of this study have been deposited in the Sequence Read Archive (SRA) under the accession code PRJNA449625. Previously published ChIP-Seq data and crystal structure that were reanalyzed here are available in the Gene Expression Omnibus (GEO) under the accession code GSE3986036 and in the Protein Data Bank (PDB) under accession code 4F3L26, respectively. Mass spectrometry data generated for the H2O2-sensitive TF screen and mass spectrometry data about purified CLOCK protein have been deposited to the ProteomeXchange Consortium (http://proteomecentral.proteomexchange.org) via the iProX partner repository with the dataset identifier PXD015265 (link: http://proteomecentral.proteomexchange.org/cgi/GetDataset?ID=PXD015265) and PXD015266 (link: http://proteomecentral.proteomexchange.org/cgi/GetDataset?ID=PXD015266), respectively. Source data for Figures 1b,c,e–g, 2e,g,i,j,k, 3b,c,g,l, 4c–e,g–n, 5a–k, 6a,b,f–k, and 7b,c,e,g, and Extended Data Figures 1b,c, 2f–h, 3b,e, 4h,l, 5a,c,e,g–i,n–p, 6a,b, and 7b,c are provided in Statistics Source Data. Unprocessed blots are shown in Source Data. All other data supporting the findings of this study are available from the corresponding author on reasonable request.
Extended Data
Extended Data Figure 1. Endogenous H2O2 levels oscillate rhythmically in cells.
a, Time-lapse microscopy of circadian HyPerRed fluorescence in three individual cells for one day post-serum shock. N2a cells were transfected with HyPerRed, and images were obtained every 30 min (n = 3 independent experiments with similar results). b, Time-lapse microscopy of circadian HyPerRed fluorescence in three individual cells for one day without a serum treatment. U2OS cells were stably expressing HyPerRed, and images were obtained every 30 min. Note that the three cells have widely different similar results). b, Time-lapse microscopy of circadian HyPerRed fluorescence in three individual cells for one day without a serum treatment. U2OS cells were stably expressing HyPerRed, and images were obtained every 30 min. Note that the three cells have widely different phases (n = 3 independent experiments with similar results). c, Time-lapse microscopy of HyPerRed and GFP fluorescence under the same promoter in the same cell for one day without a serum treatment. U2OS cells were stably expressing HyPerRed and GFP, and images were obtained every 30 min (n = 3 independent experiments with similar results). Source data are provided in Statistics Source Data Extended Data Figure 1.
Extended Data Figure 2. H2O2-sensitive transcription factor (TF) screening identifies that the redox state of CLOCK oscillates rhythmically.
a, Reactive thiols of cysteine residues in proteins are oxidized to S-sulfenic acids (–SOH) by H2O2. Sulfenic acids are unstable and further react with proximal thiol groups to form disulfides, which are reversible oxidative modifications that can be restored to free thiols. b, Changes in the redox state of cysteine residues in proteins are monitored by detecting free thiols with biotin-conjugated iodoacetamide (BIAM) and by detecting cysteine sulfenic acid (R-SOH) with DCP-Bio1 or BTD. c, Representative western blot of S-sulfenylated CLOCK (CLOCK-SOH) from mouse livers labelled by DCP-Bio1. Biotin-blocked streptavidin-magnetic beads were used as a negative control. d, Representative western blot of free reactive thiols in CLOCK labelled by BIAM in vivo and in vitro from N2a cells. Biotin-blocked streptavidin-magnetic beads were used as a negative control. e, Representative western blot of free thiols of CLOCK labelled by BIAM from N2a cells treated with H2O2 (200 μM) for 0, 5, or 20 min and fractionated, followed by immunoprecipitation with CLOCK antibody. f, Relative levels of CCG transcripts in MEFs treated with H2O2 (200 μM) for 12 h. Data are presented as the means ± SEM (n = 3 independent biological samples). P values were calculated using an unpaired two-tailed Student’s t test. g, Relative HyPerRed intensity in U2OS cells stably expressing HyPerRed throughout the circadian cycle (n = 6 independent biological samples). h, Representative western blot of CLOCK-SOH labelled by DCP-Bio1 in U2OS cells over the circadian cycle. n = 3 independent experiments for c,d and n = 2 independent experiments for e,h with similar results. Source data are provided in Statistics Source Data Extended Data Figure 2. Unprocessed blots are shown in Source Data Extended Data Figure 2.
Extended Data Figure 3. Cysteine195 mediates the rhythmic oscillations of CLOCK’s redox state.
a, Expression levels of each mutant CLOCK plasmid in HEK293T cells examined by immunoblotting (n = 2 independent experiments with similar results). b, Relative luciferase activities of Per1:Luc in HEK293T cells transfected with WT or C195S mutant CLOCK plasmids in the absence or presence of BMAL1 (n = 3 independent biological samples). Data are presented as the means ± SEM. c, Schematic of the target site at the Clock locus. In the double-stranded DNA, the sgRNA target is shown in blue and the PAM sequence is shown in red. Red arrowhead indicates the Cas9 cleavage site. In the donor DNA, the replaced nucleotides are shown in red (for point mutation) or blue (for silent mutation). d,e, Representative western blot (d) and quantification (e) of CLOCK-SOH labelled by DCP-Bio1 in MAFs from WT and ClockC195S mice for one circadian cycle (n = 2 independent experiments with similar results). Source data are provided in Statistics Source Data Extended Data Figure 3. Unprocessed blots are shown in Source Data Extended Data Figure 3.
Extended Data Figure 4. Redox regulation of CLOCK at Cysteine195 is essential for normal clock function.
a, Schematic of the recombinant WT/C195S-CLOCK (amino acids 26–384) and BMAL1 (amino acids 62–447) proteins. b, Coomassie Brilliant Blue staining of the recombinant BMAL1 and WT/C195S-CLOCK proteins. c,d, Representative image of a non-denaturing polyacrylamide gel electrophoresis (PAGE) gel showing the heterodimer of recombinant BMAL1 and WT- or C195S-CLOCK treated with or without different concentrations of H2O2. e, Representative image of a non-denaturing PAGE gel of the heterodimer of the recombinant BMAL1 protein and increasing concentrations of the recombinant WT-CLOCK protein. f,g, Representative EMSA of recombinant BMAL1 or the heterodimer of recombinant BMAL1 and WT-CLOCK binding to increasing concentrations of the G-box probe (f) and the heterodimer binding to G-box probe treated with or without H2O2 (10−6 mM) (g). h, Relative mRNA levels of Bmal1 in WT and ClockC195S MAFs over the circadian cycles (n = 3 independent biological samples per time point). i, Schematic of 20-nt sgRNA target sequence of Clock (blue) and PAM (red). Red arrowhead indicates Cas9 cleavage site. j, Sequencing of PCR product from a Clock KO mouse. Black arrows indicate the location of mutations introduced by CRISPR/Cas9. k, Representative immunoblot of CLOCK in WT and Clock KO MAFs. l, ChIP analysis of WT- and C195S-CLOCK proteins binding to the Dbp promoter (−1360 to −1297) (−508 to −414) in N2a cells. The Rpl19 promoter served as the negative control (n = 3 independent biological samples). P values were calculated using one way ANOVA with a Bonferroni’s post hoc test. n = 2 independent experiments for b-g,j,k with similar results. Data are presented as the means ± SEM. Source data are provided in Statistics Source Data Extended Data Figure 4. Unprocessed blots are shown in Source Data Extended Data Figure 4.
Extended Data Figure 5. P66Shc is indispensable for robust oscillations of H2O2 levels and normal CLOCK function.
a, Relative H2O2 concentration in N2a cells transfected with a gradient mass of p66Shc (n = 3 independent biological samples). b, Representative immunoblot of p66Shc phosphorylation at Ser36 in MEFs treated with LY333531 (1 μM). c-i, Relative mRNA levels or representative immunoblot of p66Shc in MEFs (c,d), in livers (e,f), in N2a cells overexpressing CLOCK and BMAL1 (g), or in WT MAFs and Cry DKO MAFs (h,i) (n = 3 independent biological samples per group for c,e,g,h). j,k, Analysis of E-box elements on the promoter of mouse p66Shc (5 kb) (j) and its evolutionary conservation among multiple species (k). l, Representative immunoblot of reduced HA-CLOCK after transient transfection of p66Shc. m, Representative immunoblot of p66Shc in p66Shc KO MEFs rescued by p66Shc overexpression. n, Relative mRNA levels of CCGs in N2a cells overexpressing the WT or S36A mutant of p66Shc (n = 4 independent biological samples, except the Nampt in p66Shc group where n = 5, and the Per2 in p66Shc group and the Wee1 in p66S36A group where n = 3). o, Relative levels of Nampt mRNA in N2a cells overexpressing WT or S36A mutant of p66Shc and treated with H2O2 (200 μM) or catalase (1000 U/ml) (n = 5 independent biological samples). p, Relative amplitude of mPER2::LUC bioluminescence rhythms from WT and p66Shc KO liver explants (n = 9 independent biological samples). P values are shown for the comparisons to the control (a,g), to the first time point for p66Shc (c,e), to Cry DKO (h), to p66Shc (n), to p66S36A (o), and to WT group (p). P values were calculated using an unpaired two-tailed Student’s t test (n,p) and one-way ANOVA with a Bonferroni’s post hoc test (a,c,e,g,h,o). Data are presented as the means ± SEM. n = 3 independent experiments for b,d,f,i,m and n = 2 independent experiments for l with similar results. Source data are provided in Statistics Source Data Extended Data Figure 5. Unprocessed blots are shown in Source Data Extended Data Figure 5.
Extended Data Figure 6. P66Shc KO reprograms hepatic transcriptome oscillations.
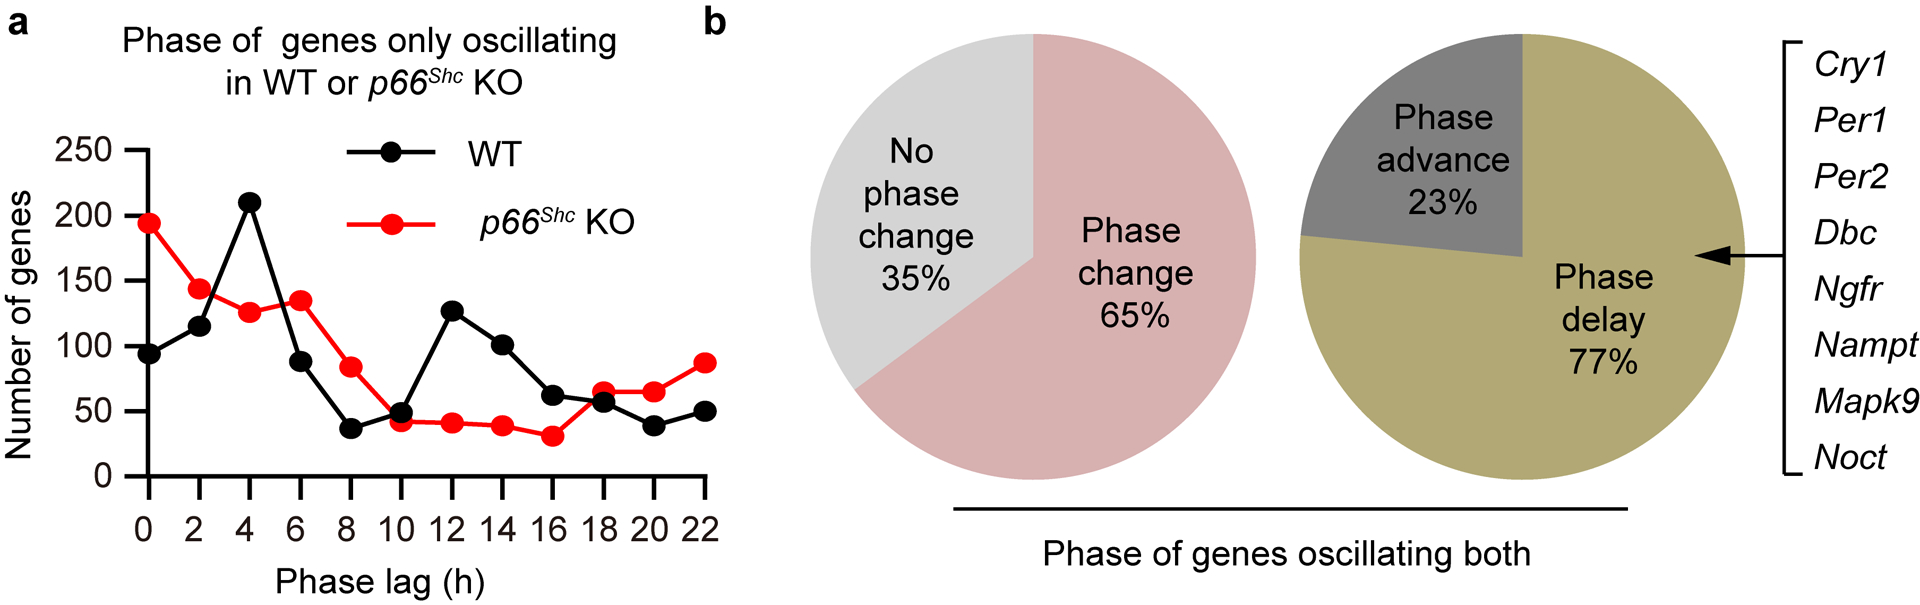
a, Phase analysis of transcripts that oscillate only in the WT or p66Shc KO group. b, Phase analysis of genes that retain oscillations in both WT and p66Shc KO mice. RNA-seq analysis of the whole transcriptome was performed using total RNA obtained from three mouse livers each time point, which were pooled and then divided into two samples, at 4-h intervals for one circadian cycle under DD conditions. All analyses are from n = 1 RNA-sequencing experiment. Source data are provided in Statistics Source Data Extended Data Figure 6.
Extended Data Figure 7. P66Shc modulates circadian behaviours in mice.
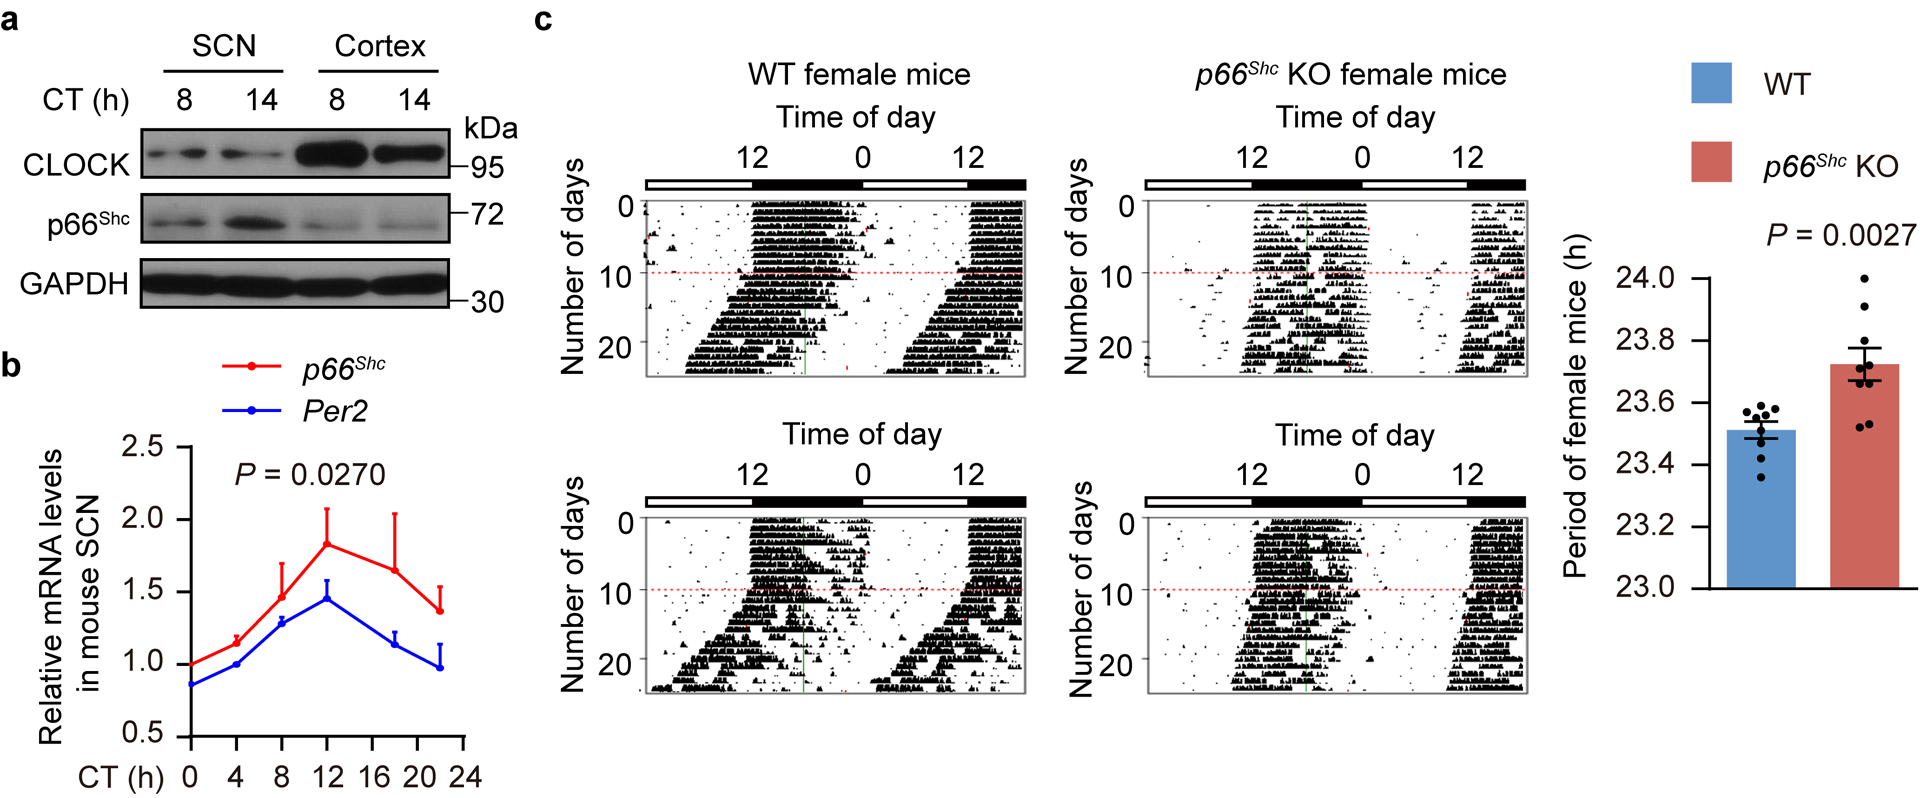
a, Representative western blot of p66Shc in mouse SCN and cortex at CT8 and CT14 under DD conditions. Three mouse SCNs or cortices were pooled per time point (n = 3 independent experiments with similar results). b, Relative levels of p66Shc mRNA in the SCN for one circadian cycle under DD conditions (n = 3 independent biological samples per time point). P values are shown for the comparisons to the first time point for p66Shc. Data are presented as the means ± SEM. c, Representative double-plot actograms of wheel-running activities and period lengths from two WT (left) and two p66Shc KO female mice (right) under DD conditions after LD entrainment. Red lines indicate the day on which DD conditions were initiated. P values are shown for the comparisons of p66Shc KO with WT. Values are presented as the means ± SEM (n = 9 mice). P values were calculated using one-way ANOVA with a Bonferroni’s post hoc test (b) and an unpaired two-tailed Student’s t test (c). Source data are provided in Statistics Source Data Extended Data Figure 7. Unprocessed blots are shown in Source Data Extended Data Figure 7.
Supplementary Material
Acknowledgements
We thank Xue-Min Xie and Mi Lai (State Key Laboratory of Proteomics) for technical assistance and members of the De-Pei Liu laboratory for helpful discussions about this project. This work was supported by grants from the Chinese Academy of Medical Sciences Innovation Fund for Medical Sciences (CIFMS2017-I2M-1-008, 2019-RC-HL-006, 2016-I2M-1-015, 2016-I2M-1-011), the National Natural Science Foundation of China (nos. 91849207, 81701387, 91639304, 31471126 and 31571193), the Medical Epigenetics Research Center, Chinese Academy of Medical Sciences (2017PT31035, 2018PT31015), and Special Financial Grant from the China Postdoctoral Science Foundation (2017T100051). Dr. H.Z. Chen is also supported by the Youth Top-notch Talent Support Program and the Youth Yangtze River Scholar Program in China.
Footnotes
Competing interests
The authors declare no competing interests.
References
- 1.Bass J & Takahashi JS Circadian integration of metabolism and energetics. Science 330, 1349–1354 (2010). [DOI] [PMC free article] [PubMed] [Google Scholar]
- 2.Dodd AN et al. Plant circadian clocks increase photosynthesis, growth, survival, and competitive advantage. Science 309, 630–633 (2005). [DOI] [PubMed] [Google Scholar]
- 3.Takahashi JS Transcriptional architecture of the mammalian circadian clock. Nat. Rev. Genet 18, 164–179 (2017). [DOI] [PMC free article] [PubMed] [Google Scholar]
- 4.Reddy AB & Rey G Metabolic and Nontranscriptional Circadian Clocks: Eukaryotes. Annu. Rev. Biochem 83, 165–189 (2014). [DOI] [PMC free article] [PubMed] [Google Scholar]
- 5.O’Neill JS & Reddy AB Circadian clocks in human red blood cells. Nature 469, 498–503 (2011). [DOI] [PMC free article] [PubMed] [Google Scholar]
- 6.Bass J & Takahashi JS Circadian rhythms: Redox redux. Nature 469, 476–478 (2011). [DOI] [PMC free article] [PubMed] [Google Scholar]
- 7.Sies H, Berndt C & Jones DP Oxidative Stress. Annu. Rev. Biochem 86, 715–748 (2017). [DOI] [PubMed] [Google Scholar]
- 8.Winterbourn CC Reconciling the chemistry and biology of reactive oxygen species. Nat. Chem. Biol 4, 278–286 (2008). [DOI] [PubMed] [Google Scholar]
- 9.Giorgio M, Trinei M, Migliaccio E & Pelicci PG Hydrogen peroxide: a metabolic by-product or a common mediator of ageing signals? Nat. Rev. Mol. Cell Biol 8, 722–728 (2007). [DOI] [PubMed] [Google Scholar]
- 10.D’Autreaux B & Toledano MB ROS as signalling molecules: mechanisms that generate specificity in ROS homeostasis. Nat. Rev. Mol. Cell Biol 8, 813–824 (2007). [DOI] [PubMed] [Google Scholar]
- 11.Holmstrom KM & Finkel T Cellular mechanisms and physiological consequences of redox-dependent signalling. Nat. Rev. Mol. Cell Biol 15, 411–421 (2014). [DOI] [PubMed] [Google Scholar]
- 12.Yu T et al. In vitro and in vivo phase changes of the mouse circadian clock by oxidative stress. Journal of Circadian Rhythms 14 (2016). [Google Scholar]
- 13.Putker M et al. Mammalian circadian period, but not phase and amplitude, is robust against redox and metabolic perturbations. Antioxid Redox Signal (2017). [DOI] [PMC free article] [PubMed] [Google Scholar]
- 14.Wible RS et al. NRF2 regulates core and stabilizing circadian clock loops, coupling redox and timekeeping in Mus musculus. Elife 7 (2018). [DOI] [PMC free article] [PubMed] [Google Scholar]
- 15.Ermakova YG et al. Red fluorescent genetically encoded indicator for intracellular hydrogen peroxide. Nat. Commun 5, 5222 (2014). [DOI] [PMC free article] [PubMed] [Google Scholar]
- 16.Chang HC & Guarente L SIRT1 mediates central circadian control in the SCN by a mechanism that decays with aging. Cell 153, 1448–1460 (2013). [DOI] [PMC free article] [PubMed] [Google Scholar]
- 17.Zhou M, Diwu Z, Panchuk-Voloshina N & Haugland RP A stable nonfluorescent derivative of resorufin for the fluorometric determination of trace hydrogen peroxide: applications in detecting the activity of phagocyte NADPH oxidase and other oxidases. Anal. Biochem 253, 162–168 (1997). [DOI] [PubMed] [Google Scholar]
- 18.Ding C et al. Proteome-wide profiling of activated transcription factors with a concatenated tandem array of transcription factor response elements. Proc. Natl. Acad. Sci. U S A 110, 6771–6776 (2013). [DOI] [PMC free article] [PubMed] [Google Scholar]
- 19.Paulsen CE & Carroll KS Cysteine-mediated redox signaling: chemistry, biology, and tools for discovery. Chem. Rev 113, 4633–4679 (2013). [DOI] [PMC free article] [PubMed] [Google Scholar]
- 20.Gupta V & Carroll KS Sulfenic acid chemistry, detection and cellular lifetime. Biochim. Biophys. Acta 1840, 847–875 (2014). [DOI] [PMC free article] [PubMed] [Google Scholar]
- 21.Kim JR, Yoon HW, Kwon KS, Lee SR & Rhee SG Identification of proteins containing cysteine residues that are sensitive to oxidation by hydrogen peroxide at neutral pH. Anal. Biochem 283, 214–221 (2000). [DOI] [PubMed] [Google Scholar]
- 22.Gupta V, Yang J, Liebler DC & Carroll KS Diverse Redoxome Reactivity Profiles of Carbon Nucleophiles. J. Am. Chem. Soc 139, 5588–5595 (2017). [DOI] [PMC free article] [PubMed] [Google Scholar]
- 23.Klomsiri C et al. Use of dimedone-based chemical probes for sulfenic acid detection evaluation of conditions affecting probe incorporation into redox-sensitive proteins. Methods Enzymol. 473, 77–94 (2010). [DOI] [PMC free article] [PubMed] [Google Scholar]
- 24.Fu L et al. Systematic and Quantitative Assessment of Hydrogen Peroxide Reactivity With Cysteines Across Human Proteomes. Mol. Cell Proteomics 16, 1815–1828 (2017). [DOI] [PMC free article] [PubMed] [Google Scholar]
- 25.Martinez-Acedo P, Gupta V & Carroll KS Proteomic analysis of peptides tagged with dimedone and related probes. J. Mass Spectrom 49, 257–265 (2014). [DOI] [PMC free article] [PubMed] [Google Scholar]
- 26.Huang N et al. Crystal structure of the heterodimeric CLOCK:BMAL1 transcriptional activator complex. Science 337, 189–194 (2012). [DOI] [PMC free article] [PubMed] [Google Scholar]
- 27.Stone SR, Hughes MJ & Jost J-P in A laboratory guide to in vitro studies of protein-DNA interactions 163–194 (Springer, 1991). [Google Scholar]
- 28.Asher G et al. Poly(ADP-ribose) polymerase 1 participates in the phase entrainment of circadian clocks to feeding. Cell 142, 943–953 (2010). [DOI] [PubMed] [Google Scholar]
- 29.Landgraf D, Wang LL, Diemer T & Welsh DK NPAS2 Compensates for Loss of CLOCK in Peripheral Circadian Oscillators. PLoS. Genet 12, e1005882 (2016). [DOI] [PMC free article] [PubMed] [Google Scholar]
- 30.Esnault C et al. Rho-actin signaling to the MRTF coactivators dominates the immediate transcriptional response to serum in fibroblasts. Genes Dev. 28, 943–958 (2014). [DOI] [PMC free article] [PubMed] [Google Scholar]
- 31.Migliaccio E et al. The p66shc adaptor protein controls oxidative stress response and life span in mammals. Nature 402, 309–313 (1999). [DOI] [PubMed] [Google Scholar]
- 32.Giorgio M et al. Electron transfer between cytochrome c and p66Shc generates reactive oxygen species that trigger mitochondrial apoptosis. Cell 122, 221–233 (2005). [DOI] [PubMed] [Google Scholar]
- 33.Pinton P et al. Protein kinase C beta and prolyl isomerase 1 regulate mitochondrial effects of the life-span determinant p66Shc. Science 315, 659–663 (2007). [DOI] [PubMed] [Google Scholar]
- 34.Chen Z et al. Selective inhibition of protein kinase C beta2 attenuates the adaptor P66 Shc-mediated intestinal ischemia-reperfusion injury. Cell Death Dis. 5, e1164 (2014). [DOI] [PMC free article] [PubMed] [Google Scholar]
- 35.Hunt T & Sassone-Corsi P Riding tandem: circadian clocks and the cell cycle. Cell 129, 461–464 (2007). [DOI] [PubMed] [Google Scholar]
- 36.Koike N et al. Transcriptional architecture and chromatin landscape of the core circadian clock in mammals. Science 338, 349–354 (2012). [DOI] [PMC free article] [PubMed] [Google Scholar]
- 37.Zhou P, Ross RA, Pywell CM, Liangpunsakul S & Duffield GE Disturbances in the murine hepatic circadian clock in alcohol-induced hepatic steatosis. Sci. Rep 4, 3725 (2014). [DOI] [PMC free article] [PubMed] [Google Scholar]
- 38.Nakahata Y et al. The NAD+-dependent deacetylase SIRT1 modulates CLOCK-mediated chromatin remodeling and circadian control. Cell 134, 329–340 (2008). [DOI] [PMC free article] [PubMed] [Google Scholar]
- 39.Sato S et al. Circadian Reprogramming in the Liver Identifies Metabolic Pathways of Aging. Cell 170, 664–677 e611 (2017). [DOI] [PMC free article] [PubMed] [Google Scholar]
- 40.Conti L et al. Expression and activation of SH2/PTB-containing ShcA adaptor protein reflects the pattern of neurogenesis in the mammalian brain. Proc. Natl. Acad. Sci. U S A 94, 8185–8190 (1997). [DOI] [PMC free article] [PubMed] [Google Scholar]
- 41.Schibler U & Sassone-Corsi P A web of circadian pacemakers. Cell 111, 919–922 (2002). [DOI] [PubMed] [Google Scholar]
- 42.Edgar RS et al. Peroxiredoxins are conserved markers of circadian rhythms. Nature 485, 459–464 (2012). [DOI] [PMC free article] [PubMed] [Google Scholar]
- 43.Eckel-Mahan KL et al. Reprogramming of the circadian clock by nutritional challenge. Cell 155, 1464–1478 (2013). [DOI] [PMC free article] [PubMed] [Google Scholar]
- 44.Solanas G et al. Aged Stem Cells Reprogram Their Daily Rhythmic Functions to Adapt to Stress. Cell 170, 678–692 e620 (2017). [DOI] [PubMed] [Google Scholar]
- 45.Masri S et al. Partitioning circadian transcription by SIRT6 leads to segregated control of cellular metabolism. Cell 158, 659–672 (2014). [DOI] [PMC free article] [PubMed] [Google Scholar]
- 46.Thaiss CA et al. Microbiota Diurnal Rhythmicity Programs Host Transcriptome Oscillations. Cell 167, 1495–1510 e1412 (2016). [DOI] [PubMed] [Google Scholar]
- 47.Masri S et al. Lung Adenocarcinoma Distally Rewires Hepatic Circadian Homeostasis. Cell 165, 896–909 (2016). [DOI] [PMC free article] [PubMed] [Google Scholar]
- 48.Zhao X et al. Circadian Amplitude Regulation via FBXW7-Targeted REV-ERBalpha Degradation. Cell 165, 1644–1657 (2016). [DOI] [PMC free article] [PubMed] [Google Scholar]
- 49.Solt LA et al. Regulation of circadian behaviour and metabolism by synthetic REV-ERB agonists. Nature 485, 62–68 (2012). [DOI] [PMC free article] [PubMed] [Google Scholar]
- 50.Cho H et al. Regulation of circadian behaviour and metabolism by REV-ERB-alpha and REV-ERB-beta. Nature 485, 123–127 (2012). [DOI] [PMC free article] [PubMed] [Google Scholar]
- 51.Ranieri SC et al. Mammalian life-span determinant p66shcA mediates obesity-induced insulin resistance. Proc. Natl. Acad. Sci. U S A 107, 13420–13425 (2010). [DOI] [PMC free article] [PubMed] [Google Scholar]
- 52.Ciciliot S et al. p66Shc deletion or deficiency protects from obesity but not metabolic dysfunction in mice and humans. Diabetologia 58, 2352–2360 (2015). [DOI] [PubMed] [Google Scholar]
- 53.Sone K, Mori M & Mori N Selective upregulation of p66-Shc gene expression in the liver and brain of aged rats. Arch. Gerontol. Geriatr 55, 744–748 (2012). [DOI] [PubMed] [Google Scholar]
- 54.Jones DP & Sies H The Redox Code. Antioxid Redox Signal 23, 734–746 (2015). [DOI] [PMC free article] [PubMed] [Google Scholar]
- 55.Bass J & Lazar MA Circadian time signatures of fitness and disease. Science 354, 994–999 (2016). [DOI] [PubMed] [Google Scholar]
- 56.Wu Y et al. Reciprocal Regulation between the Circadian Clock and Hypoxia Signaling at the Genome Level in Mammals. Cell Metab 25, 73–85 (2017). [DOI] [PubMed] [Google Scholar]
- 57.Mu WL et al. Sox2 deacetylation by Sirt1 is involved in mouse somatic reprogramming. Stem Cells 33, 2135–2147 (2015). [DOI] [PubMed] [Google Scholar]
- 58.Hu Y et al. ERK phosphorylates p66shcA on Ser36 and subsequently regulates p27kip1 expression via the Akt-FOXO3a pathway: implication of p27kip1 in cell response to oxidative stress. Mol. Biol. Cell 16, 3705–3718 (2005). [DOI] [PMC free article] [PubMed] [Google Scholar]
- 59.Zhou S et al. Repression of P66Shc expression by SIRT1 contributes to the prevention of hyperglycemia-induced endothelial dysfunction. Circ. Res 109, 639–648 (2011). [DOI] [PubMed] [Google Scholar]
- 60.Kondratov RV et al. BMAL1-dependent circadian oscillation of nuclear CLOCK: posttranslational events induced by dimerization of transcriptional activators of the mammalian clock system. Genes Dev. 17, 1921–1932 (2003). [DOI] [PMC free article] [PubMed] [Google Scholar]
- 61.Hida A et al. The human and mouse Period1 genes: five well-conserved E-boxes additively contribute to the enhancement of mPer1 transcription. Genomics 65, 224–233 (2000). [DOI] [PubMed] [Google Scholar]
- 62.Shen B et al. Efficient genome modification by CRISPR-Cas9 nickase with minimal off-target effects. Nat. Methods 11, 399–402 (2014). [DOI] [PubMed] [Google Scholar]
- 63.Huang LZ et al. Whole-exome sequencing implicates UBE3D in age-related macular degeneration in East Asian populations. Nat. Commun 6, 6687 (2015). [DOI] [PubMed] [Google Scholar]
- 64.Rhee SG, Chang TS, Jeong W & Kang D Methods for detection and measurement of hydrogen peroxide inside and outside of cells. Mol. Cells 29, 539–549 (2010). [DOI] [PubMed] [Google Scholar]
- 65.Moffat J et al. A lentiviral RNAi library for human and mouse genes applied to an arrayed viral high-content screen. Cell 124, 1283–1298 (2006). [DOI] [PubMed] [Google Scholar]
- 66.Frezza C, Cipolat S & Scorrano L Organelle isolation: functional mitochondria from mouse liver, muscle and cultured fibroblasts. Nat. Protoc 2, 287–295 (2007). [DOI] [PubMed] [Google Scholar]
- 67.Walker JM Nondenaturing polyacrylamide gel electrophoresis of proteins. Methods Mol. Biol 32, 17–22 (1994). [DOI] [PubMed] [Google Scholar]
- 68.Chen HZ et al. Age-Associated Sirtuin 1 Reduction in Vascular Smooth Muscle Links Vascular Senescence and Inflammation to Abdominal Aortic Aneurysm. Circ. Res 119, 1076–1088 (2016). [DOI] [PMC free article] [PubMed] [Google Scholar]
- 69.Lai M et al. Multidimensional Proteomics Reveals a Role of UHRF2 in the Regulation of Epithelial-Mesenchymal Transition (EMT). Mol. Cell Proteomics 15, 2263–2278 (2016). [DOI] [PMC free article] [PubMed] [Google Scholar]
- 70.Savelyev SA, Larsson KC, Johansson AS & Lundkvist GB Slice preparation, organotypic tissue culturing and luciferase recording of clock gene activity in the suprachiasmatic nucleus. J. Vis. Exp (2011). [DOI] [PMC free article] [PubMed] [Google Scholar]
Associated Data
This section collects any data citations, data availability statements, or supplementary materials included in this article.
Supplementary Materials
Data Availability Statement
RNA-Seq data that support the findings of this study have been deposited in the Sequence Read Archive (SRA) under the accession code PRJNA449625. Previously published ChIP-Seq data and crystal structure that were reanalyzed here are available in the Gene Expression Omnibus (GEO) under the accession code GSE3986036 and in the Protein Data Bank (PDB) under accession code 4F3L26, respectively. Mass spectrometry data generated for the H2O2-sensitive TF screen and mass spectrometry data about purified CLOCK protein have been deposited to the ProteomeXchange Consortium (http://proteomecentral.proteomexchange.org) via the iProX partner repository with the dataset identifier PXD015265 (link: http://proteomecentral.proteomexchange.org/cgi/GetDataset?ID=PXD015265) and PXD015266 (link: http://proteomecentral.proteomexchange.org/cgi/GetDataset?ID=PXD015266), respectively. Source data for Figures 1b,c,e–g, 2e,g,i,j,k, 3b,c,g,l, 4c–e,g–n, 5a–k, 6a,b,f–k, and 7b,c,e,g, and Extended Data Figures 1b,c, 2f–h, 3b,e, 4h,l, 5a,c,e,g–i,n–p, 6a,b, and 7b,c are provided in Statistics Source Data. Unprocessed blots are shown in Source Data. All other data supporting the findings of this study are available from the corresponding author on reasonable request.