

Summary
The taste of sugar is one of the most basic sensory percepts for humans and other animals. Remarkably, animals can develop a strong preference for sugar even if lacking sweet taste receptors, pointing to a mechanism independent of taste1–3. Here we examined the neural basis for sugar preference and demonstrate that a population of neurons in the vagal ganglia and brainstem are activated via the gut-brain axis to create preference for sugar. These neurons are stimulated in response to sugar but not artificial sweeteners, and are activated by direct delivery of sugar to the gut. Using functional imaging we monitored activity of the gut-brain axis, and identified the vagal neurons activated by intestinal delivery of glucose. Next, we engineered animals where synaptic activity in this gut-to-brain circuit was genetically silenced, and prevented the development of behavioural preference for sugar. Moreover, we show that co-opting this circuit by chemogenetic activation can create preferences to un-preferred stimuli. Together, these findings reveal a gut-to-brain post-ingestive sugar-sensing pathway critical for the development of sugar preference. In addition, they explain the neural basis for differences in the behavioural effects of sweeteners versus sugar, and uncover an essential circuit underlying sugar’s highly appetitive effects.
Sugar is a fundamental source of energy for all animals, and correspondingly, most species have evolved dedicated brain circuits to seek, recognize, and motivate its consumption4. In humans, the recruitment of these circuits for reward and pleasure, rather than nutritional needs, is thought to be an important contributor to the overconsumption of sugar, and the concomitant increase in obesity rates. In the 1800’s the average American consumed less than 10 pounds of sugar per year5, today, following the broad availability of refined sugar in consumer products, the average consumption is over 100 pounds per year6.
Sweet compounds are detected by specific taste receptor cells (TRCs) on the tongue and palate epithelium7,8. Activation of sweet TRCs sends hardwired signals to the brain to elicit recognition of sweet-tasting compounds9,10. We and others have studied the circuits linking activation of sweet taste receptors on the tongue to sweet-evoked attraction8,11,12. Surprisingly, even in the absence of a functional sweet-taste pathway animals can still acquire a preference for sugar1,2,7. Furthermore, although artificial sweeteners activate the same sweet taste receptor as sugars, and they may do so with vastly higher affinities7, they fail to substitute for sugar in generating a behavioural preference13 (see below).
Together, these results suggested the existence of a sugar-specific, rather than “sweet” specific pathway, that operates independently of the sense of taste to create preference for sugar and motivate consumption2,14. Here, we dissect the neural basis for sugar preference.
Sweet versus sugar preference
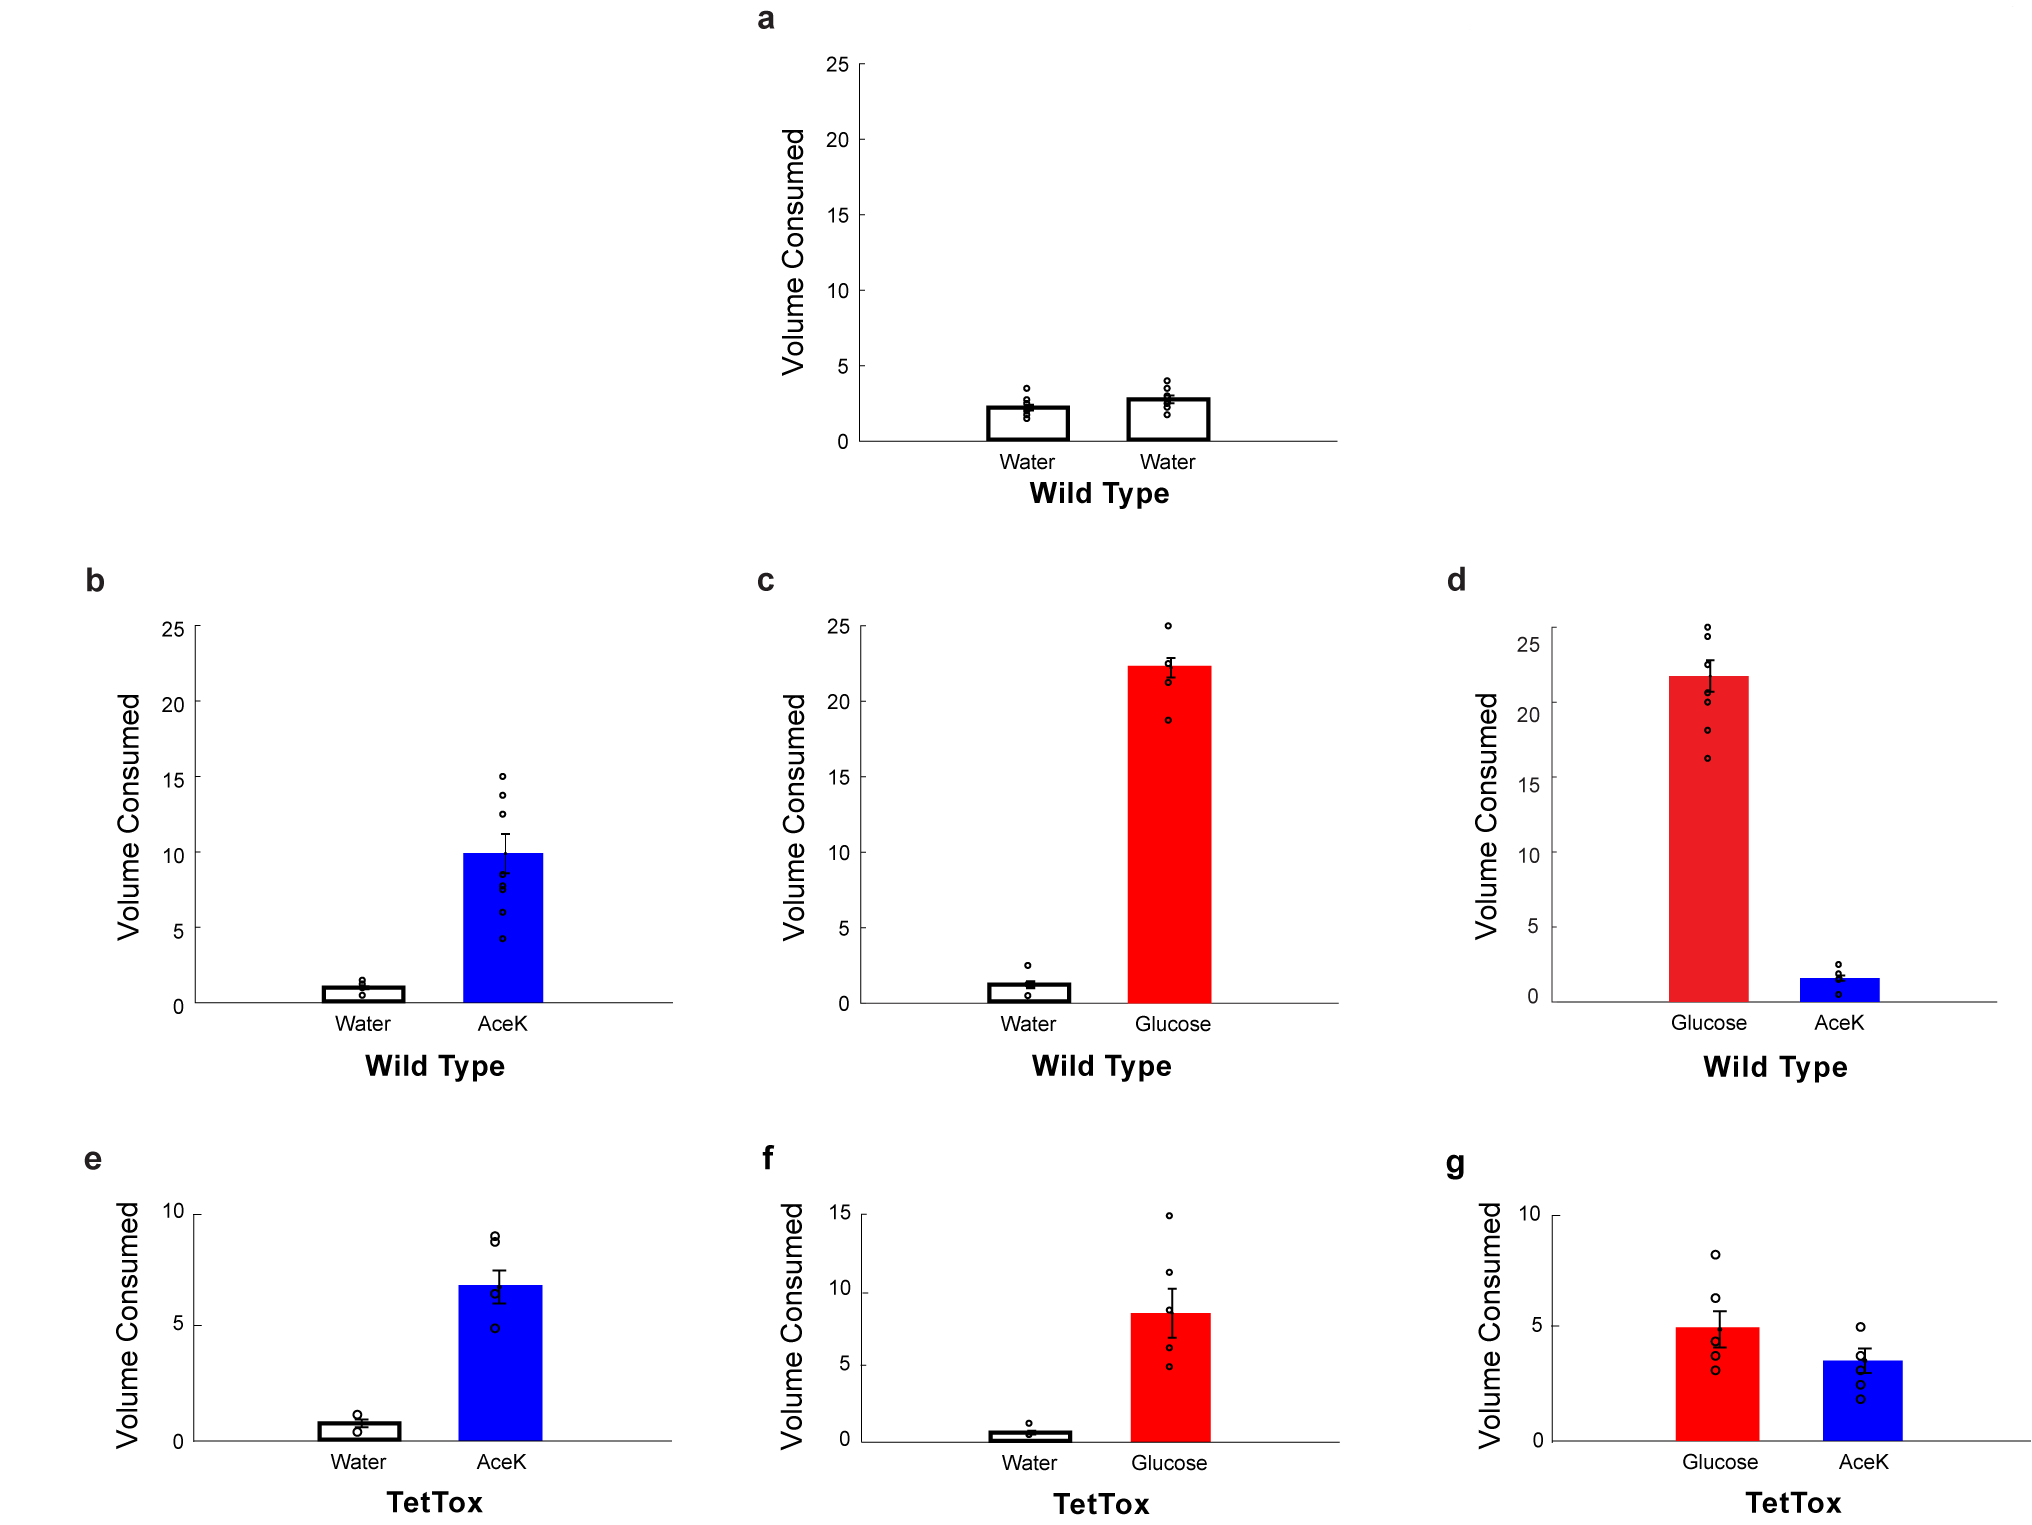
When non-thirsty, wild-type mice are given a choice between water and sugar they drink almost exclusively from the sugar solution7. If instead, they are allowed to choose between an artificial sweetener (e.g. Acesulfame K) and sugar, using concentrations where both are equally attractive, naive animals initially drink from both bottles at a similar rate (Fig. 1a). However, within 24 h of exposure to both choices, the animals’ preference is dramatically altered, such that by 48 h they drink almost exclusively from the bottle containing sugar (Fig. 1a–b, compare 15 h to 48 h). This behavioural switch also happens in knockouts lacking sweet taste (TRPM5 KO15,16, T1R2/T1R3 double KO7, Fig 1c). Similar observations have been made by several groups, primarily using flavour conditioning assays1,2. Thus, although taste knockout animals cannot even taste sugar or the sweetener, they still learn to recognize and choose the sugar, most likely as a result of strong positive post-ingestive effects17.
Figure 1: Sugar activates the gut-brain axis.
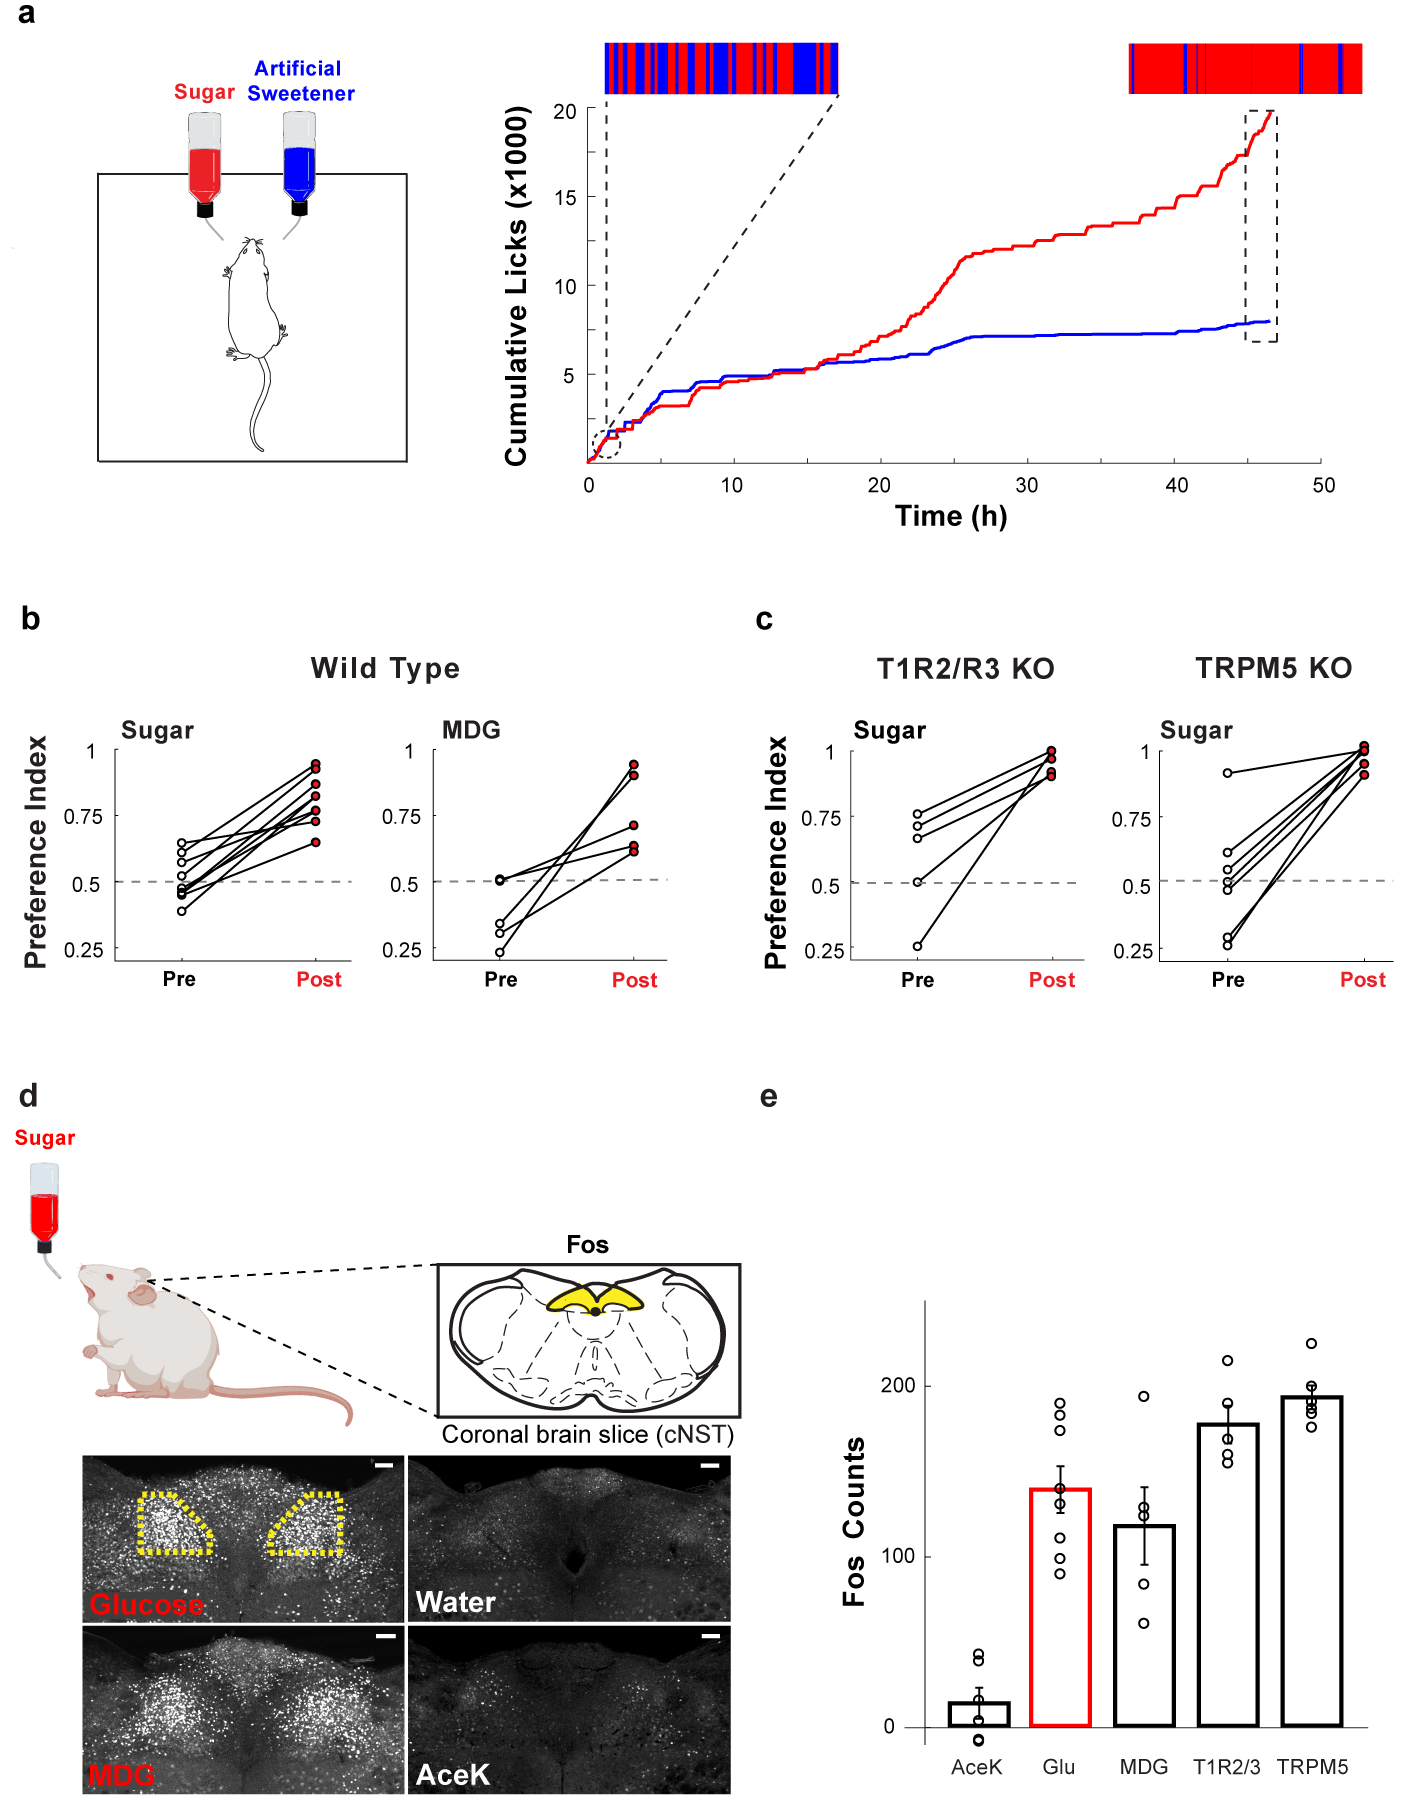
a, Mice are given a choice between 600 mM glucose or 30 mM AceK (sweetener). The animal’s preference is tracked by electronic lick counters in each port. The upper insets show lick-rasters for glucose (red) versus AceK (blue) from the first and last 2000 licks of the behavioural test. Note that by 48 h the animals drink almost exclusively from the sugar bottle. b, Preference plots for sugar versus AceK (n = 9 mice, two-tailed paired t-test, p = 2.39 × 10⁻⁶), and MDG versus AceK (n = 5 mice, two-tailed paired t-test, p = 0.0024; Extended Data Fig. 1). Note that animals may begin the behavioural preference test exhibiting no preference for sugar (preference index ~0.5), some preference for sugar (preference index >0.5), or with an initial preference for the sweetener (preference index <0.5). However, in all cases they switched (or dramatically increased) their preference to sugar. c, Mice lacking the sweet taste receptor (T1R2/T1R3−/−)7, n = 5 mice, two-tailed paired t-test, p = 0.0038, and mice lacking TRPM5 (TRPM5−/−)15, n = 7 mice, two-tailed paired t-test, p = 0.0001, switched their preference to sugar even though they cannot taste it. d, Schematic of sugar stimulation for Fos induction. Strong Fos labelling is observed in neurons of the cNST (highlighted yellow). Scale bars, 100 μm. Similar results were obtained in multiple animals for each experiment (Extended Data Fig. 2). e, Quantitation of Fos-positive neurons. The equivalent area of the cNST (Bregma −7.5 mm) was processed and counted for the different stimuli.
The signal present in water alone was subtracted prior to plotting; ANOVA with Tukey’s HSD post hoc test against AceK (n = 6 mice): p = 4.68 × 10⁻⁵ (glucose, n = 8 mice), p = 0.001 (MDG, n = 5 mice). Values are mean ± s.e.m.
Notably, the preference for sugar does not rely on the sugar’s caloric content18. For example, if sugar is substituted for the non-metabolizable glucose analogue (methyl-α-D-glucopyranoside, MDG)19 animals still develop a strong preference for MDG, just like they do to glucose (Fig. 1b; Extended Data Fig. 1). Thus, the signalling system is recognizing the sugar molecule itself rather than its calories or metabolic products.
Brain neurons activated by sugar
For an animal to develop sugar versus sweetener preference, it must recognize and distinguish between two innately attractive stimuli. We reasoned that if we could identify a population of neurons that respond selectively to the consumption of sugar, it may provide an entry to uncover the neural control of sugar preference, and the basis of sugar craving.
We exposed separate cohorts of mice to either sugar, sweetener, or water, and scanned their brains for induction of Fos as a proxy for neural activity20 (see Methods). Our results showed prominent bilateral labelling in the caudal Nucleus of the Solitary Tract (cNST; Fig. 1d), an area known to function as a nexus of interoceptive signals conveying information from the body into the brain21. Importantly, the cNST was not significantly labelled in response to sweetener or water controls (Fig. 1d, Extended Data Fig. 2a). Furthermore, if these cNST neurons are involved in sugar-preference behaviour, they must also be activated by MDG (Fig. 1d–e), and their activation by sugar should be independent of the taste system (Extended Data Fig. 3a).
How do sugar signals reach the cNST? The finding that preference for sugar does not require the taste system, strongly suggested post-ingestive recognition. Therefore, we tested whether intragastric application of sugar was sufficient to activate the cNST. As predicted, direct gut infusion of sugar (but not sweetener) is sufficient to activate the cNST as robustly as oral ingestion (Extended Data Fig. 3b). These results also substantiate previous behavioural studies showing that intragastric infusion of glucose is sufficient to condition flavour preference22,23.
The gut-brain axis
A number of recent studies have implicated the gut-brain axis as a key mechanism to transmit information from the gut to the brain via the vagus nerve24–26. This so-called gut-brain axis is emerging as a fundamental conduit for the transfer of neural signals informing the brain of the metabolic and physiologic state of the body. If information about sugar detection is being transferred from the gut to the cNST via the gut-brain axis, then it should be possible to directly monitor the activity of this circuit by real-time recordings of cNST activation in response to synchronized gut stimulation with sugar. Importantly, this activity should be abolished following transection of the vagal nerve, and silencing vagal sensory neurons should prevent the creation of sugar preference.
We used fibre photometry27 to record sugar-evoked responses in the cNST of animals expressing the genetically encoded calcium indicator GCaMP6s in excitatory neurons (VGlut2-Cre;Ai96). To deliver stimuli to the gut, we placed a catheter directly into the duodenal bulb, and created an exit port by transecting the intestine ~12 cm distally (Fig. 2a, see Methods). As predicted, our results (Fig. 2b–d) showed robust responses to glucose and MDG. Most importantly, all activity was abolished after bilateral transection of the vagal nerves (Fig. 2b–e; Pre vs Post-vagotomized).
Figure 2: Silencing the sugar-activated circuit abolishes sugar preference.
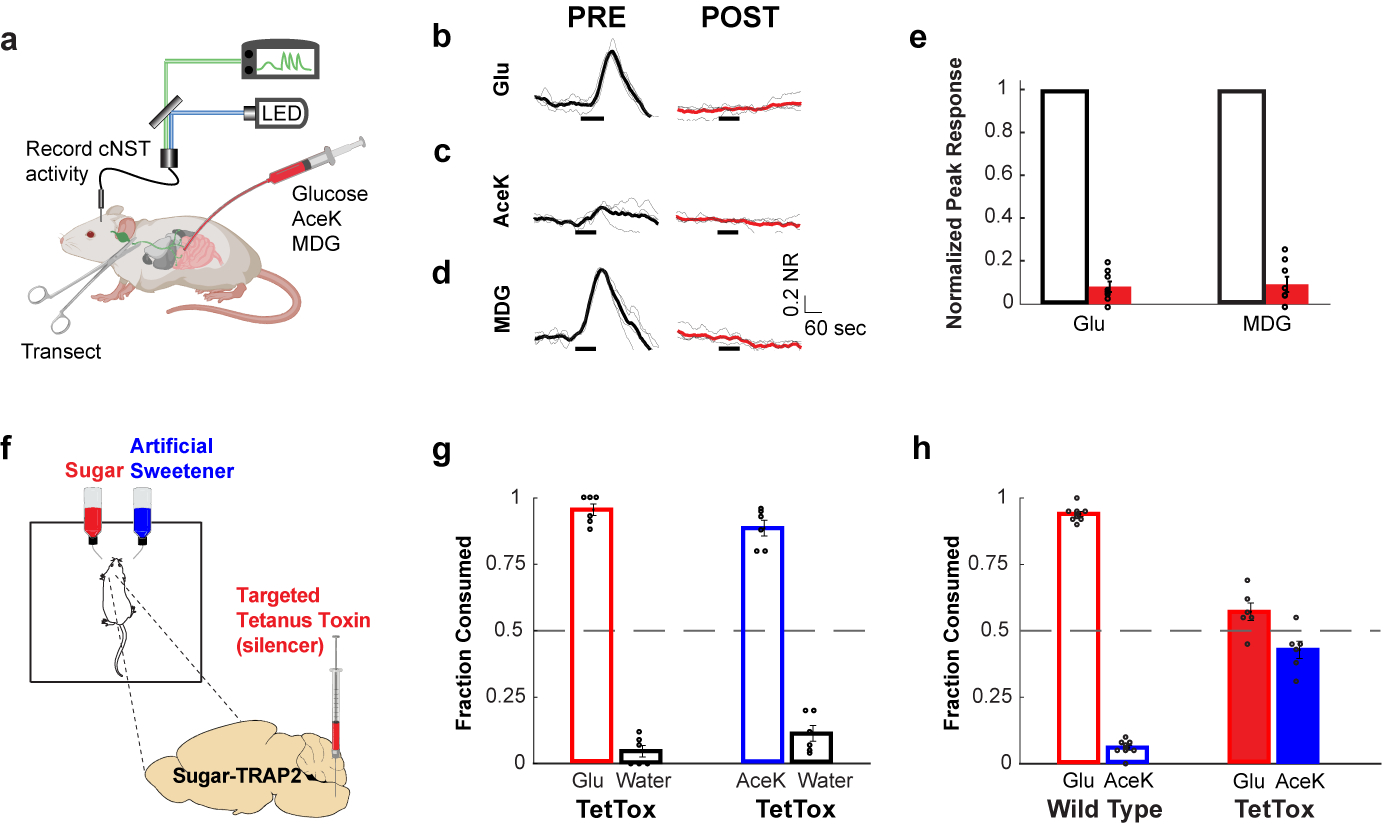
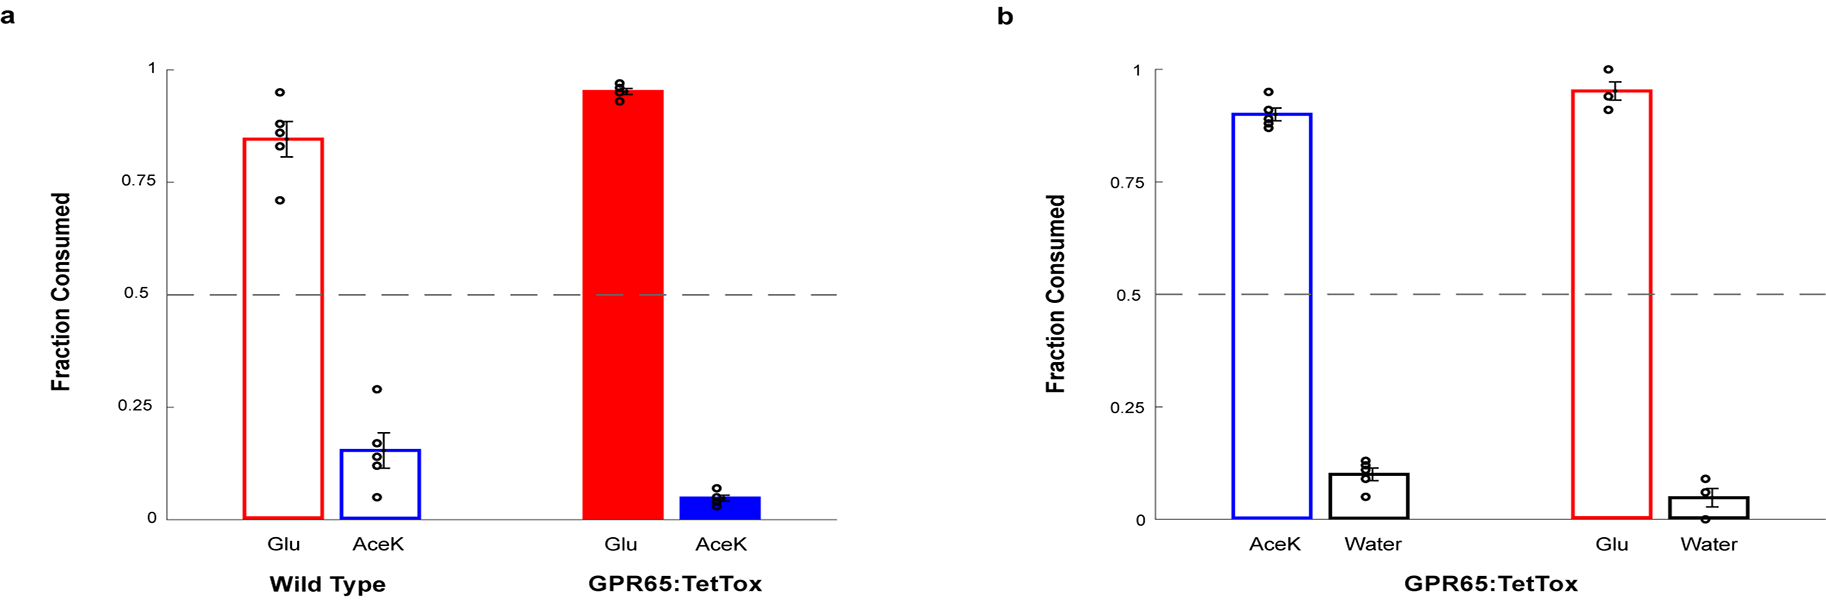
a, Fibre photometry monitoring glucose-evoked responses of cNST neurons. The excitatory neurons in the cNST were targeted with GCaMP6s using VGlut2-Cre animals46. b-d, Shown are neural responses following intestinal delivery of glucose, AceK and MDG. Note strong responses to sugar (panel b) and MDG (panel d). The light traces denote normalized 2-trial averages from individual animals, and the dark trace the average of all trials (NR = Normalized Responses). Black bars below traces indicate the time and duration of stimuli. In red are the average responses after bilateral vagotomy (see Methods). Stimuli, 500 mM glucose, 30 mM AceK, 500 mM MDG; n = 4 animals. e, Quantification of neural responses after vagotomy. Two-tailed paired t-test, p = 3 × 10⁻¹⁵ (glucose), p = 5 × 10⁻¹³ (MDG), n = 4 animals. Values are mean ± s.e.m. f, Schematic of silencing strategy. TRAP2 animals29 were stimulated with 600 mM glucose to induce expression of Cre-recombinase in the cNST. AAV-DIO-TetTox32 was then targeted bilaterally to the cNST for silencing. g, Silencing the sugar-preference neurons in the cNST does not impair the innate attraction to sugar or sweeteners. The graph shows preference for 600 mM glucose versus water, and preference for 30 mM AceK versus water, n = 6 animals. Values are mean ± s.e.m. h, Sugar-preference graphs (48 h tests) for wildtype mice, demonstrating the robust development of preference for sugar versus sweetener (see also Fig. 1). In contrast, silencing the sugar-activated neurons in the cNST abolishes the development of sugar preference, n = 6 mice, two-sided Mann-Whitney U-Test, p = 4 × 10⁻⁴; TetTox-silenced animals consumed as much of the AceK sweetener as they do sugar (see also Extended Data Fig. 5). Values are mean ± s.e.m.
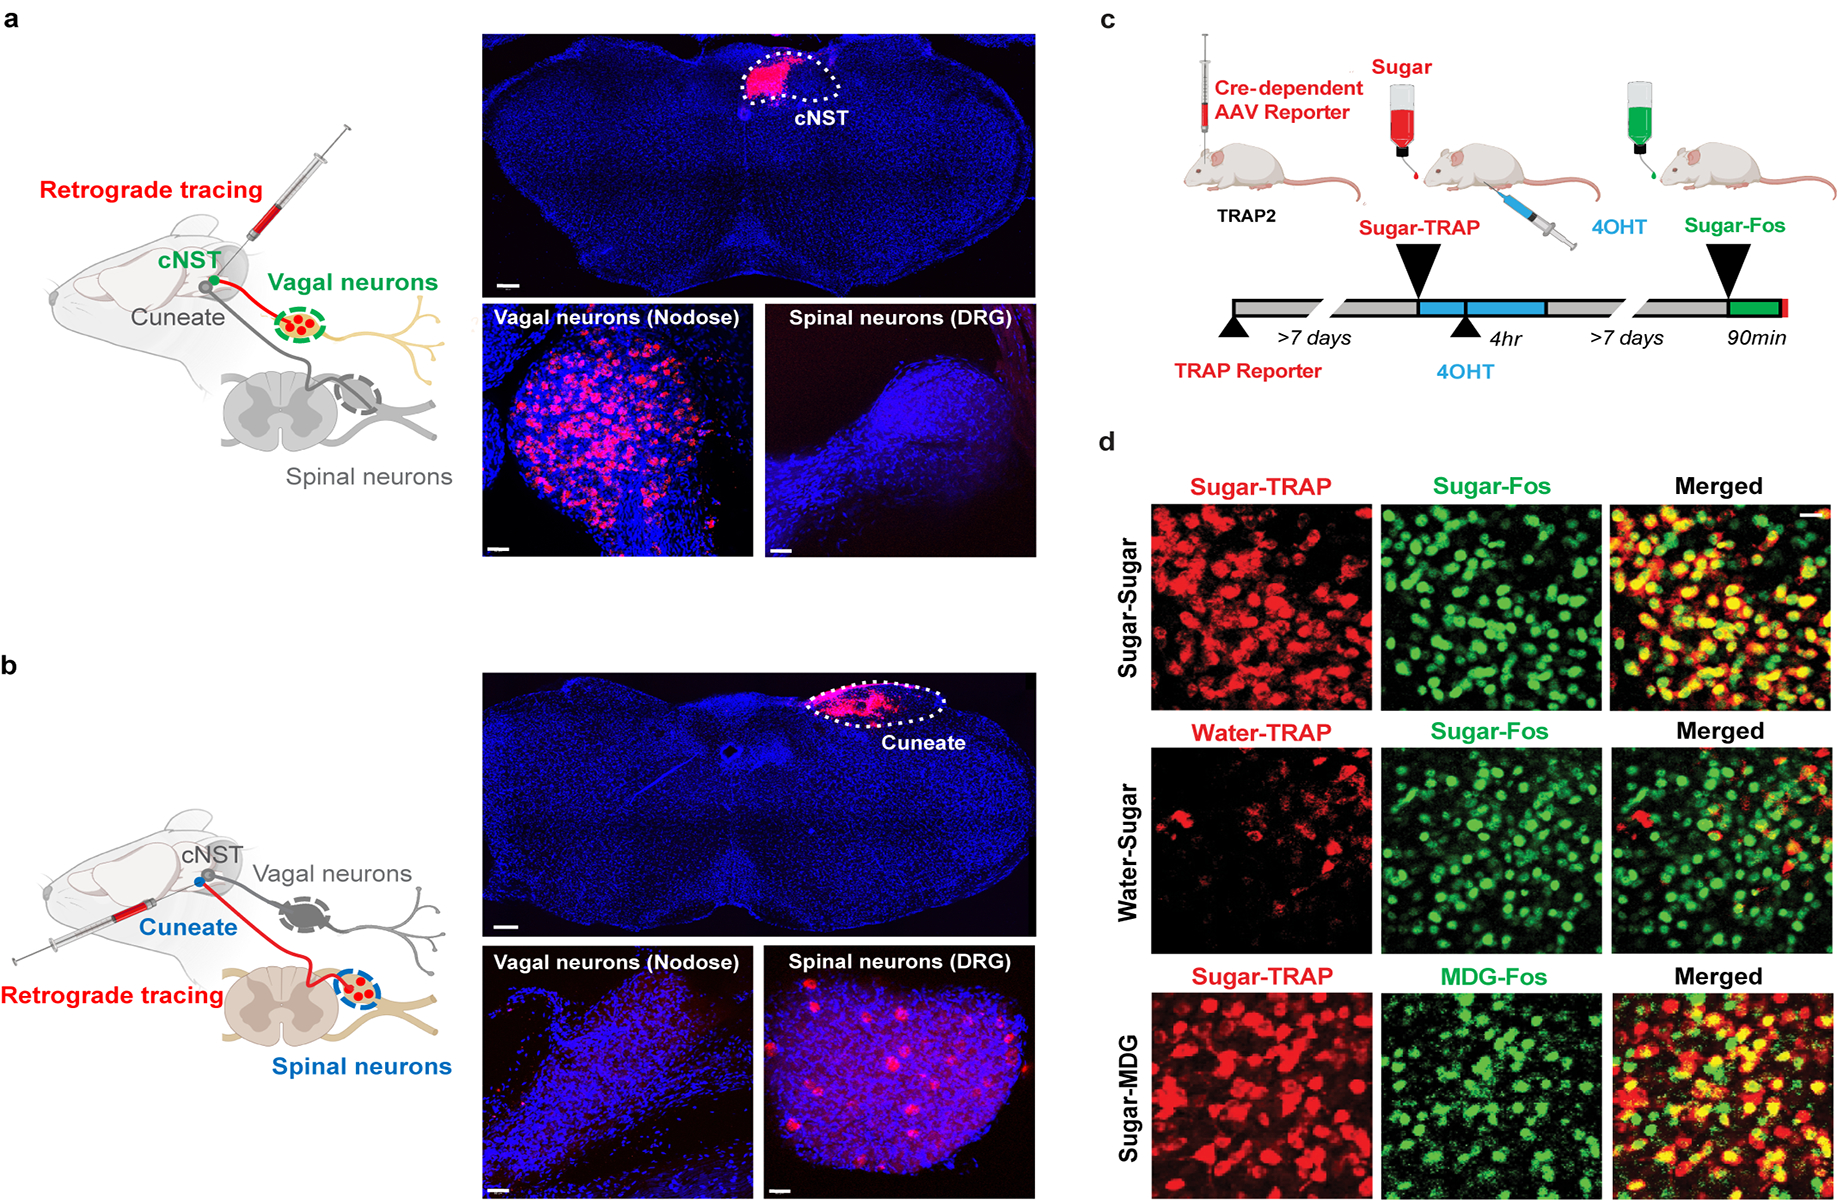
Next, we examined whether cNST neurons activated in response to sugar ingestion indeed receive direct input from vagal ganglion neurons (i.e. nodose; see Extended Data Fig. 4a–b). To test this hypothesis, we used the TRAP system28,29 to target Cre-recombinase to sugar-activated cNST neurons, and used a Cre-dependent monosynaptic retrograde viral reporter to identify their synaptically connected input neurons30,31.
We infected the cNST with AAV viruses carrying a Cre-dependent glycoprotein coat and a surface receptor for a transsynaptic reporter virus30,31, and TRAPed sugar-activated neurons (Fig. 3a; see Extended Data Fig. 4c–d for selectivity of TRAPing). Next, we infected the TRAPed neurons with the retrograde rabies reporter (RABV-dsRed), and asked whether sugar-activated cNST neurons receive input from vagal ganglion neurons. As controls, we carried out similar experiments but used water or sweetener as TRAPing stimuli. Our results (Fig. 3b–c) revealed large numbers of nodose neurons labelled by the transsynaptic tracing strategy, demonstrating the sugar-activated cNST neurons receive monosynaptic input from the vagal ganglion. In contrast, when we used AceK or water for TRAPing, only a small number of vagal neurons were labelled; we believe these represent activation to licking/drinking or ingestion (Fig. 3b–c).
Figure 3: Vagal ganglion neurons transmit sugar signals to the brain.
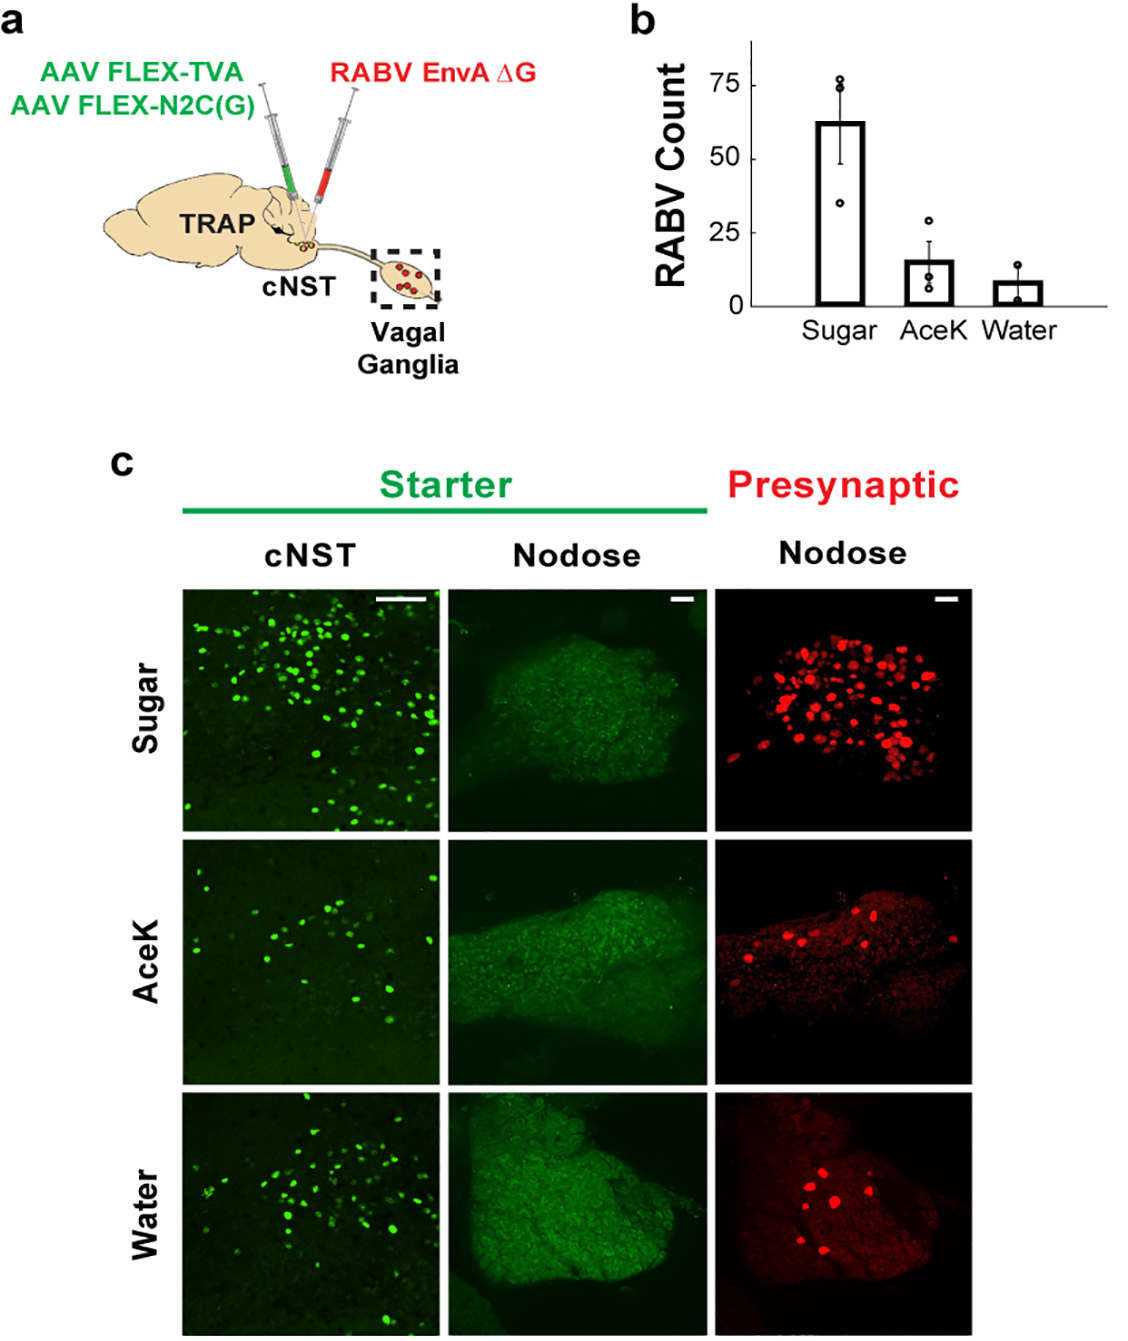
a, Strategy for targeting a red-fluorescently labelled retrograde transsynaptic rabies reporter (RABV-dsRed)28,31 to the cNST. Sugar-TRAP neurons in the cNST (defined as “starter”)30,31 were infected with the RABV-dsRed virus; the monosynaptic inputs of the sugar-activated cNST neurons are revealed by the retrogradely transsynaptic transfer of the RABV-dsRed virus. b, Quantification of retrogradely-labelled RABV-dsRed neurons in the nodose ganglion. Sugar- versus AceK-TRAPing (n = 3 animals), ANOVA Tukey’s HSD post hoc test, p = 0.0449. We also performed control TRAPing with water (n = 2 animals); Sugar- versus water-TRAPing, ANOVA Tukey’s HSD post hoc test, p = 0.0407; AceK versus water-TRAPing, p = 0.9. Values are mean ± s.e.m. c, Sugar-TRAPed cNST neurons (“starter”, green) receive monosynaptic input from vagal neurons (RABV, red). Note the absence of starter cells in the nodose, confirming that the RABV (red) cells represent retrogradely-labelled neurons30,31. Scale bars, 100 μm.
Finally, we carried out a genetic vagotomy by globally silencing nodose sensory neurons (see Methods), and as predicted, prevented the development of sugar preference (Extended Data Fig. 3c–d).
Neurons in cNST mediate sugar preference
If the gut-to-brain sugar-activated cNST neurons are essential for creating preference for sugar, then blocking their function should prevent the formation of sugar preference. Therefore, we engineered mice where synaptic transmission in the sugar-preference neurons was genetically silenced by targeted expression of Tetanus toxin light chain (TetTox)32. Our strategy relied on the TRAP system28,29 to express the inducible Cre-recombinase in the sugar-activated cNST neurons, and bilaterally injecting the cNST with an AAV virus carrying the Cre-dependent TetTox construct (Fig. 2f, see Methods).
First, we needed to ensure that silencing this circuit did not affect the innate ability of the animals to be attracted to sweet, including sugar and sweeteners. Indeed, when the TetTox-targeted animals were tested to choose between “sweet” versus water, they select the sweet tasting solutions (either AceK or glucose; Fig. 2g). But, can these animals develop preference for sugar? Remarkably, silencing the sugar-activated cNST neurons abolished the capacity of the animals to develop a preference for sugar over artificial sweetener, even after prolonged testing sessions (Fig. 2h; Extended Data Fig. 5). These results illustrate the essential role of this circuit in driving behavioural preference for sugar.
Vagal neurons sensing gut sugar
Since information about sugar detection is being transferred via the gut-vagal-brain axis, we set out to directly monitor the activity of this circuit by imaging vagal neuron responses to gut stimulation with sugar.
We implemented a vagal ganglion functional imaging platform (Fig. 4a) by targeting the genetically encoded calcium indicator GCaMP33 to vagal sensory neurons34 (VGlut2-Cre;Ai96). To visualize the neurons and measure calcium dynamics, we exposed a 1 cm2 ventral window into the ganglion and used a 1-photon microscope equipped with an emCCD camera for imaging35. For most imaging sessions, the intestinal segment was exposed to a pre-stimulus application of PBS, then a 10 s (33 μl) or 60 s (200 μl) test stimulus, and a 3 min post-stimulus wash. Neuronal signals were analysed for statistically significant increases in intracellular calcium over baseline (see Methods), and a neuron was classified as a responder if it exhibited responses in more than 60% of the trials36.
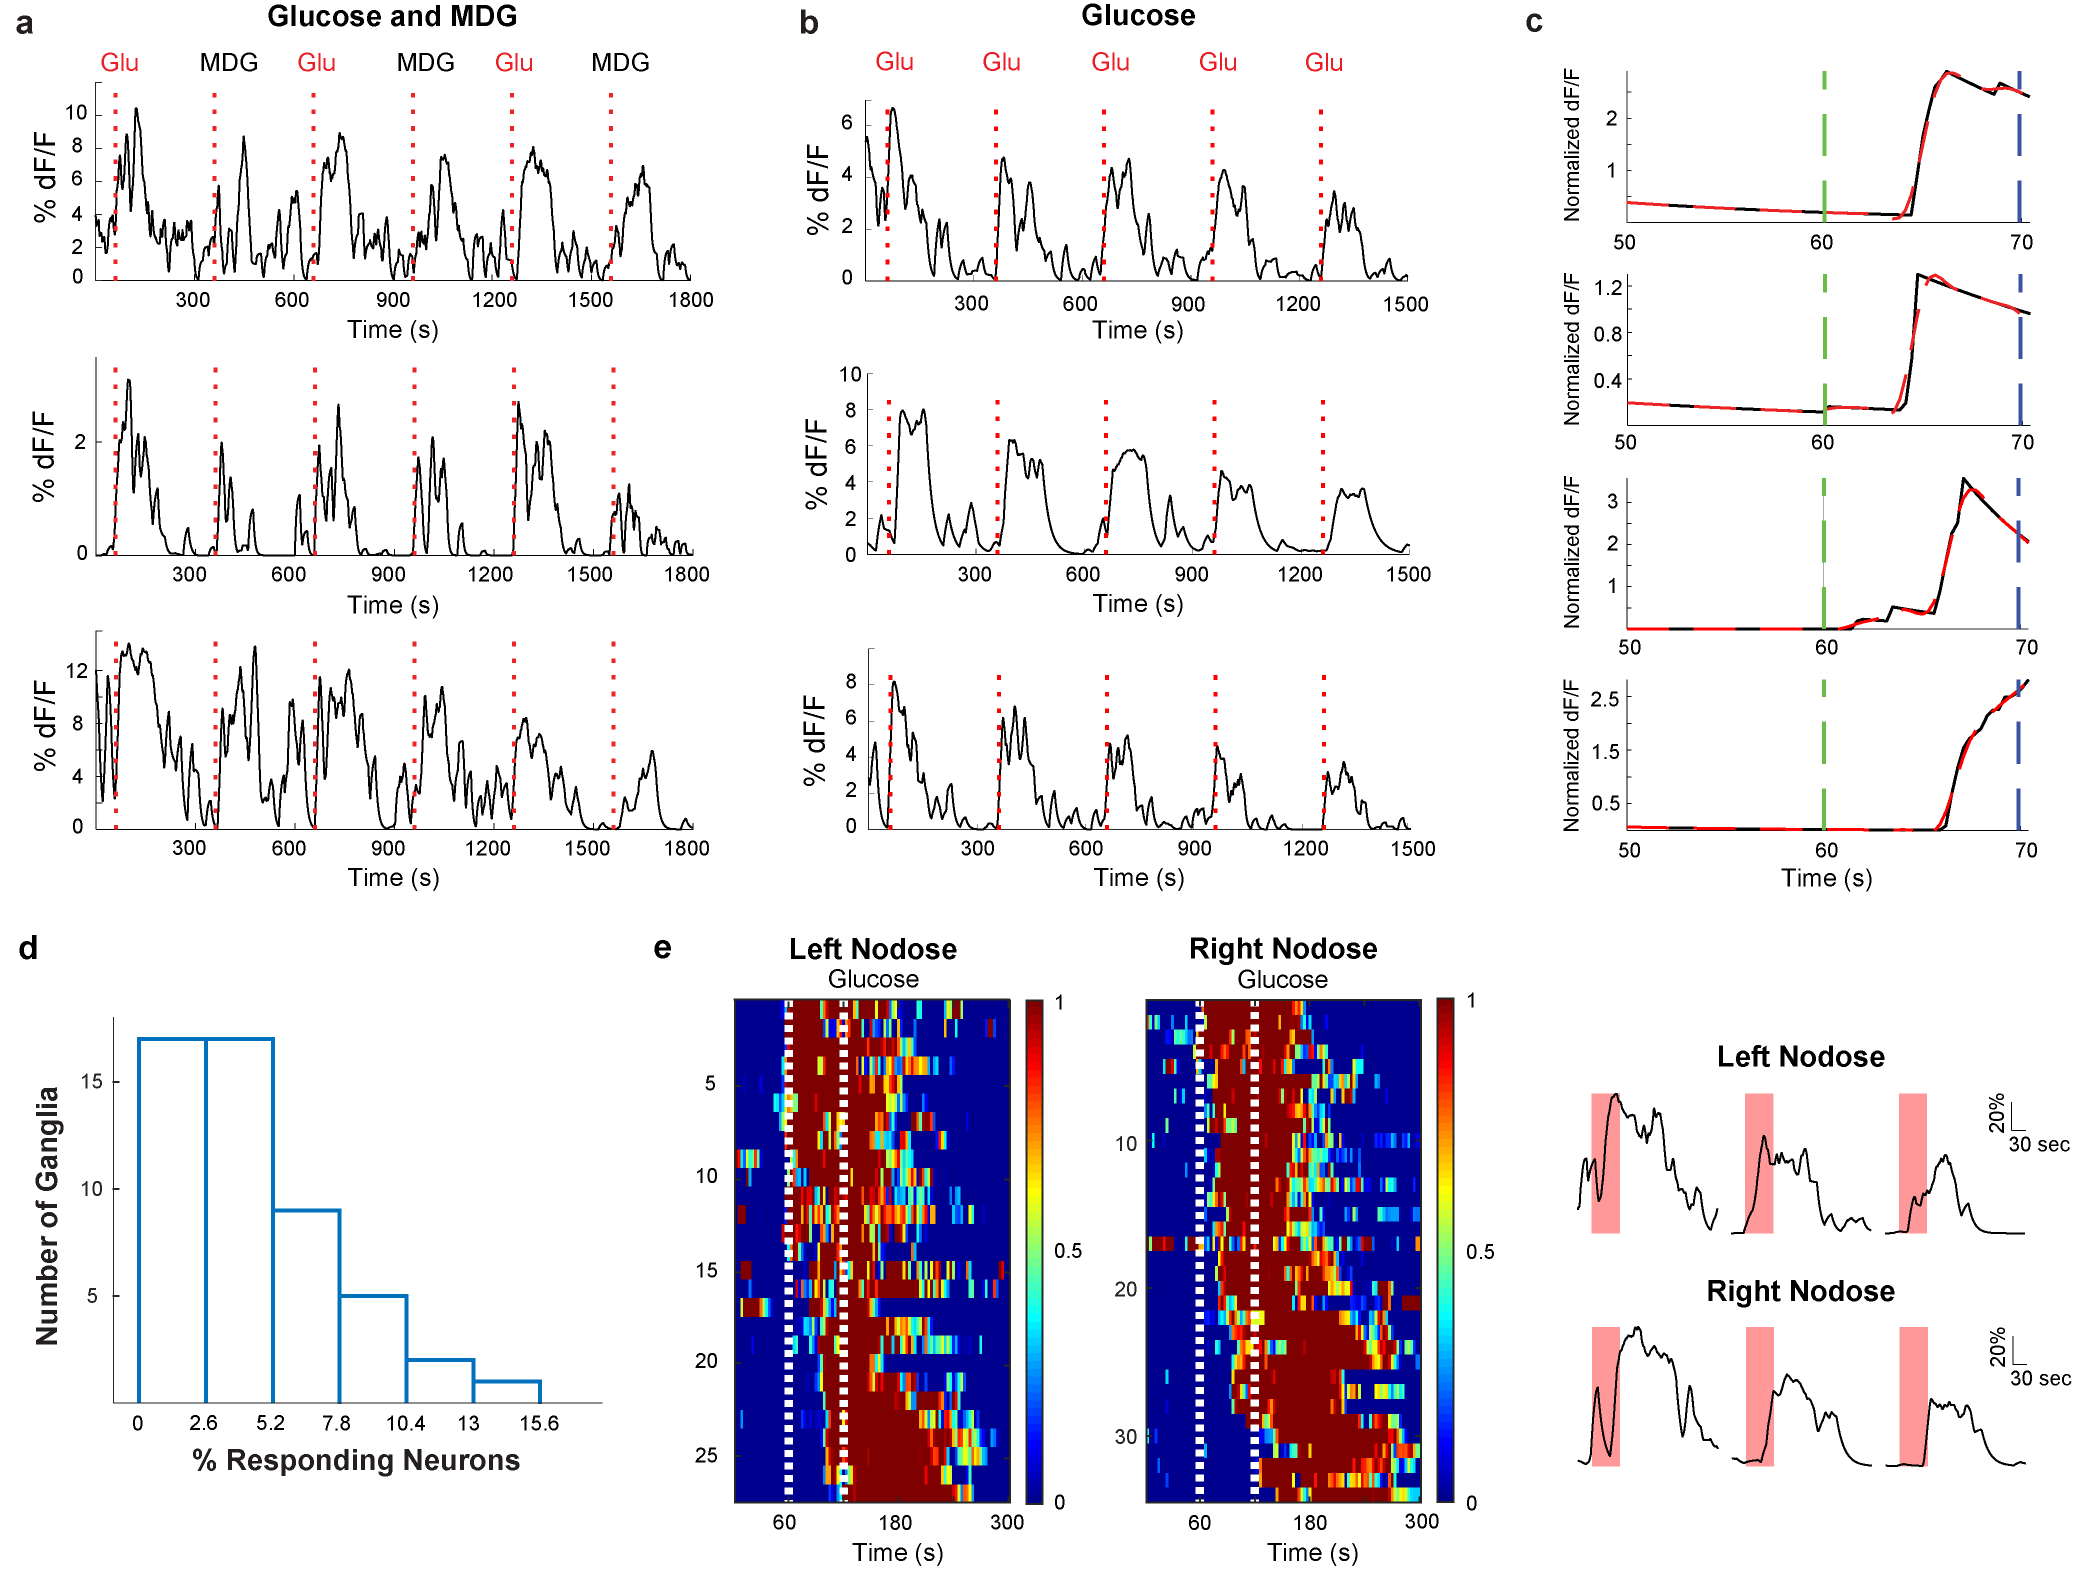
Figure 4: Imaging the gut-brain axis.
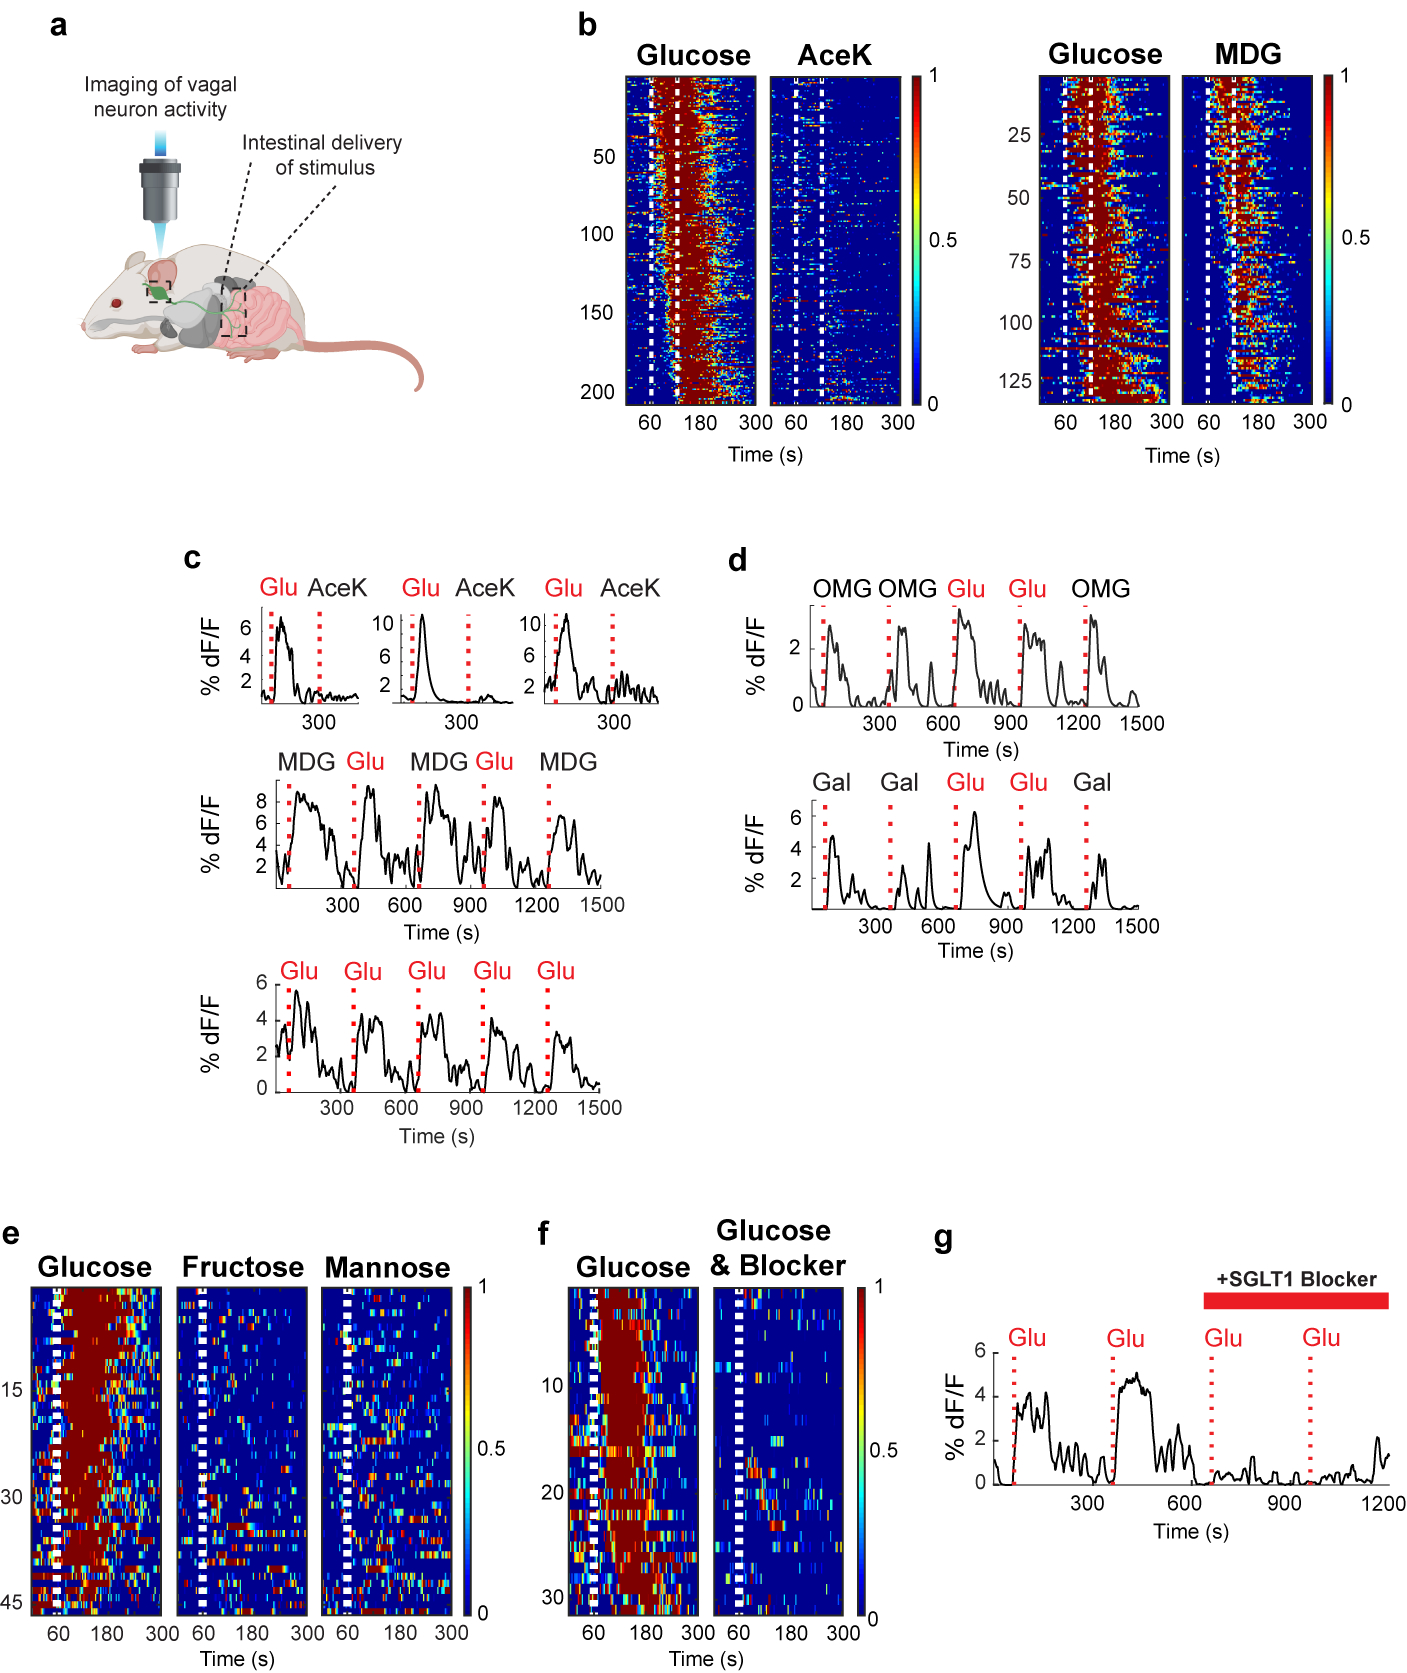
a, We imaged calcium responses in vagal sensory neurons expressing the fluorescent calcium indicator GCaMP6s while stimulating the intestines. b, Heat maps depicting z-score normalized fluorescence traces33,47 from vagal neurons identified as glucose responders. Each row represents the average activity of a single cell to 3 trials. Stimulus window shown by dashed white lines. The left panels are responses of n = 206 vagal neurons to a 60 s intestinal infusion of 500 mM glucose; note lack of responses to 30 mM AceK. The right heatmaps depict n = 133 vagal neurons that responded to 60 s 500 mM glucose, and tested for their responses to 500 mM MDG; heatmaps were normalized across stimuli; responses to glucose and MDG were similar (two-tailed paired t-test, p = 0.06). c, Sample traces of vagal neuron responses to intestinal stimulation with 60 s pulses of 30 mM AceK and 500 mM glucose from 3 mice (upper traces), or to 10 s pulses of 500 mM glucose and 500 mM MDG (lower traces). Note the reliability and rapid onset of responses to the 10 s stimulus (Extended Data Fig. 6c). When using a 10 s stimulus, to minimize potential osmolarity responses (Extended Data Fig. 8), approximately 5% of imaged neurons show statistically significant responses to glucose (Extended Data Fig. 6d). We compared imaging sessions with both the right and left ganglia25 and did not observe any meaningful difference in the proportion of glucose-responding neurons (Extended Data Fig. 6e). d, Vagal neuron responses to 3-OMG (top traces) and galactose (lower traces), n = 3 independent experiments each. These agonists activate vagal neurons in a similar manner to glucose (Extended Data Fig. 2b and 10a–b). e, The monosaccharides fructose and mannose, which are not substrates for SGLT-1, do not activate glucose-responsive neurons. Shown are heat maps of 46 glucose-responding neurons to 500 mM fructose and 500 mM mannose (n = 5 ganglia). Fewer than 10% of glucose responders were activated by either fructose or mannose. f-g, Summary of responses to a 10 s stimulus of 500 mM glucose for 33 neurons before and after intestinal application 8 mM Phlorizin for 5 min (n = 4 mice). Responses are severely diminished after blocker application (see Extended Data Fig. 10d–e and Methods).
First, we examined how vagal neurons respond to intestinal delivery of glucose versus sweetener. Delivering glucose into the intestines elicited significant calcium responses in subsets of ganglion neurons (Fig. 4b); we analysed the responses from the vagal ganglia of 8 different animals to a 60 s stimulus of glucose or AceK, and identified ~200 neurons that displayed statistically significant responses to glucose, but less than 1% of those displayed stimulus-dependent activity to AceK (Fig. 4b). As expected, intestinal delivery of MDG also activated the majority of vagal neurons that responded to glucose (Fig. 4b–c; Extended Data Fig. 6a).
Next, we assessed the reliability and temporal causality of the vagal responses by reducing the stimulus window from 60 s to 10 s. Our results showed that vagal responses to intestinal glucose are robust and reliable (Fig. 4c, Extended Data Fig. 6b–c)37. Overall, we examined 51 ganglia and 4–5% of GCaMP expressing neurons (205/4803 neurons) responded to the 10 s glucose stimulus (Extended Data Fig. 6d).
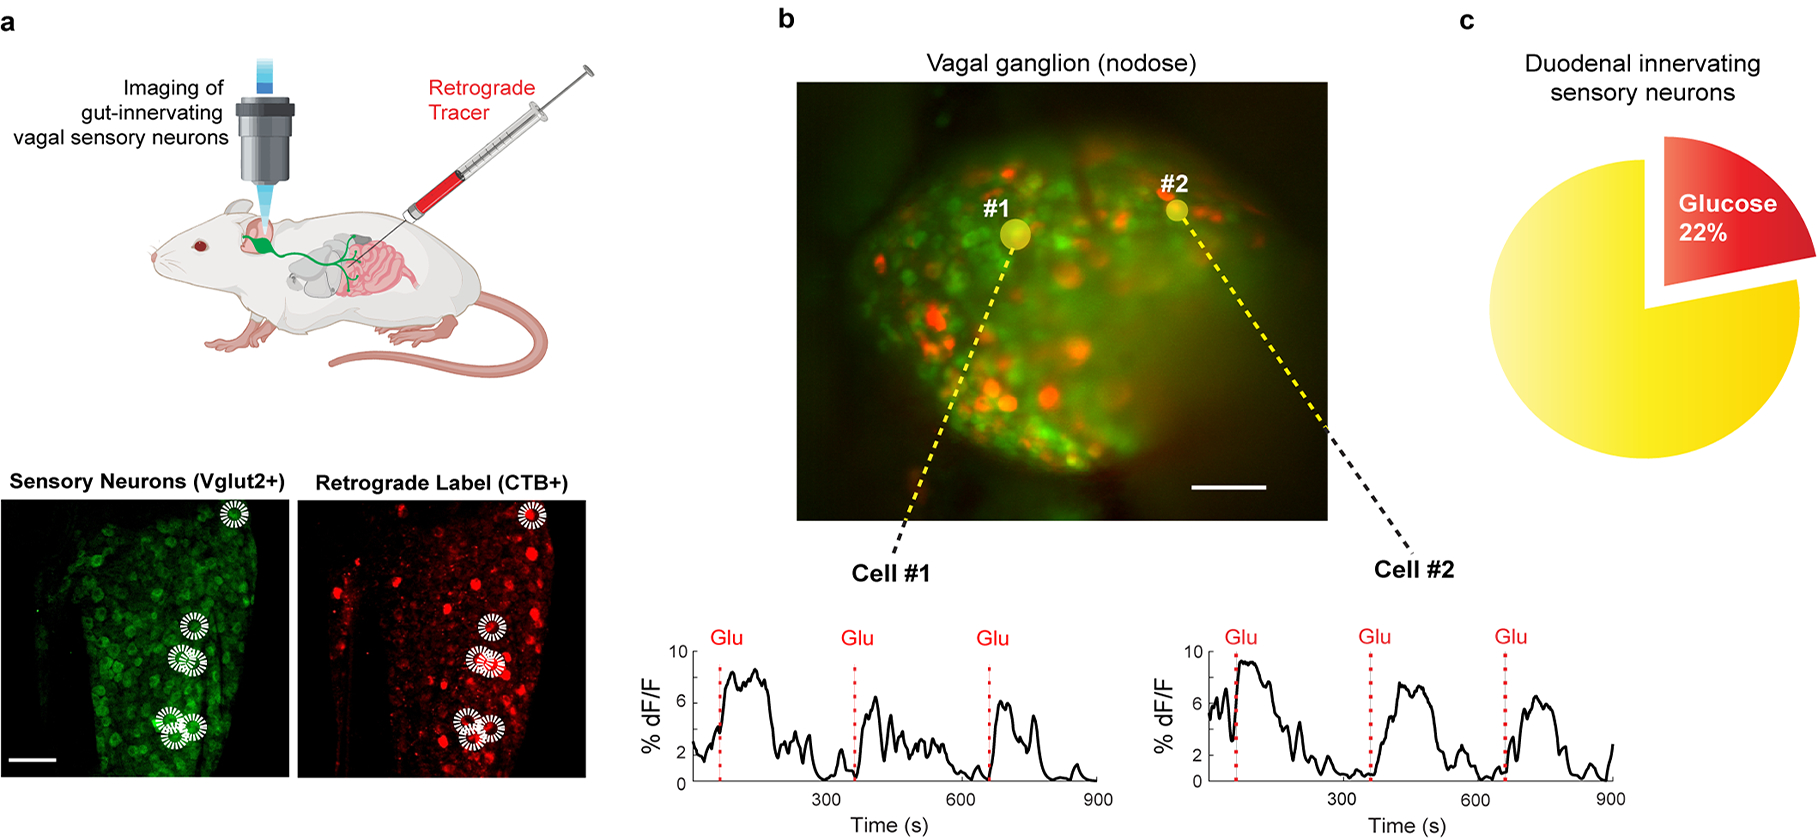
Since neurons in the nodose ganglion innervate the gut21 (i.e. the source of the gut-brain signal), the cell bodies of the sugar-sensing neurons in the nodose ganglion should be retrogradely labelled by applying a tracer from their afferents in the gut26. Thus, we injected fluorescently-conjugated cholera toxin subunit B (CTB)38 into the duodenum of GCaMP-expressing mice (Extended Data Fig. 7a), and then examined the labelled duodenal innervating neurons for responses to intestinal delivery of sugar. Indeed, ~20% of the duodenum back-filled vagal sensory neurons robustly responded to glucose (Extended Data Fig. 7b–c).
We note that a previous study reported the characterization of candidate nutrient-sensing neurons in the nodose ganglia24. These neurons responded indiscriminately to high concentrations of several stimuli, including 1 M glucose and 0.5 M salt. Our results have shown that such responses, largely independent of the quality of the stimulus, are not glucose-sensing nor are they required for the development of sugar-preference, but rather represent responses to a wide range of high osmolarity stimuli (Extended Data Fig. 8 and 9).
SGLT1 transduces gut-brain sugar signals
We reasoned that the gut-to-brain signal may depend on known sugar sensors recruited into this role, perhaps in a dedicated subpopulation of gut cells. While the sweet-taste receptor is expressed in enteroendocrine cells39, it is not involved in this process as sweet taste receptor knockouts (T1R2/3−/−) still exhibited normal sugar preference behaviour (Fig. 1c).
The principal glucose transporter (and sensor) in the intestines is the sodium-glucose-linked transporter-1 (SGLT-1)19,40. This transporter is expressed in enterocytes, as well as in enteroendocrine cells which secrete a wide range of hormones and bioactive molecules, and are thought to also function as a conduit between the gut and the vagal nerve41,42. Therefore, we asked whether SGLT-1 is required to transmit the gut-to-brain sugar signal by determining if other substrates of SGLT-1, galactose and the glucose analogue 3-OMG19, also activate the same vagal neurons as glucose. Indeed, neurons responding to intestinal glucose were also stimulated by 3-OMG and galactose (Fig. 4d; Extended Data Fig. 10a–b). Critically, this circuit is dedicated to glucose, as other caloric sugars like fructose and mannose (that are not substrates of SGLT-1) do not activate the glucose-responsive vagal neurons (Fig. 4e; Extended Data Fig. 10c)19, but still trigger osmolarity responses (Extended Data Fig. 8), and importantly, fail to create a behavioural preference (Extended Data Fig. 8e).
Next, we assessed whether pharmacological inhibition of SGLT-1 abolishes the glucose-dependent neuronal responses. We examined the responses to two consecutive 10 s stimuli of intestinal glucose before and after a 5 min wash of the intestinal segment with phlorizin19, an SGLT-1 blocker. Our results (Fig. 4f–g; Extended Data Fig. 10d–e), demonstrated a dramatic loss of glucose responses following intestinal application of phlorizin19. Together, these results place SGLT-1 as an as an important component of the sugar-preference signalling circuit. In the future, it will be of interest to determine the identity of the intestinal cells mediating these responses.
Co-opting the sugar preference circuit
The results presented above uncovered a specific circuit via the vagal ganglia to the brain critical for driving the development of preference for sugar. We devised an experiment to determine whether the selective activation of this circuit can be recruited to create a preference to a previously un-preferred stimulus. Our strategy was to identify a genetic driver that marks sugar-preference neurons in the cNST, and then link their activation to the ingestion of a novel stimulus.
We examined the Allen Brain Atlas for candidate genes with enriched expression in the cNST, and tested candidates for glucose-evoked Fos labelling (Fig. 5a). Our results demonstrated that Proenkephalin (Penk)-expressing neurons in the cNST43, marked by a Penk-Cre construct driving tdTomato (Penk-Cre;Ai75D), respond strongly to sugar stimuli (Fig. 5b–c); approximately 85% of the sugar-induced Fos-labelled neurons in the cNST are Penk-positive, and over 80% of the Penk-positive neurons were labelled by Fos after sugar ingestion.
Figure 5: Activation of sugar-responsive cNST neurons confers novel flavour preference.
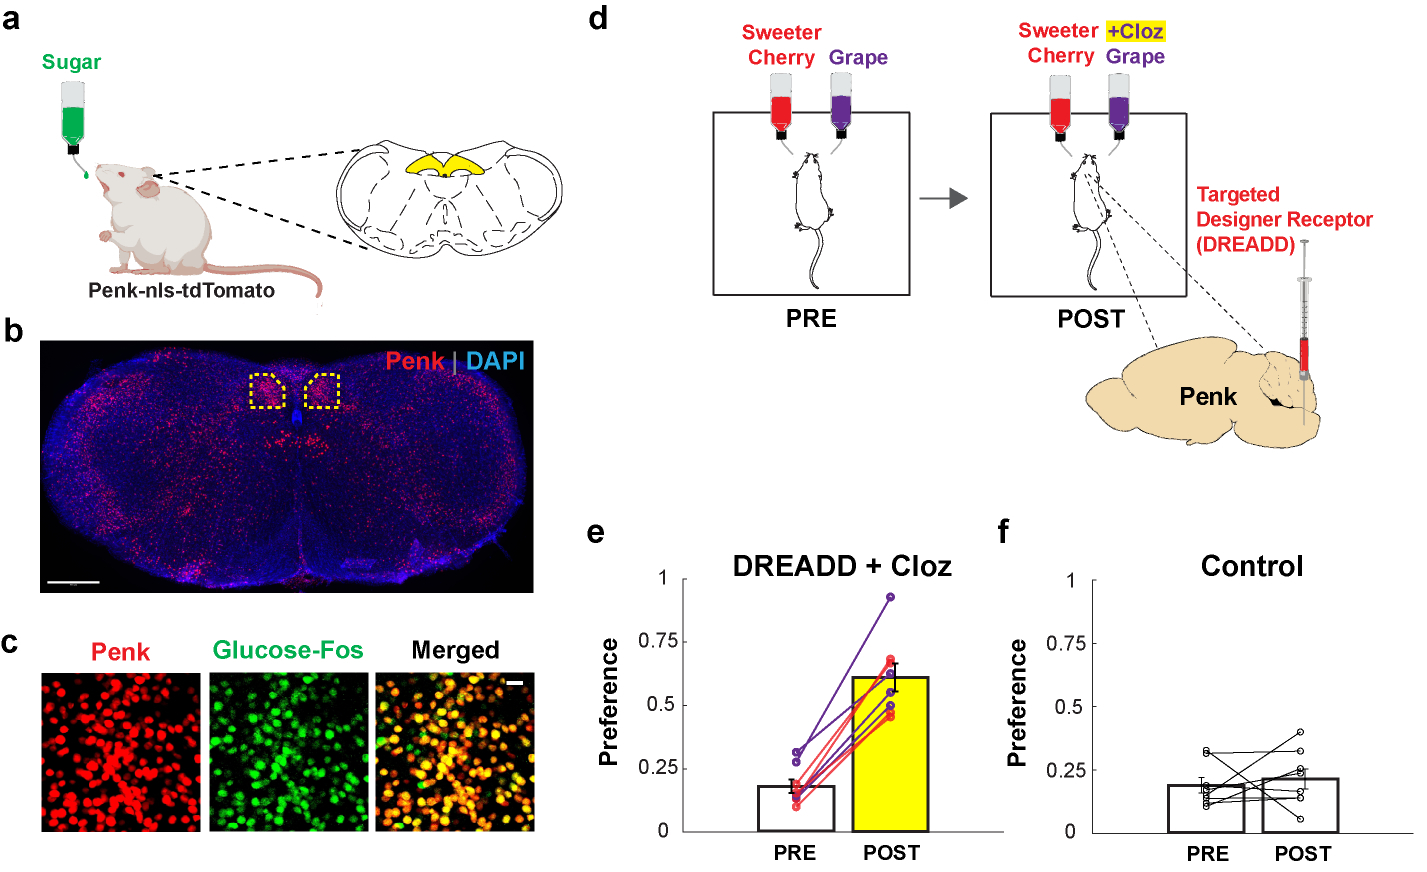
a-c, Penk-Cre mice were stimulated with 600 mM glucose, and brain slices were analysed for Fos and Penk labelling. Penk neurons were marked by expression of nuclear-localized tdTomato (Ai75D48). b, Low-magnification section of the brainstem (Bregma −7.5 mm) showing Penk expression (red); tissue was counterstained with DAPI (blue), n = 2 independent experiments. Scale bar, 500 μm; cNST, highlighted yellow. c, Sugar-preference neurons are Penk-expressing. Penk neurons labelled with tdTomato (from panel b) and glucose-activated neurons (Fos-labelled) marked green. Note the high degree of overlap in the merged image. Approximately 85% of sugar-activated cNST neurons are marked by Penk, and ~90% of cNST Penk neurons have sugar-Fos labelling (n = 3 mice). Scale bar, 20 μm. d, The activating DREADD receptor44,45 AAV-DIO-hM3Dq was targeted bilaterally to the cNST of Penk-Cre animals. Mice were then tested for their preference between two flavours for 48 h (PRE). The diagram shows an example using cherry (containing 2 mM AceK) versus grape (with 1 mM AceK). Animals were conditioned and tested using the un-preferred flavour plus the DREADD agonist Clozapine (POST; see Methods). e, Penk-hM3Dq animals initially prefer the sweeter solution. Remarkably, after associating Clozapine-mediated activation of Penk cNST neurons with the un-preferred flavour, all the Penk-hM3Dq mice significantly switched their preference (PRE = 18.1 ± 2.7 %, POST = 61.1 ± 5.5 %; n = 8 mice, two-sided Mann-Whitney U-Test, p = 1 × 10⁻⁴). The experiment was carried out using grape (purple lines) or cherry (red lines) as the initially un-preferred stimuli. f, Mice not expressing the DREADD receptor are unaffected by the presence of Clozapine (PRE = 19.0 ± 3.0 %, POST = 21.4 ± 4.0 %, n = 8 mice); control animals were subjected to the same conditioning and testing as the experimental cohort. Values are mean ± s.e.m.
We injected a Cre-dependent AAV virus encoding the excitatory designer receptor hM3Dq44 into the cNST of Penk-Cre mice, so that Penk cNST neurons could be experimentally activated by the hM3Dq agonists Clozapine N-Oxide or Clozapine44,45. After 8 days allowing for receptor expression, mice were exposed to 2-bottle preference assays using artificially-sweetened grape-flavoured versus cherry-flavoured solutions (Fig. 5d). Under this paradigm, the cherry solution was significantly sweeter than grape (see Methods), so that the animals would be significantly more attracted to the cherry flavour (Fig. 5e, Pre). Next, we introduced Clozapine into the un-preferred grape flavour, and asked whether Clozapine-mediated activation of the Penk cNST neurons (much like glucose would do) can create a new preference. Indeed, after 48 hours of exposure to the grape plus Clozapine bottle, mice completely switched their preference, even though the grape solution was still far less sweet than cherry (Fig. 5e, purple lines). To demonstrate that the preference switch is independent of the nature of the initially un-preferred stimuli, we flipped the starting flavours so that cherry was now less preferred, and obtained an equivalent switch in preference (Fig. 5e, red lines). As anticipated, wildtype mice without the designer receptor are indifferent to Clozapine and continue to prefer the sweeter solution (Fig. 5f). These results demonstrate that artificial activation of the sugar preference circuit is sufficient to drive the development of a novel preference to an otherwise non-preferred stimulus.
Discussion
Sugar is an essential energy source across all animal species, and it is therefore expected that selective circuits be dedicated to seek, recognize and motivate its consumption. The discovery of this gut-to-brain circuit provides a powerful pathway to help meet these needs.
In this study, we showed that glucose acts in the gut to activate a neural circuit that communicates to the brain the presence of sugar. Why a gut-to-brain sugar detection system in addition to the taste system? A post-ingestive sensing system in the gut assures that signalling only occurs after the sugar molecules reached their desired target for effective absorption and metabolic consumption. The association between the activation of this gut-to-brain circuit paired with the recognition of sugar by the taste system affords animals the fundamental capacity to identify, develop and reinforce a strong and durable preference for sugar-rich food sources. We suggest that the evolutionary association of these two separate circuits brilliantly combines nutrition with our basic sense of taste. In the future, it would be of interest to determine if preference for other essential nutrients also utilizes this gut-brain axis.
Notably, artificial sweeteners were introduced in consumer products over four decades ago, however, their overall impact in decreasing sugar consumption, preference, and craving has been negligible. This may now be understood at the circuit level (i.e. since unlike sugar, they do not activate the preference circuit), and implies that it may be possible to develop a new class of sweeteners that activate both the sweet taste receptor in the tongue and the gut-brain axis, and consequently help moderate the strong drive to consume sugar.
Online Methods
Animals
All procedures were carried out in accordance with the US National Institutes of Health (NIH) guidelines for the care and use of laboratory animals, and were approved by the Institutional Animal Care and Use Committee at Columbia University. Adult animals older than 6 weeks of age and from both genders were used in all experiments. C57BL/6J (JAX #000664), ArcCreER (TRAP, JAX #021881), TRAP2 (JAX #030323), TRPM5 KO (JAX #013068), T1R2/T1R3 double KO (generated in house, JAX #013065/013066), Ai96 (JAX #028866), VGlut2-IRES-Cre (JAX #028863), Gpr65-IRES-Cre (JAX #029282), Penk-IRES2-Cre (JAX #025112), Ai75D (JAX #025106), R26-TeNT (MGI #3839913).
Fos stimulation and immunohistochemistry
Animals were water restricted for 23 hours, given access to 1ml of water for 1 hour, and then water restricted again for another 23 hours. The stimulus consisted of 600 mM glucose, 600 mM MDG, 600 mM sucrose, 600 mM 3-OMG, 600 mM galactose, 30 mM AceK, or milliQ water for a period of 90 min in the absence of food. For intra-gastric infusion experiments, food was removed from the cage 12 hours before stimulus infusion. A syringe pump microcontroller (Harvard Apparatus) was used to deliver 1.5ml of the stimulus solution at 0.075ml/min. After 90 minutes, mice were perfused transcardially with PBS followed by 4% paraformaldehyde (PFA). Brains were dissected, and fixed overnight in PFA at 4°C. The brains were sectioned coronally at 100 μm, and labelled with anti-c-Fos (Santa Cruz, sc-52 goat, 1:500; or SYSY, Cat. 226004 guinea pig, 1:5000) in 5% Normal Donkey Serum (EMD Millipore/ Jackson ImmunoResearch) in 0.3% Triton-X100 in 1X PBS for 48 hours at 4°C with gentle shaking, and then Alexa 488-, or 568-, or 647-conjugated donkey anti-goat/ anti-guinea-pig (Jackson ImmunoResearch) in 5% Normal Donkey Serum in 0.3% Triton-X100 in 1X PBS for 24 hours at 4°C with gentle shaking. Images were acquired using an Olympus FluoView 1000 confocal microscope. Larger field-of-view images were acquired using a Nikon AZ100 Multizoom Slide Scanner. Quantification of Fos-labelled neurons was done by manual counting in a 300 × 300 μm ROI in the right caudal NST.
For intragastric stimulation, animals were anesthetized with ketamine and xylazine (100 mg/kg and 10 mg/kg, intraperitoneal). The stomach was exteriorized through an abdominal incision, and a Silastic (Dow Corning) tubing was inserted into the forestomach region and secured with silk sutures1. The other end was tunnelled subcutaneously along the left flank and exteriorized at the dorsal neck area. Mice were individually housed and allowed to recover for at least 5 days before stimulus infusion.
2-bottle preference assays
The preference switch experiments were carried out in standard mouse cages holding a custom designed 3D-printed scaffold for 2 bottles. Each bottle was outfitted with an electronic licking sensor, and access to the licking spout was controlled by a mechanical shutter. Mice were not water deprived before the experiment and had ad libitum access to food throughout. For behavioural tests, mice were first tested for their initial preference by completing 100 drinking trials. Each trial consisted of a choice between 600 mM glucose (or 600 mM MDG) and 30 mM AceK. Trials lasted 5 s and were initiated after the first lick to either bottle; inter-trial intervals were 40 s. To familiarize animals with the two choices, mice were required to complete 500 licks to 600 mM glucose alone, and 30 mM AceK alone; this was repeated twice. Animals were tested for their sugar (or MDG) versus sweetener preference over 36 h using 5-second trials. Preference indexes: Pre = the number of licks to glucose divided by the total number of licks during the first 100 trials of baseline measurements; Post = the number of licks to glucose divided by the total number of licks during the last 100 trials of the behavioural session. Because T1R2/3 double knockouts cannot taste sweet, they are often averse to the “bitter” in high concentrations of AceK (i.e. not being countered by its high sweetness), therefore they were tested with 300 mM sucrose vs 5 mM AceK.
Molecular cloning of custom pAAV constructs
pAAV.hSyn.FLEX-eGFP-Rpl10a.WPRE.hGH-pA is constructed by ligation of 2 fragments: the eGFP pAAV backbone fragment was generated by digestion of pAAV-FLEX-EGFPL10a, a gift from Nathaniel Heintz & Alexander Nectow & Eric Schmidt (Addgene plasmid # 98747), with MluI and KpnI, and the hSyn fragment with corresponding restriction ends was generated from pAAV-hSyn-DIO-hM4D(Gi)-mCherry, a gift from Bryan Roth (Addgene plasmid # 44362).
pAAV.CBA.FLEX-GFP-TeTx.WPRE.bGH-pA (TetTox) DNA is a gift from Peer Wolff2.
All pAAVs were amplified in recA1- NEB Stable cells and extracted by maxiprep (Zymo Research), and serotype 2/9 AAVs were produced by the Janelia Farms viral core.
Genetic access to sugar-preference neurons
The Targeted Recombination in Active Populations (TRAP)3–5 strategy was used in TRAP2 mice to gain genetic access to sugar-activated neurons in the caudal NST. 4-hydroxytamoxifen (4OHT, Sigma H6278) was prepared as previously described (DeNardo et al, 2018)5. AAV-injected TRAP2 mice were singly-housed, water restricted for 23 hours, given access to 1 ml of water for 1 hour, water restricted again for another 23 hours, and then presented with 600 mM glucose (or 30 mM AceK) ad libitum, in the absence of food and nesting material. After 1 h, mice were injected intraperitonially with 12.5 mg/kg 4OHT, and placed back to the same cage for an additional 3 h. At the end of the 4 hr of sugar or AceK exposure, mice were returned to regular home-cage conditions (group-caged, with nesting material, ad libitum food and water). Mice were used for experiments a minimum of 7 days after this TRAP protocol.
Stereotaxic Surgery
For stereotaxic injections of reporter virus, mice were anesthetized with ketamine and xylazine (100 mg/kg and 10 mg/kg, intraperitoneal), and placed into a stereotaxic frame with a close-loop heating system to maintain body temperature. For retrograde monosynaptic tracing, animals were unilaterally injected with 100 nl of a 1:1 mixture of AAVs carrying Cre-dependent rabies TVA and glycoprotein G (AAV1 EF1a-FLEX-TVA-mCherry, UNC vector core, and AAV1 FLEX-nGFP-2A-N2c(G) (a gift from Thomas Reardon)6, and a pseudotyped rabies virus carrying dsRed (RABV N2C(Delta G)-dsRed-EnvA, a gift from Thomas Reardon)6. cNST coordinates (Paxinos stereotaxic coordinates7) used for injections are relative to Bregma and skull surface: caudal 7.5 mm, lateral +/− 0.3 mm, ventral 3.7–4 mm.
Monosynaptic retrograde tracing and silencing experiments
For retrograde monosynaptic tracing, ArcCreER (TRAP)3 mice were allowed to recover 3 weeks after AAV injection, and the TRAP procedure was carried out as described above, except that 4OHT was prepared in corn oil3, and was injected 1 hour before stimulus presentation. After 7 days, EnvA-RABV was injected into the same site. Mice weresacrificed 2 weeks after the RABV injection and examined for expression of starter cells (nGFP+dsRed) and their monosynaptic inputs (dsRed)6,8.
For synaptic inhibition experiments, sugar-TRAP cNST neurons were bilaterally injected with 300 nl of AAV carrying Cre-dependent Tetanus Toxin Light Chain (AAV9 CBA.FLEX- TetTox)2.
Synaptic silencing experiments
C57BL/6J and Trap24,5 mice expressing TetTox in the caudal NST were tested in the 2-bottle sugar versus sweetener preference assay for 48 h. For the first day, animals were acclimatized by exposure to AceK versus water, the second they were given glucose versus water, and the third and fourth days they were tested for their preference to sugar versus sweetener. To ensure silencing did not impact “sweet taste” detection animals were also examined for their attraction to sugar versus water (2nd day) as well as artificial sweetener versus water (1st day). Fraction consumed for sugar versus AceK in Days 3–4 were calculated as (volume of glucose consumed)/(total volume consumed). Fraction consumed for AceK versus water was calculated as (volume of AceK consumed)/(total volume consumed).
Fibre photometry, gut stimulus delivery and vagotomy
VGlut2-Cre;Ai96 animals were placed in a stereotaxic frame and implanted with a 400 μm core, 0.48 NA optical fibre (Doric Lenses) 50–100 μm over the right cNST. Photometry experiments were conducted a minimum of 13 days after fibre implantation surgery. Real-time population-level GCaMP fluorescence was recorded using a RZ5P fibre photometry system with Synapse software (Tucker Davis Technologies) as described previously9. Briefly, sinusoidally modulated 465 nm and 405 nm light from light-emitting diodes (Doric Lenses) were combined via a multi-port fluorescence mini-cube into a fibre patchcord connected to the mouse, and real-time demodulated emission signals were saved offline for analysis. Calcium-dependent signals F(465nm) were compared with calcium-independent GCaMP fluorescence F(405nm) to control for movement and bleaching artefacts. The data was de-trended by first applying a least-square linear fit to produce Ffitted(405nm), and dF/F was calculated as (F(465nm)-Ffitted(405nm))/Ffitted(405nm) calculated10. Data from each mouse was then normalized to peak fluorescence (calculated as a 10-second window around the peak point), and presented as Normalized Responses (NR). For each stimulus, the normalized two-trial average was plotted and smoothed over a moving average. To quantify effects of vagotomy, we calculated the ratio of stimulus-related peak amplitude of the normalized trace (within 120-seconds of stimulus onset) before and after the procedure.
To deliver intestinal stimuli, all animals were anesthetized with ketamine and xylazine (100 mg/kg and 10 mg/kg, intraperitoneal), re-dosing was performed as necessary with ketamine only (33 mg/kg). Animals were immobilized as previously described11, positioned in a supine position, and its head rigidly secured using the metal bar. To ensure a clear airway, the mouse was tracheotomized. An incision was made into the greater curvature of the stomach, the tip of the catheter was inserted past the pyloric sphincter and secured by a suture into the duodenal bulb. Another suture was tied around the catheter and stomach to prevent spillage of gastric contents. Upon implantation of the catheter, the intestines were filled with 1 ml of PBS and an exit port cut at the most distally-inflated intestinal segment, approximately 12 cm from the catheter. The intestines were flushed with PBS for 5 min at 150 μl/min before the beginning of each experiment. Stimulus delivery was performed via a series of peristaltic pumps (BioChem Fluidics) operated via custom Matlab software/ Arduino microcontroller. Stimuli and washes were delivered through separate lines that converged on a common perfusion manifold (Warner Instruments) connected to the duodenal catheter. All trials were 7-minutes long and consisted of a 120-second baseline (PBS 150 μl/min), a 60 s stimulus (200 μl/min), and a 4 min washout period (180 s 600 μl/min, and 60 s 150 μl/min). Stimuli were each presented twice in an interleaved fashion. All chemicals were obtained from sigma and dissolved in 1xPBS at the following concentrations: 30 mM AceK, 500 mM glucose, and 500 mM MDG.
The vagotomy procedure was carried out immediately after the first round of stimuli. Salivary glands were cauterized and removed. Then, skin around the tracheotomy tube was retracted to expose the cervical trunk of the vagus nerve running in close proximity to the carotid artery. The nerve was carefully dissected from the underlying vessels using fine Dumont forceps and fully transected by a pair of Vannas scissors12.
Genetic vagal silencing experiments
VGlut2-Cre animals were anesthetized with ketamine and xylazine (100 mg/kg and 10 mg/kg, intraperitoneal). Ophthalmic ointment was applied to the eyes, and subcutaneous injections of carprofen (5 mg/kg) and buprenorphine (0.05 mg/kg) were given to each mouse prior to surgery. The skin under neck was shaved and betadine and alcohol were used to scrub the skin three times. A midline incision (~1.5 cm) was made and the trachea and surrounding muscles were gently retracted to expose the nodose ganglia. Then, AAV9 CBA.FLEX- TetTox (600 nl per ganglion) containing Fast Green (Sigma, F7252–5G) was injected in both left and right ganglia using a 30˚ bevelled glass pipette and Nanoliter 2000 microinjector positioned with a micromanipulator. Virus was injected in 60 nl pulses and ganglion targeting was visualized with the dye. At the end of surgery, the skin incision was closed using 5–0 absorbable sutures (CP medical, 421A). Mice were allowed to recover for a minimum of 26 days before behavioural testing. We note that 50% of the animals survived the surgical procedure and bilateral injections.
Vagal calcium imaging
VGlut2-Cre;Ai96 or Gpr65-Cre;Ai96 animals were anesthetized, tracheotomized, and positioned on a surgical platform (Thorlabs breadboard). The nodose ganglion was then exposed by severing the posterior tendon of the digastric muscle, cauterizing the occipital branch of the carotid artery and dissecting the trunk of the nerve. Then the preparation was affixed to a set of manual goniometric stages (Newport Instruments) allowing for angular rotation about the longitudinal and lateral axes for optimal positioning under the microscope. Imaging was as previously described13. Imaging data was obtained using an Evolve 512 EMCCD camera (Photometrics). Data was acquired at 10 Hz. A single field of view was chosen for recording and analysis from each mouse, each containing 80–150 segmented single neurons.
To deliver intestinal stimuli for nodose calcium imaging, the duodenum was also exposed and catheterised as described above. A typical trial was 5 minutes long and consisted of a 60s baseline (PBS 150 μl/min), a 10 s (or 60 s) stimulus (200 μl/min), and a 3 min washout period (120 sec 600 μl/min, 30 sec 1,800 μl/min, and 30 sec 150 μl/min). Chemicals were dissolved in PBS: AceK, 30mM; glucose, 500 mM, MDG, 500 mM; mannitol, 500 mM; galactose, 500 mM; 3-OMG, 500 mM. For SGLT-1 blocker experiments, 8 mM Phlorizin (Sigma) was dissolved PBS with 3% w/v 1 M NaOH (0.03 M NaOH final)14, which was titrated back to pH 7.4. The blocker was used within 30 min of preparation. The intestines were pre-washed with PBS + Phlorizin flowing at 150 μl/min for 5 min before commencing the experiments, glucose 500 mM was diluted in PBS + 8 mM Phlorizin.
For retrograde labelling of vagal neurons from the duodenum, recombinant Alexa 594 conjugated cholera toxin subunit B (CTB, Invitrogen C34777) was injected into the wall of the intestines. A total of 3 μl of 10 mg/ml (1%) CTB was injected across 10 sites in the duodenum (within 2 cm of the pylorus) using a 30˚ bevelled glass pipette connected to a Nanoliter 2010 microinjector (WPI). The pipette was inserted into the outer muscular layer of the intestines (i.e. not luminally) at an acute angle. Mice were used for calcium imaging experiments 3–5 days after CTB injection.
Calcium Imaging Data Collection and Analysis
Calcium imaging data collected at 10 Hz was down-sampled by a factor of 3, and the images stabilized using the NoRMCorre algorithm15. Motion corrected movies were then manually segmented in ImageJ using the Cell Magic Wand plugin16. Only ROIs whose average fluorescence was greater than the surrounding neuropil in more than 10% of frames were used for further analysis. Neuropil fluorescence was subtracted from each ROI with the FISSA toolbox17, and neural activity was denoised using the OASIS deconvolution algorithm18.
Neuronal activity was analysed for significant stimulus-evoked responses, as described by Barretto et al11, with the following modifications. To determine the baseline to calculate z-scores, traces were smoothed over a 15 second moving window, and a baseline distribution of deviations from the median for each cell over the entire experiment was calculated using periods preceding the stimulus onset. This baseline was then used to calculate a modified z-score by subtracting the median and dividing by the median absolute deviation. Trials with an average modified z-score above 1.6 for the 90 seconds following presentation of the stimulus were classified as responding trials, and a cell was required to respond in more than 60% of stimulus trials to be classified as a responder. This criterion was validated against visual identification of responses by independent investigators and accurately identified >90% of the same cells with less than 5% false positive rate. Only cells that reached at least 2% dF/F for the first two trials of glucose were included in heat maps. Heatmaps for each experiment were normalized across stimuli, so different stimuli are directly comparable. We note that there were no significant numbers of MDG-only responses (~95% of the neurons that responded to MDG also responded to glucose; a total of 168 MDG responders were analysed and 159 showed responses to both). For the blocker and control data (Fig. 4, Extended Data Fig. 10) responses were filtered to ensure reliable trials preceding blocker addition (i.e. the two responses prior to blocker addition had to be within 70% of each other).
Chemogenetic activation experiments
For gain of preference experiments, Penk-Cre animals were stereotaxically injected with 300 nl of AAV carrying Cre-dependent activator DREADD (1–2 × 10¹³ GC/ml; AAV9 Syn-DIO-hM3Dq-mCherry, Addgene #44361), bilaterally in the cNST. At least 8 days was allowed for recovery and viral expression before behavioural testing. We note that in control studies, we validated that injections into the cNST did not infect vagal neurons. We examined 6 different ganglia with thousands of neurons and detected a total of only 4 labeled neurons (see also Figure 3e for an example with AAV1).
C57BL/6J and Penk mice expressing hM3Dq in the cNST were tested in a 2-bottle grape vs cherry flavour preference assay. Grape solution= 0.39 g/L Kool-Aid Unsweetened Grape (Cat. 00043000955635) in 1 mM AceK in milliQ water; cherry solution= 0.9 g/L Kool-Aid Unsweetened Cherry (Cat. 00043000955628) in 2 mM AceK in milliQ water. For the first 48 h, animals were tested for their initial preference (PRE) between solutions. Mice were then exposed to cherry only for 2 × 24 h sessions (days 3 and 5), and grape plus 0.005 g/L Clozapine dihydrochloride (Hello Bio #HB6129–50mg) for 2 × 24 h sessions (days 4 and 6) for conditioning19. Mice were then assayed for their preference after the conditioning sessions on days 7 and 8. Initial preference is calculated as the average of days 1–2 (volume of grape solution consumed)/(total volume consumed), and post-conditioning preference is similarly calculated from days 7–8. To demonstrate that the switch is independent of the nature of the initial unpreferred stimuli, 4/8 C57BL/6J and 4/8 Penk-hM3Dq mice were tested with reversed flavour conditions (i.e. conditioned to 0.9 g/L cherry in 1 mM AceK with Clozapine).
Brief access preference assay
C57BL/6J mice were tested for their immediate taste preferences in a short-access 2-bottle preference assay20. Singly housed naïve mice were acclimated in new cages with access to 2 bottles of water overnight. Animals were then water deprived for 1h and presented with 600 mM glucose versus 600 mM MDG for 1 hour. Preference for glucose was calculated as (volume of glucose consumed)/(total volume consumed).
Insulin and glucose measurements
Plasma insulin and blood glucose measurements were performed as previously described21. Male C57BL/6J mice were group-housed in cages with wood chip bedding. Mice were habituated to scruffing and blood draws at least twice before the experiment. On the day of sample collection, animals were subjected to a 5-hour fast (food removed and transferred to clean cages) beginning at the lights-on period of the light-dark cycle (7am). Mice were gavaged with 555 mM glucose or MDG at 2 mg/kg. Blood (~100 μl) was collected before and 15 min after gavage into a chilled heparin-coated Eppendorf. Glucose measurements were taken on whole blood via hand-held glucometer (OneTouch Verio). For insulin measurements, samples were run on a mouse insulin ELISA kit (Mercodia, 10-1247-01) according to the manufacturer’s directions.
Retrograde labelling of vagal neurons from brainstem
C57BL/6J mice were stereotaxically injected with 50 nl of red or green fluorescent RetroBeads (Lumafluor) in the cNST or Cuneate nucleus (Paxinos stereotaxic coordinates relative to Bregma and skull surface: caudal 7.5 mm, lateral 0.9 mm, ventral 3.6 – 3.9 mm). Mice were sacrificed 6–7 days after RetroBeads injection. Prior to analysis, the brainstem was sliced coronally to confirm accurate targeting to the cNST and Cuneate. Nodose and dorsal root ganglia (across the cervical, thoracic, and lumbar segments)22 were examined for fluorescent labelling.
Statistics
No statistical methods were used to predetermine sample size, and investigators were not blinded to group allocation. No method of randomization was used to determine how animals were allocated to experimental groups. Statistical methods used include one-way analysis of variance (ANOVA) followed by Tukey’s Honest Significant Difference (HSD) post-hoc test, two-tailed t-test, or the two-sided Mann-Whitney U-test, and are indicated for all figures. All analyses were performed in MATLAB. Data are presented as mean ± s.e.m.
Code availability
Custom code is available from the corresponding author.
Data availability
All data supporting the findings of this study are available upon request.
Extended Data
Extended Data Figure 1: Glucose and MDG Preference.
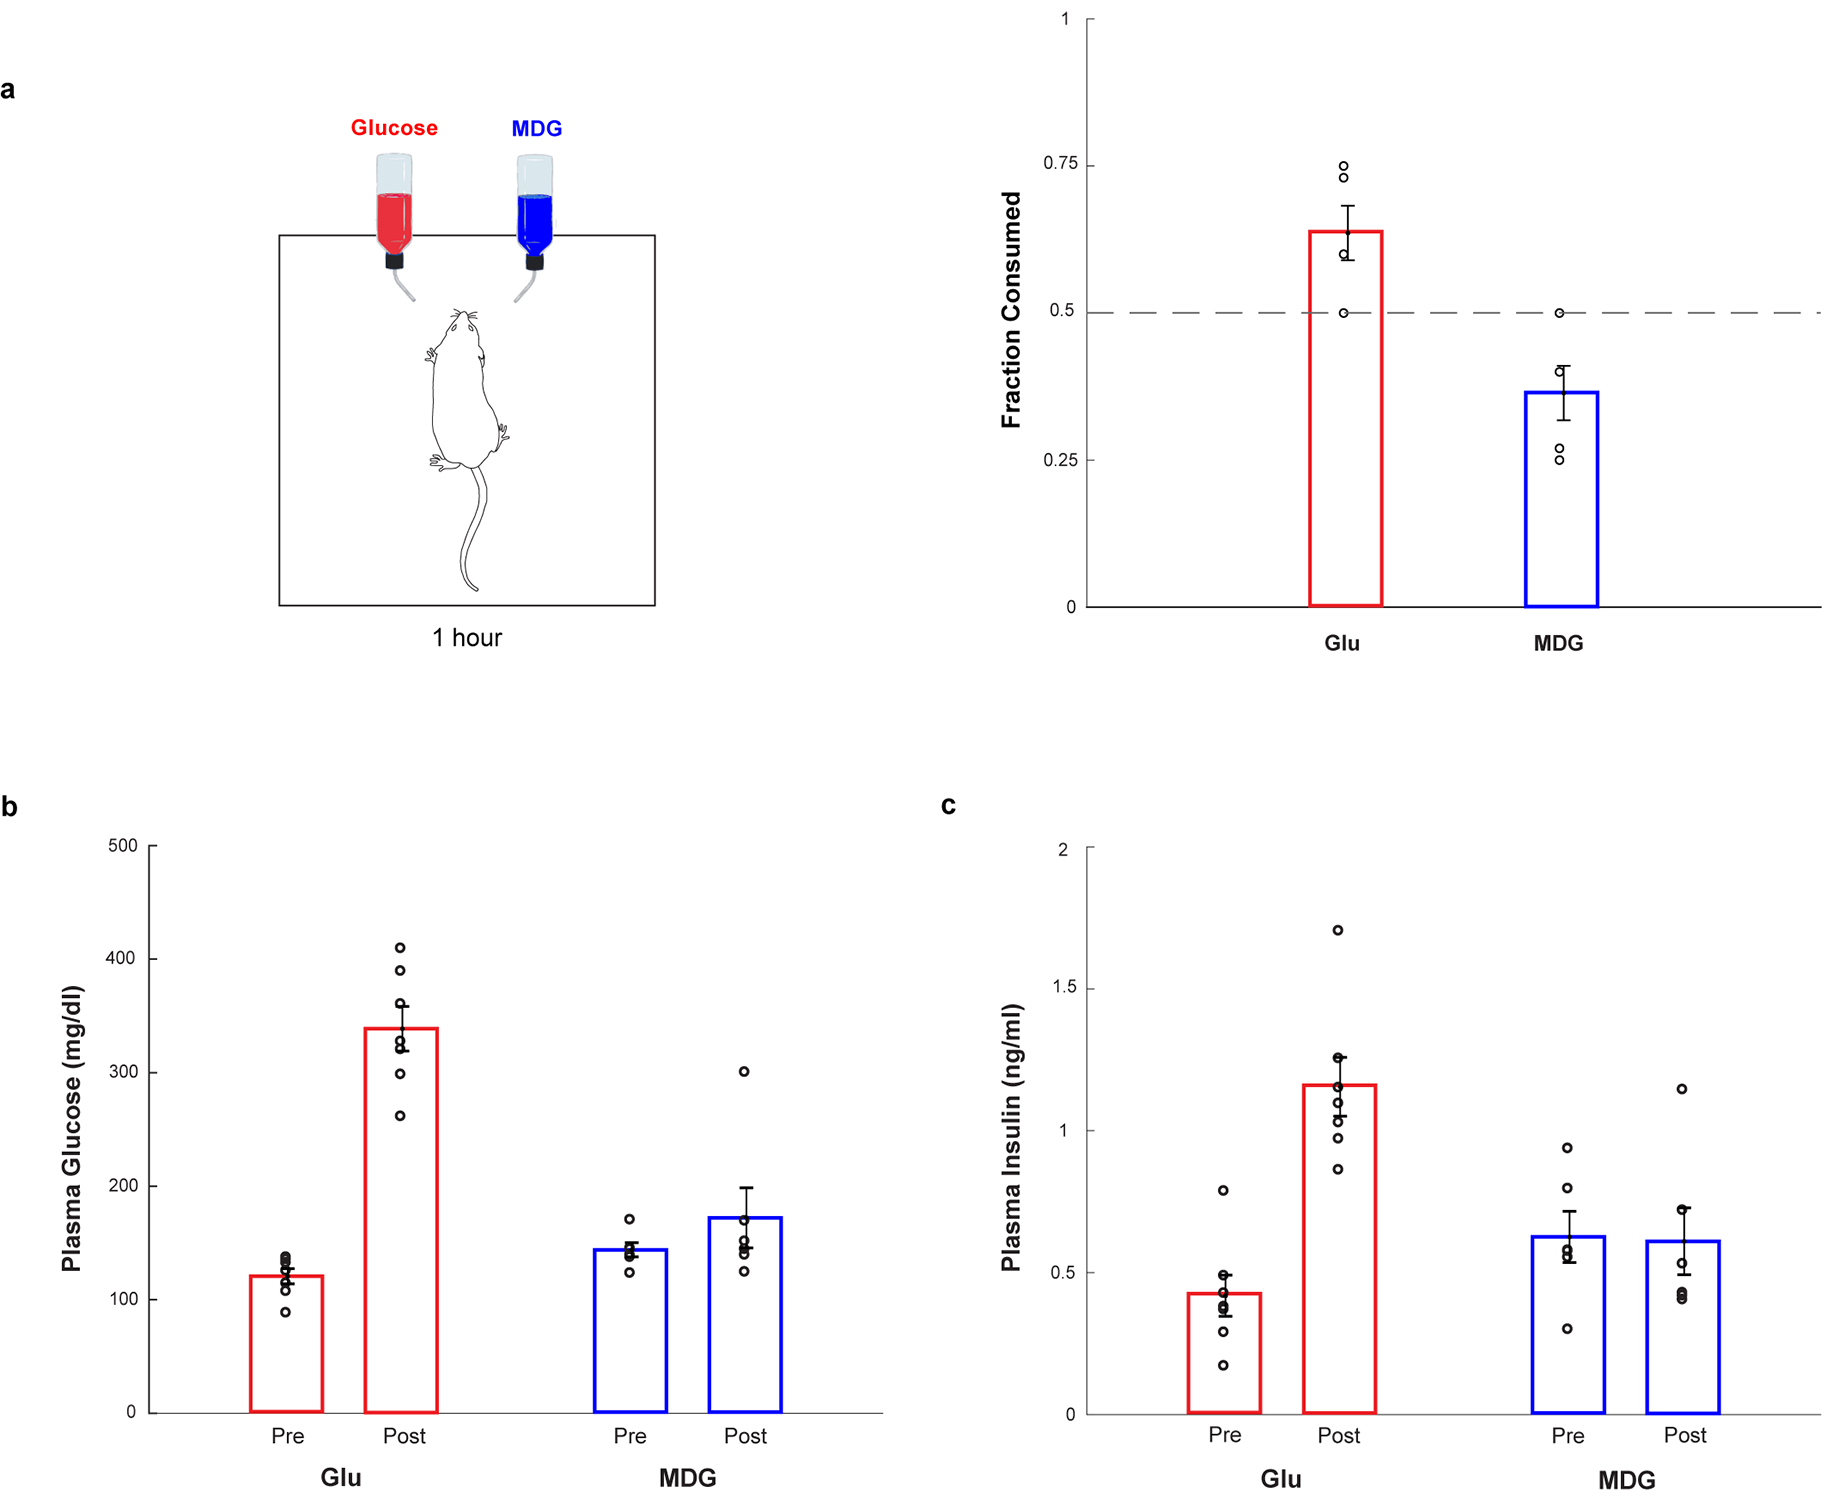
a, When mice are given a choice between 600 mM glucose or 600 mM MDG, using a brief-access (1 hour) test, naive animals display a small preference for glucose over MDG (n = 5, two-tailed paired t-test, p = 0.0406), likely because MDG is slightly less sweet and thus not as attractive. Values are mean ± s.e.m. b-c, Although the non-caloric sugar analogue MDG is very effective in causing a preference switch (see Fig. 1), it does not cause increases in plasma glucose or release of insulin. Mice were gavaged with glucose or MDG, and plasma glucose and insulin levels were sampled before (“Pre”), and at 15 min after the gavage (“Post”). Panel b, plasma glucose after glucose gavage (red bars), n = 7, two-tailed paired t-test, p = 4 × 10⁻⁵. Plasma glucose after MDG gavage (blue bars), n = 6, two-tailed paired t-test, p = 0.36. Panel c, plasma insulin levels after glucose gavage (red bars), n = 7, two-tailed paired t-test, p = 7 × 10⁻⁶. Plasma insulin levels after MDG gavage (blue), n = 6, two-tailed paired t-test, p = 0.94. Values are mean ± s.e.m.
Extended Data Figure 2: Fos responses are robust and reliable.
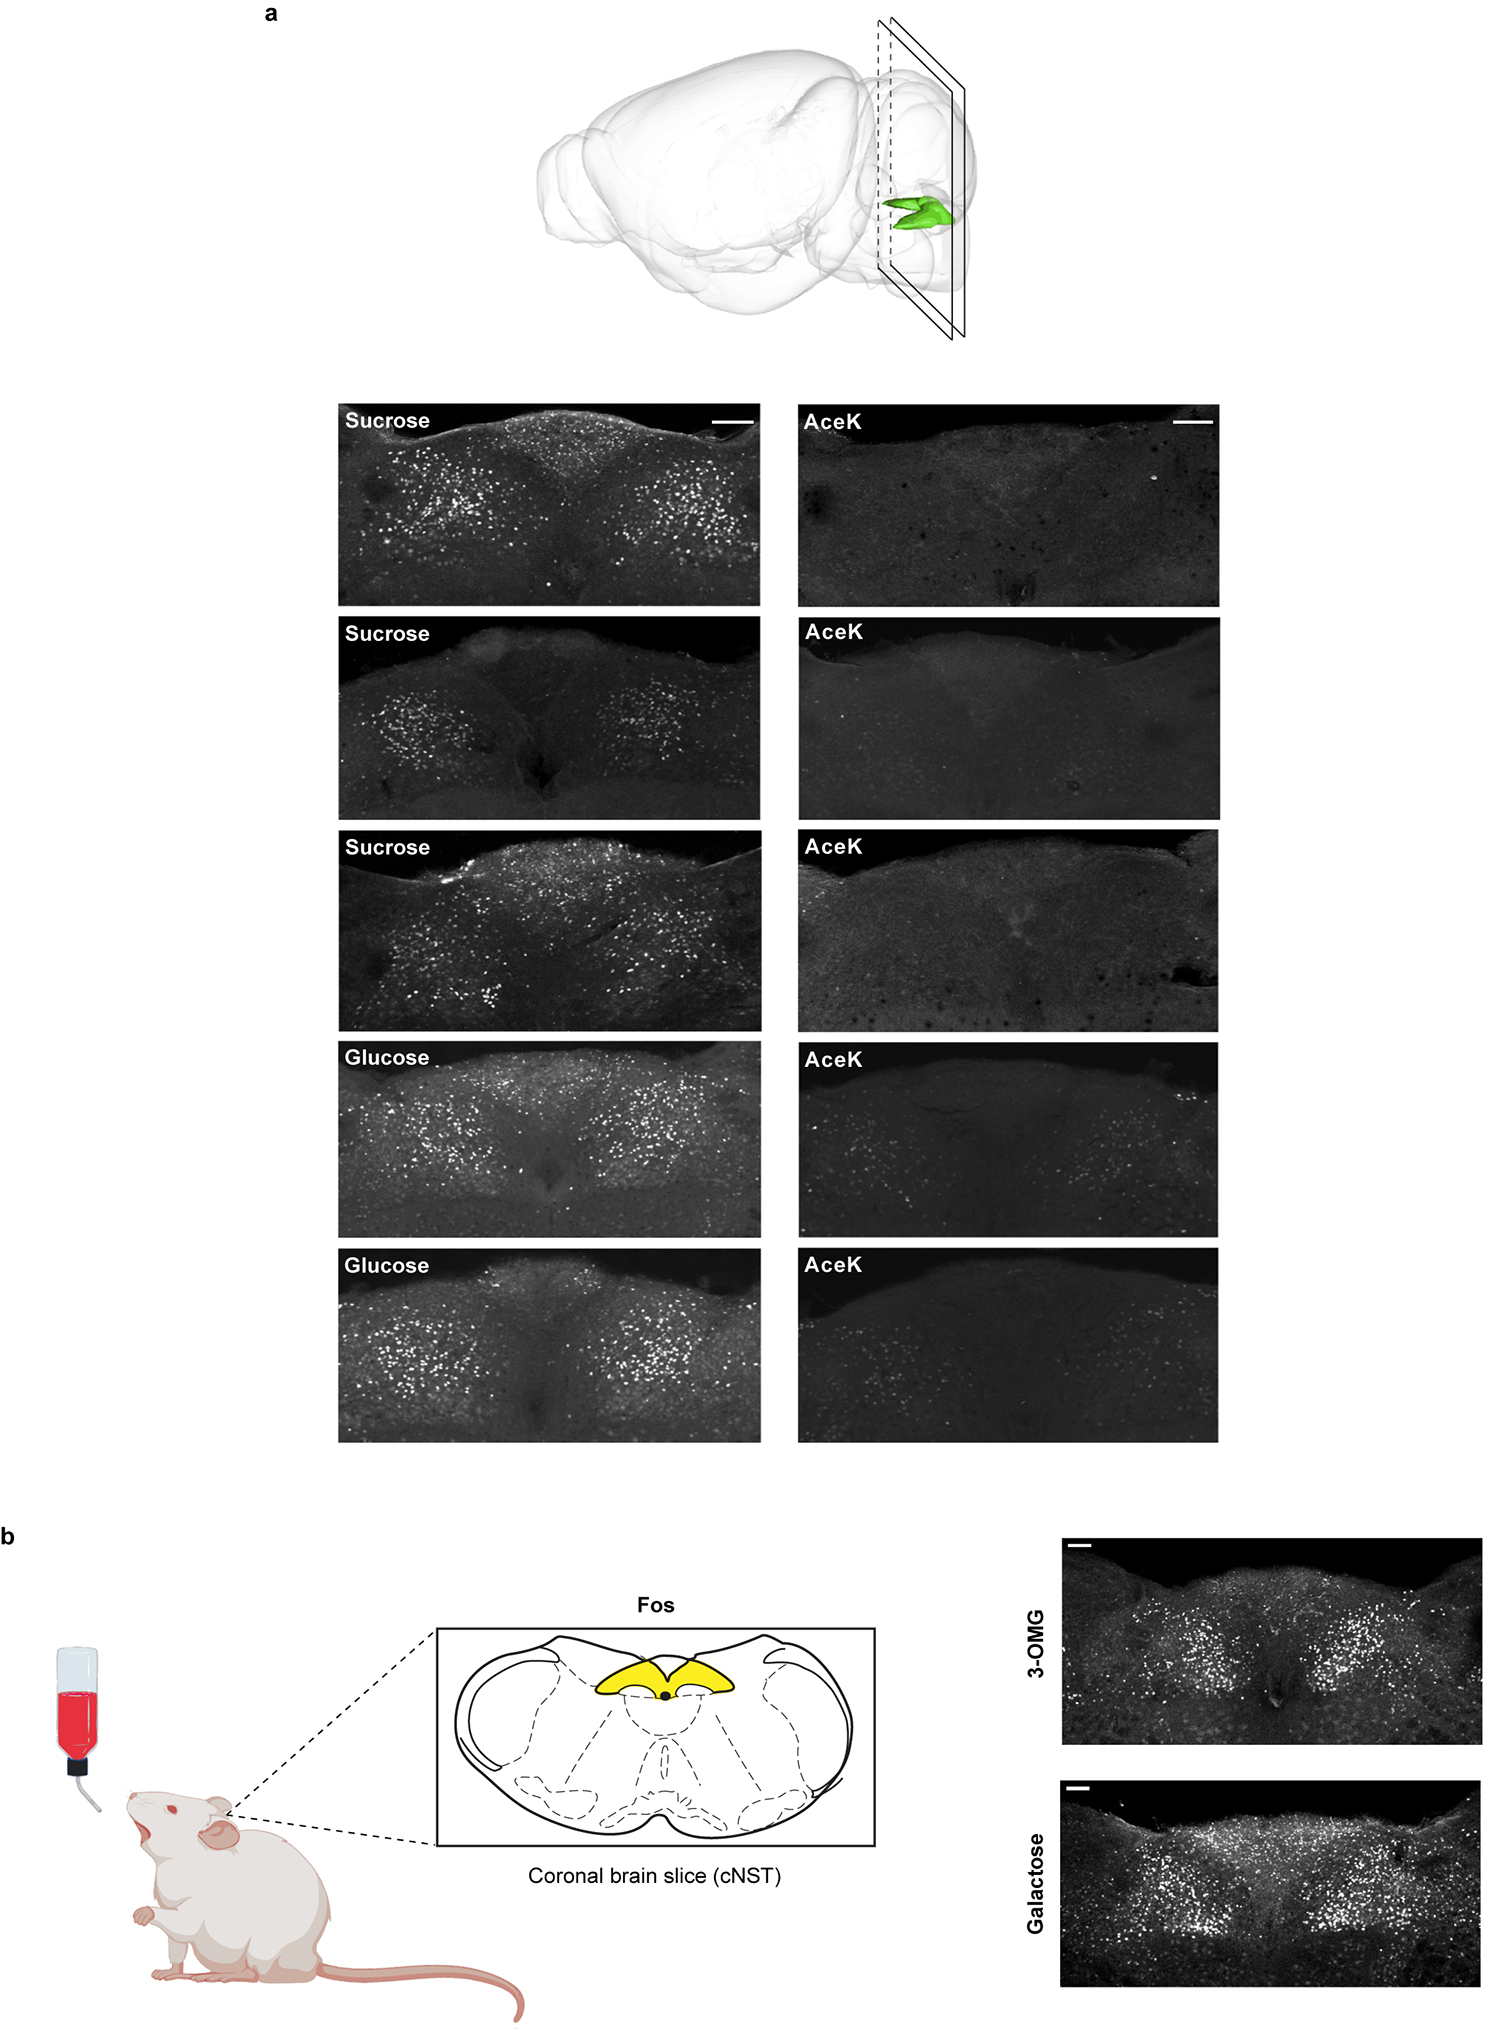
a, The brain diagram illustrates the position of the NST and the plane of the sectioning. Shown are cNST sections stained with Fos antibodies after exposing the animals to 90 min of 600 mM sucrose, 600 mM glucose or 30 mM AceK. Each panel is a confocal maximal projection image from Bregma −7.5 mm consisting of 3 sections 15 μm apart. Each panel (sucrose, glucose or AceK) represents a different animal, n = 3 independent experiments. Note the robustness of the signals across animals. See Methods for details. b, Mice were stimulated with 600 mM 3-O-Methyl-D-glucopyranose (3-OMG) (n = 6 animals) or 600 mM galactose (n = 3 animals) (see also Fig. 4 and Extended Data Fig. 10). Note strong Fos signals in cNST neurons, n = 2 independent experiments (total of 9 mice). Scale bars, 100 μm.
Extended Data Figure 3: The development of sugar preference.
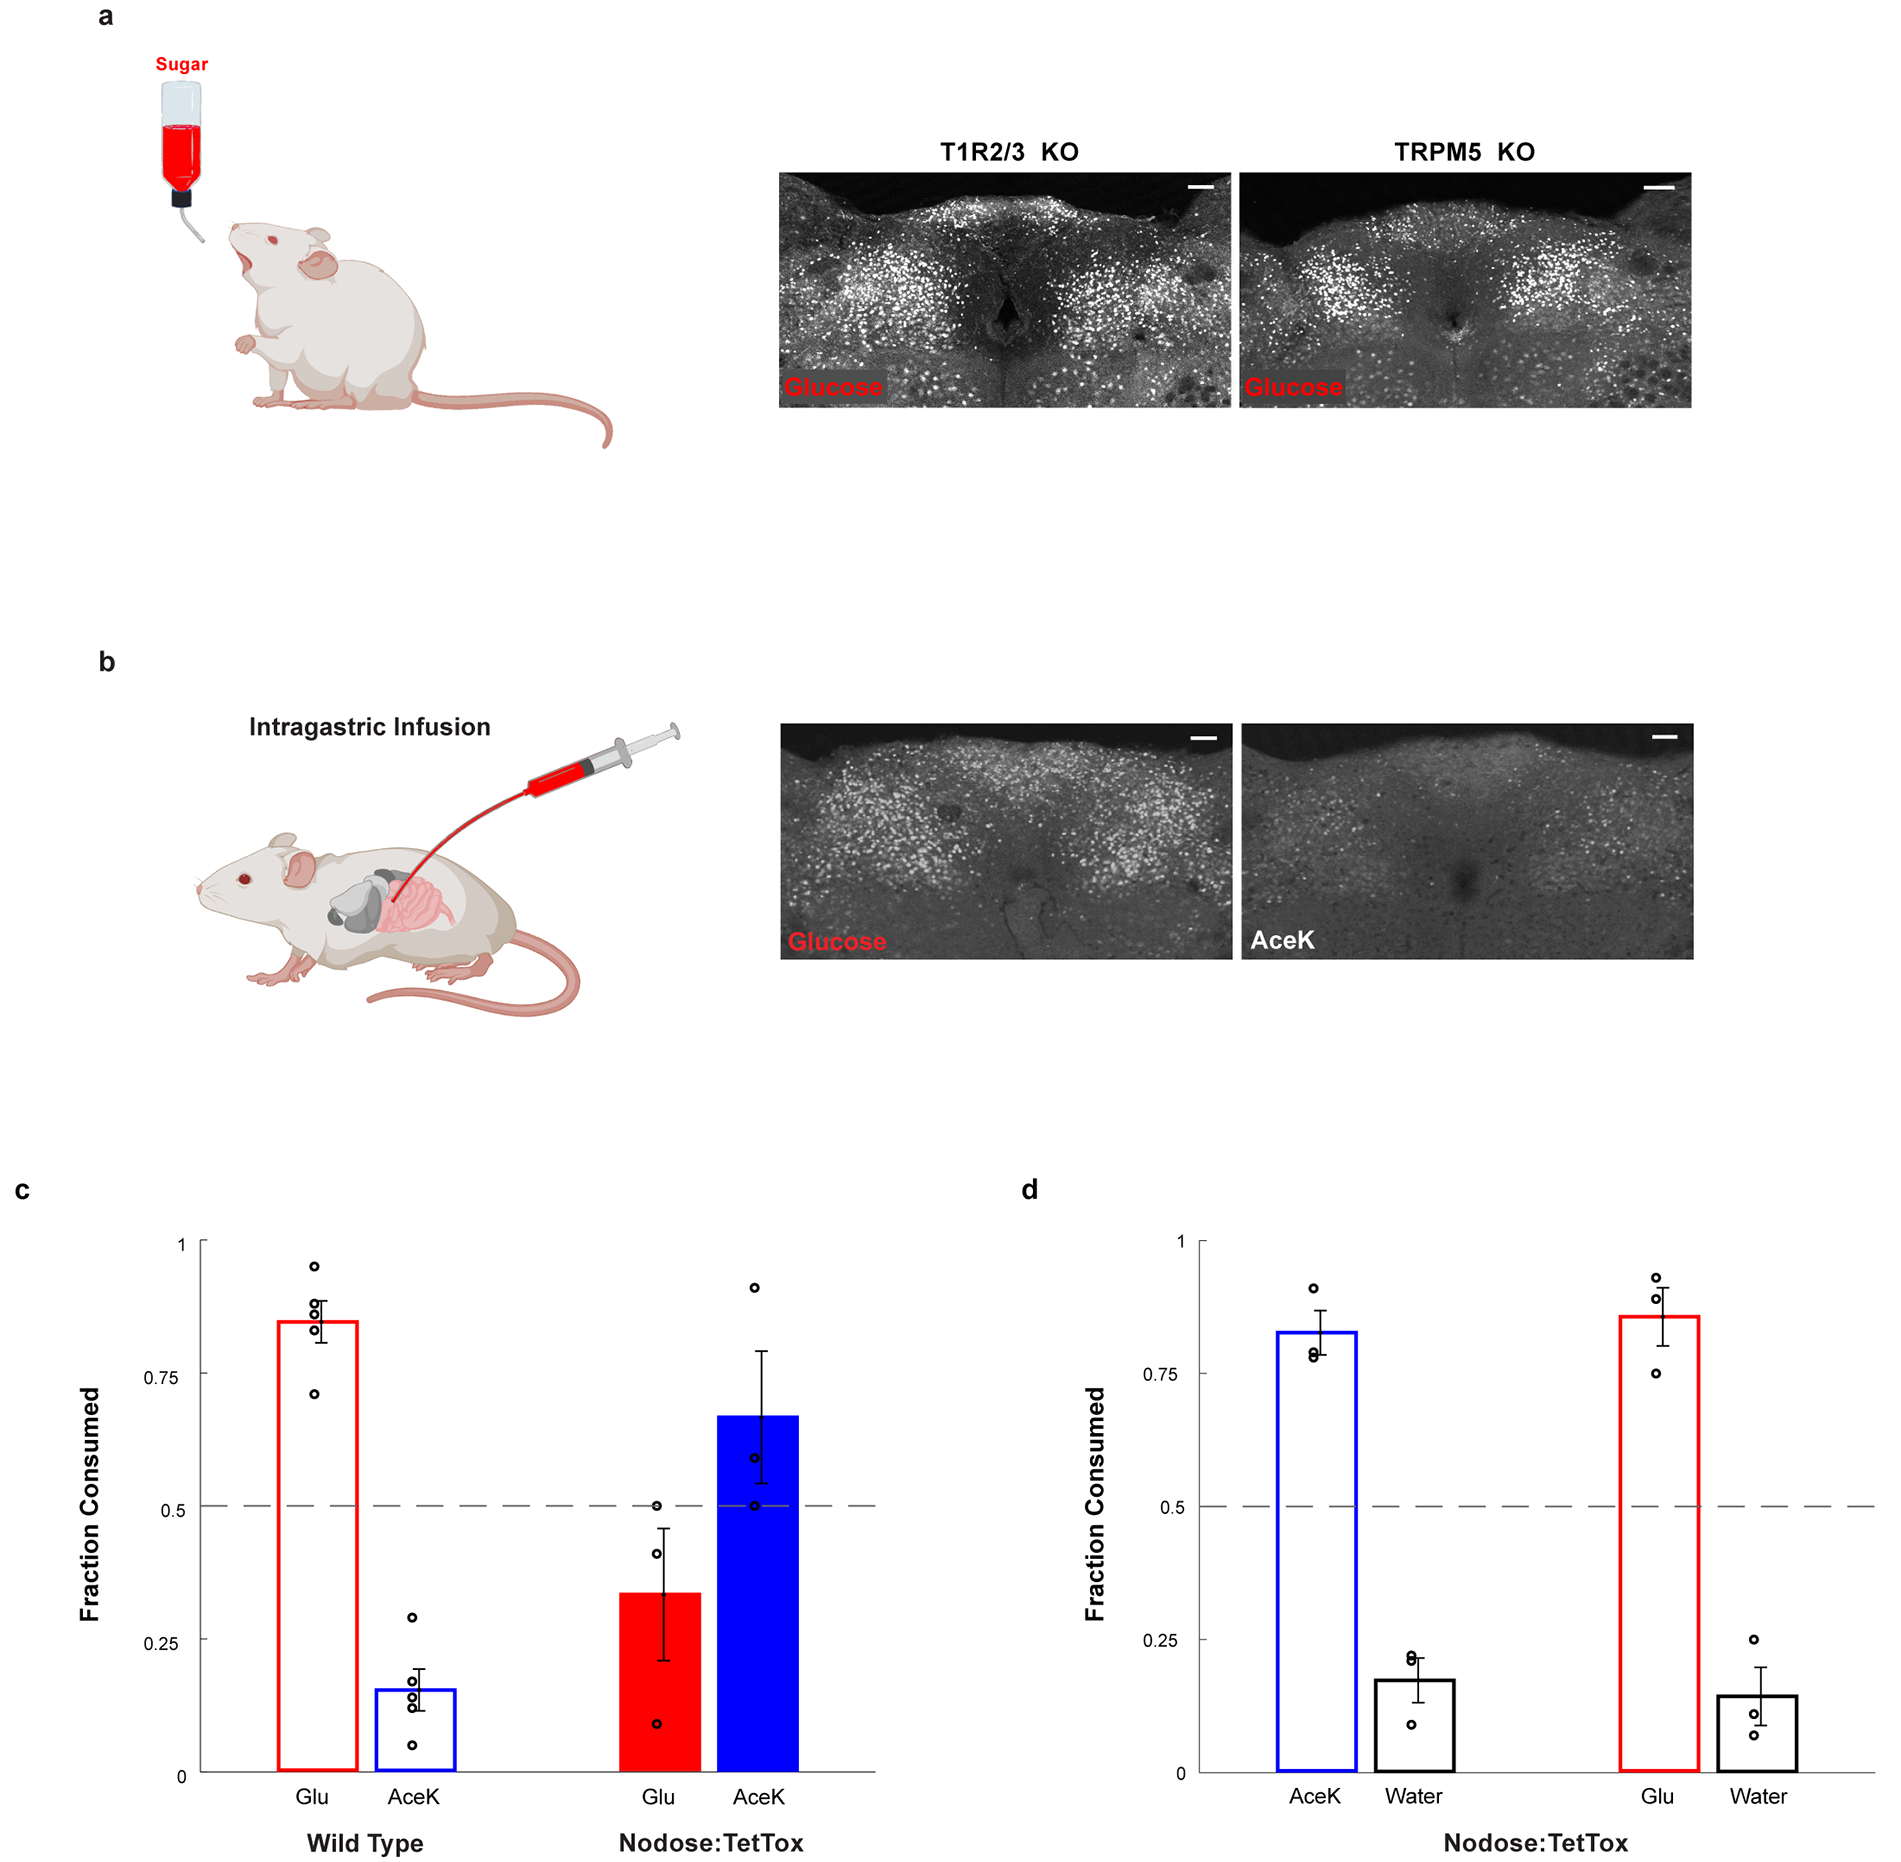
a, Glucose stimulates cNST neurons in animals lacking the sweet taste receptor (T1R2/T1R3−/−), or in animals lacking the TRPM5 ion channel (TRPM5−/−). See Fig. 1e for quantitation: T1R2/T1R3−/−, n = 5 mice, ANOVA followed by Tukey’s HSD post hoc test, p < 0.0001; TRPM5−/−, n = 7 mice, ANOVA followed by Tukey’s HSD post hoc test, p < 0.0001. Values are mean ± s.e.m. Scale bar, 100 μm. b, Direct intragastric infusion of glucose, but not AceK, robustly activates the cNST. n = 2 independent experiments. Scale bar, 100 μm. c-d, Genetic silencing of vagal sensory neurons. c, Sugar-preference graphs for Wild Type mice (n = 5 mice), demonstrating the robust development of preference for sugar versus artificial sweetener (see also Fig. 1). In contrast, silencing of the sensory neurons in the nodose ganglia, by bilateral injection of AAV DIO-TetTox injections into the nodose ganglia of VGlut2-Cre animals (see Methods), abolishes the development of sugar preference; n = 3 animals, two-sided Mann-Whitney U-Test, p = 0.035. Values are mean ± s.e.m. d, However, silencing vagal sensory neurons does not impair the innate attraction to “sweet” solutions; shown are behavioural responses to AceK versus water, and glucose versus water (n = 3 animals, preference index for AceK = 0.82, preference index for glucose = 0.85). Values are mean ± s.e.m.
Extended Data Figure 4: Retrograde Labeling from cNST.
a, A fluorescent retrograde tracer (red RetroBeads, Lumafluor) was stereotaxically injected into the cNST to label its inputs. The nodose ganglia and dorsal root ganglia were checked for transfer of the fluorescent label after 6–7 days. The nodose ganglion (vagal neurons), but not the dorsal root ganglion (spinal neurons), was robustly labelled23, n = 2 independent experiments. b, RetroBeads were also injected into the Cuneate nucleus, a brainstem area near but distinct from the cNST. Vagal neurons were not labelled. In contrast, note robust labelling of spinal neurons (n = 2 independent experiments). DAPI nuclear counterstain is also shown (blue). Scale bars: 200 μm (Brainstem), 50 μm (Nodose, DRG). c, Validation of TRAPing procedure. To confirm that the sugar-activated cNST neurons marked by the expression of Fos are the same as the ones labelled by Cre-recombinase in the genetic TRAPing experiments. We genetically labelled the sugar-induced TRAPed neurons with a Cre-dependent fluorescent reporter24, and then performed a second cycle of sugar stimulation followed by Fos antibody labelling. d, Top row, neurons labelled by the Cre-dependent reporter after sugar TRAPing (‘Sugar-TRAP’, pseudo-coloured red) are the same as the ones labelled by Fos after a second cycle of sugar stimulation (‘Sugar-Fos’, marked in green; see Methods and text for details), >80% of Sugar-Fos are Sugar-TRAP (n = 7 animals); middle row, note that the few neurons labelled after Water-TRAP in response to water do not overlap with those labelled with Fos antibodies after sugar stimulation; bottom row, the sugar-TRAP neurons are also activated by the non-caloric sugar analogue MDG, >80% of MDG-Fos are Sugar-TRAP. Scale bar, 20 μm.
Extended Data Figure 5: Animals with the sugar-preference circuit silenced behave as normal mice drinking artificial sweeteners.
a, A normal, non-thirsty mouse drinks ~5ml of water during a 24 h window, n = 11 animals. Values are mean ± s.e.m. b, If presented with a “sweet” option (but not sugar, so as to not create a preference) they show a small but significant increase in total volume consumed, but now most of the total consumption is from the sweet choice rather than water (n = 9 animals, two-tailed paired t-test, p = 1 × 10⁻⁴). Values are mean ± s.e.m. c, In contrast, if the options are water versus sugar, so that it creates a preference, they massively increase total volume consumed, and nearly all is from the sugar solution (n = 9 animals, two-tailed paired t-test, p = 3 × 10⁻¹⁰). Values are mean ± s.e.m. d, As expected, wild type controls develop strong preference for sugar versus AceK (n = 9 animals, two-tailed paired t-test, p = 3 × 10⁻⁸). Values are mean ± s.e.m. e-f, Animals with the preference circuit silenced now behave as control animals presented with a sweet, non-preference creating choice (compare panels e-f to panel b) (n = 6 animals, two-tailed paired t-test, p = 6 × 10⁻⁴ for AceK, p = 4 × 10⁻³ for glucose). Values are mean ± s.e.m. g, Silenced animals consumed nearly equal volumes of sugar and artificial sweetener (n = 6 animals, two-tailed paired t-test, p = 0.1). Values are mean ± s.e.m.
Extended Data Figure 6: Vagal neuron responses to sugar and MDG are highly reproducible and timed-locked to the stimulus.
a, Shown are vagal neuron responses to 6 consecutive 10 s intestinal stimuli of alternating trials with 500 mM glucose and 500 mM MDG (stimulus delivery and timings are as described in Methods). Each of the sample traces depict the response from a different neuron. b, Shown are vagal neuron responses to 5 consecutive 10 s intestinal stimuli with 500 mM glucose (stimulus delivery and timings are as described in Methods). Each of the sample traces depict the response from a different neuron. c, Expanded time scale of responses to the 10 s 500 mM glucose stimulus from 10 s before to 10 s after termination of the stimulus. The green dash lines indicate the initiation of the stimulus, and the blue dash lines denote termination of the 10 s stimulus. Shown in solid black are the calcium responses, and shown in red are exponential fits to the response latency and kinetics. Note responses time-locked to stimulus delivery; top 2 traces depict 2 cells from 2 different mice in response to glucose, and bottom 2 traces depict 2 cells from 2 different mice in response to MDG; latencies varied between 3–6 s, and were within the 10 s stimulation window. Some cells exhibited longer latencies (see for example heat maps in Fig. 4 and Extended Data Fig. 8). We believe the cells with longer response “latencies” may represent intestinal glucose responders located farther down the intestinal segment, and thus would be expected to demonstrate longer latencies25. d, On the average, approximately 5% of vagal neurons respond reliably to a 10s 500 mM glucose stimulus. The histogram shows the percentage of GCaMP-expressing vagal neurons responding to the 10s glucose stimulus Average= 4.6 ± 0.05% (n= 4803 neurons from 51 ganglia, mean ± s.e.m.). e, Recent findings26 have suggested that appetitive behavioural responses are elicited through stimulation of vagal terminals originating from the right nodose ganglion. Shown are heat maps depicting z-score normalized average calcium responses of individual ganglion neurons after a 60 s pulse of 500 mM glucose. We observe no differences in responses to intestinal glucose from either the left or right vagal ganglia. Also shown are example traces from different neurons from the left and right Nodose ganglion; red bars indicate the 60 s stimulus; scale bars indicate % maximal response.
Extended Data Figure 7: Vagal neurons innervating duodenal segment sense sugar.
a, Schematic of retrograde tracing experiment. Fluorescently-conjugated cholera toxin subunit B (CTB)27 was injected into the proximal duodenum to back fill, and label, the cell bodies of duodenum-projecting vagal neurons (z-projection of n = 22 confocal planes from a representative ganglion, see Methods for details). The two panels below show a sample retrogradely labelled ganglion with sensory neurons (VGlut2-Cre driving the GCaMP reporter) marked in green (left) and those labelled by CTB marked by red fluorescence (right). Double-positive neurons are highlighted by the white circles. Scale bar, 100 μm. b, Representative field of a vagal imaging session showing the overlay of CTB and GCaMP. The 2 yellow circled neurons (denoted as #1 and #2) were labelled by retrogradely applied CTB in the duodenal segment, and exhibited strong responses to glucose (n = 16 ganglia from 10 mice). Scale bar, 100 μm. c, A total of 12/55 double-positive neurons responded to the 10 s glucose stimulus (see Extended Data Fig. 6d for a comparison with un-injected animals); n = 16 ganglia from 10 mice. Note the substantial enrichment in the number of responders when pre-tagged by retrograde labelling: ~20% in the duodenal tagged vs 4–5% in the whole population.
Extended Data Figure 8: Glucose responders are not sensing osmolarity.
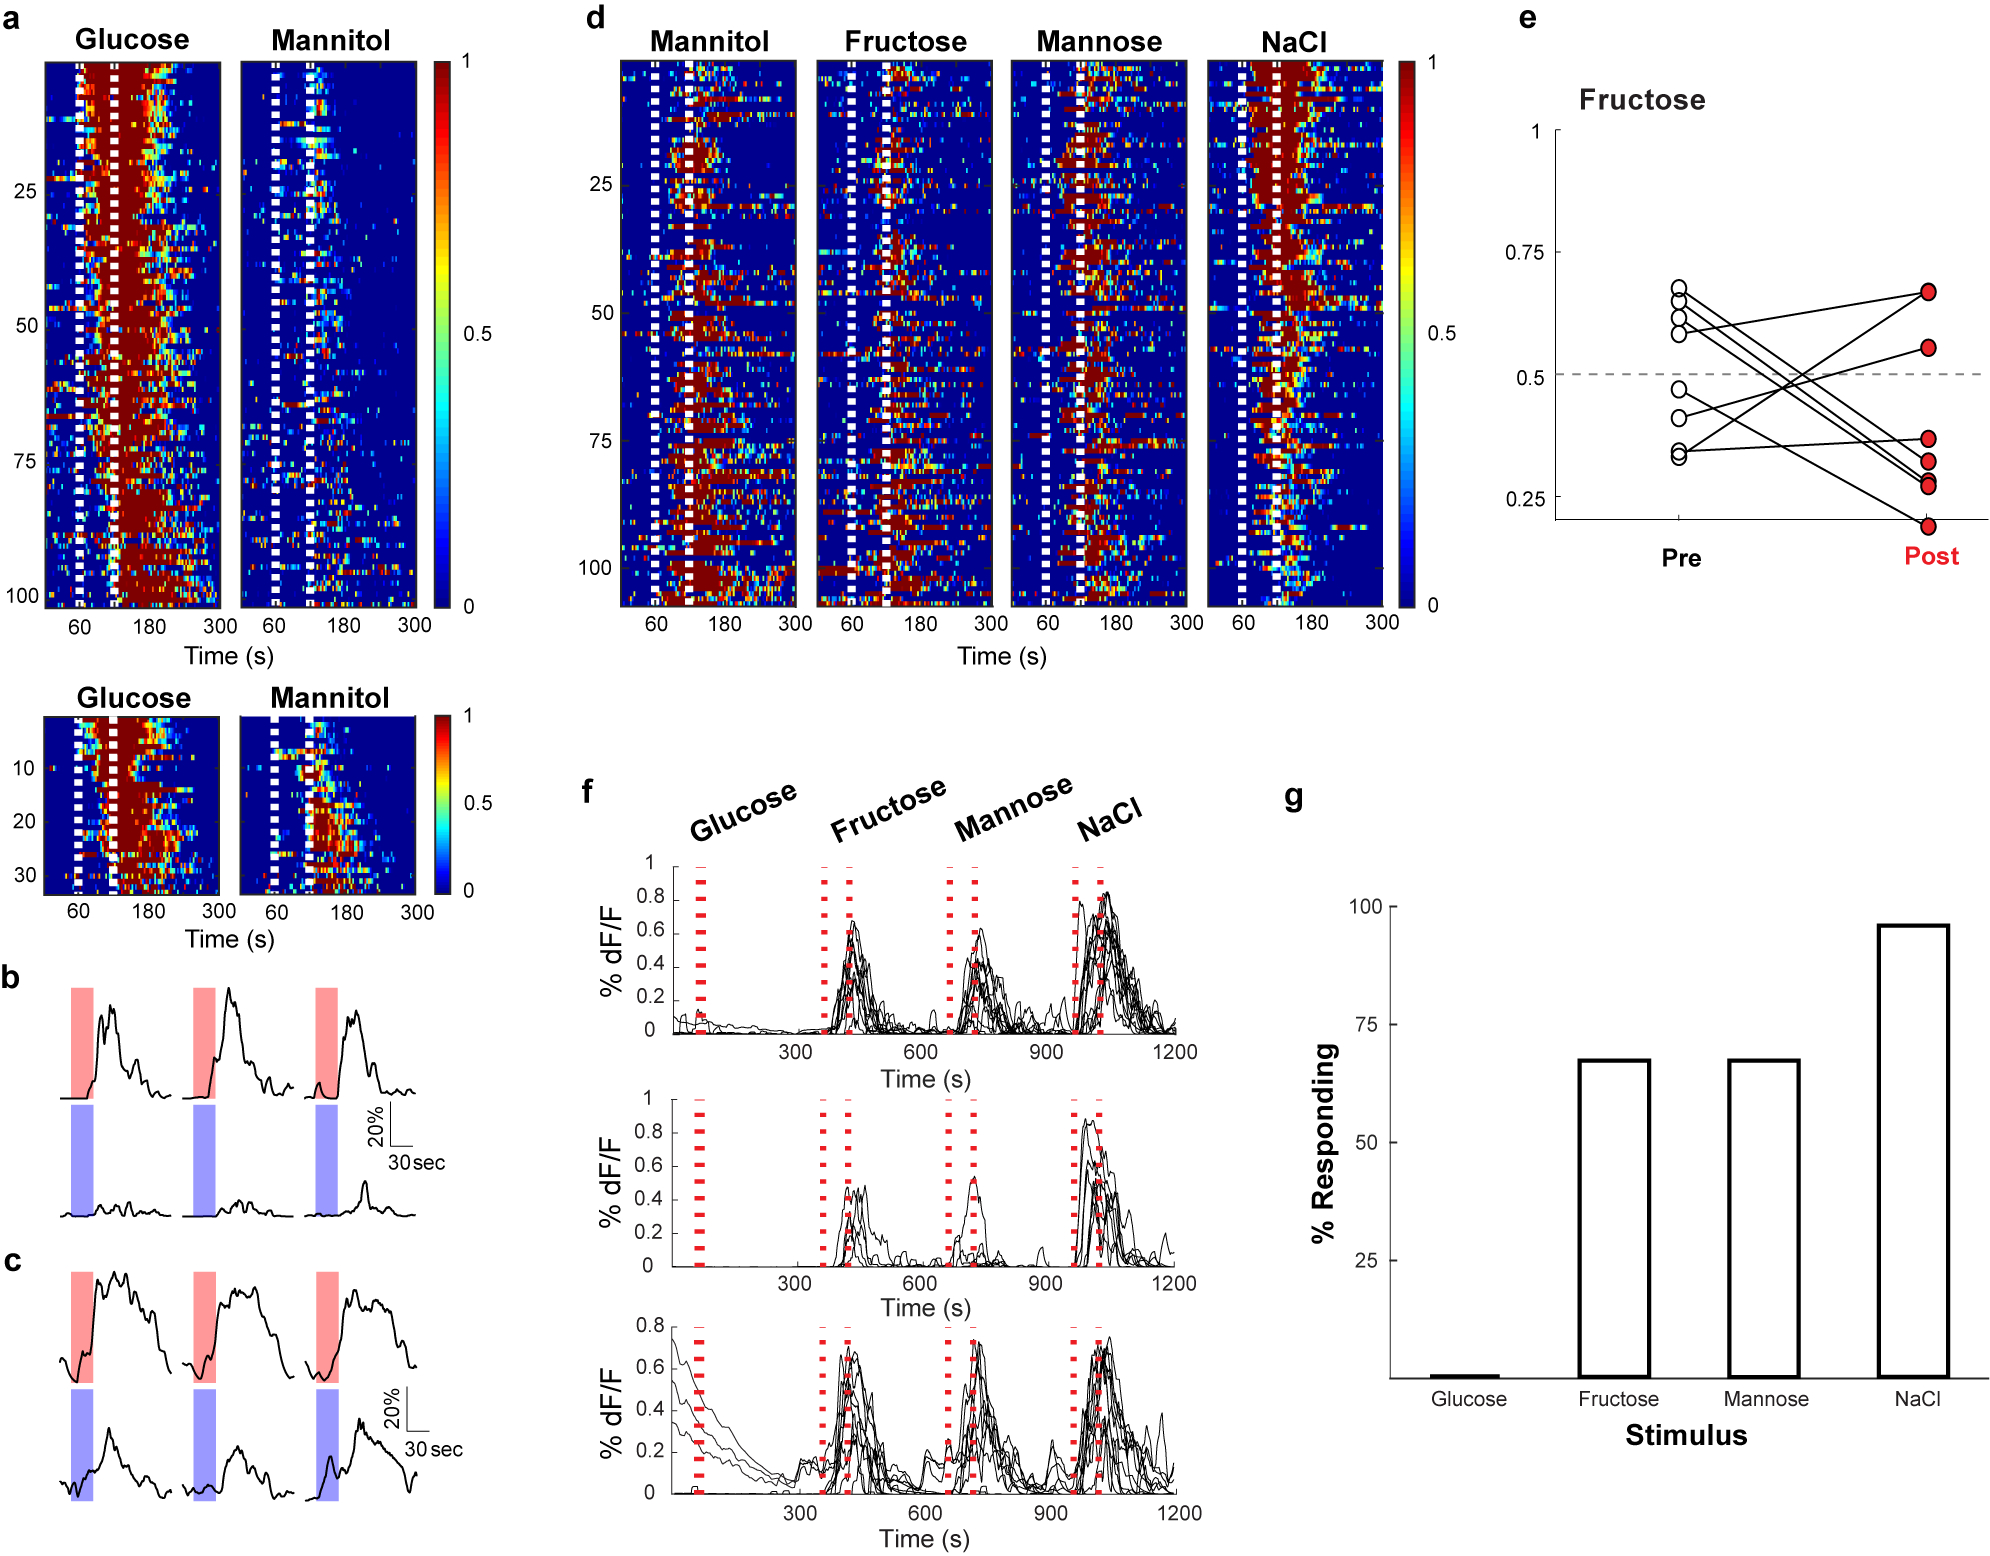
Recently, Williams et al. (2016)28 identified vagal neurons that indiscriminately responded to high concentrations of several stimuli delivered in very large stimulus volume for hundreds of seconds. We believe these responses, largely independent of the quality of the stimulus, are intestinal osmolarity signals. a, Shown are heat maps summarizing responses to interleaved 60s stimuli of 500 mM glucose and 500 mM mannitol. Each row represents the average activity of a single cell during 3 interspersed exposures to the stimulus. Stimulus window is indicated by the dashed white lines. Of 134 neurons that responded to intestinal application of 500 mM glucose for 60 s, 101 did not exhibit statistically significant responses to mannitol (upper panel). However, 33 (~25%) showed responses to both 500 mM glucose and 500 mM mannitol (lower panel). N = 5 mice. When the intestinal stimulus consisted of a short pulse (i.e. 10 s; 33 μl volume) no responses were detected to 500 mM mannitol (data not shown). b, Sample traces (3 trials each) of a neuron responding to glucose (red) but not mannitol (blue). c, Sample traces (3 trials each) of a neuron responding to glucose and mannitol. Scale bars indicate % maximal response. d, Heat maps showing responses to a 60s stimuli of 1 M mannitol, 1 M fructose, 1 M mannose, and 1 M NaCl. Note that the same cells respond indiscriminately to the various stimulus (n = 4 mice). e, The graph shows preference plots for Fructose versus AceK (n = 8 mice, two-tailed paired t-test, p = 0.27). Note that Fructose, a caloric sugar, does not create preference, but activates osmolarity responses. f, Williams et al. (2016)28 suggested GPR65-expressing vagal neurons function as the nutrient sensors. We generated mice where GCaMP6s expression was targeted to GPR65-expressing vagal neurons, and examined their responses to a 10s stimulus of 500 mM glucose or osmolarity signals (i.e. 1 M each of fructose, mannose, and NaCl for 60 s). Shown are normalized responses of from 3 different mice to the 4 stimuli; each trace represents a different responding neuron. Note that 500 mM glucose for 10 s does not activate GPR65 neurons. In contrast, they are activated by 60 s 1 M fructose, mannose and NaCl (see also Figure 4). g, Summary histogram of GPR65 tuning profile to 10s 500 mM glucose, and 60s 1 M fructose, 60s 1 M mannose, and 60s 1 M NaCl; n = 4 mice.
Extended Data Figure 9: Genetic silencing of GPR65 neurons does not affect the development of sugar preference.
a, Global silencing of the GPR65 neurons was achieved by generating GPR65-IRES-Cre; R26-TeNT double transgenic animals expressing TetTox in GPR65 neurons. Sugar-preference graphs demonstrating the robust development of preference for sugar versus artificial sweetener for both Wild Type (n = 5 mice, two-tailed paired t-test, p = 0.0047) and GPR65:TetTox mice (n = 5 mice, two-tailed paired t-test, p = 0.0033). The Wild Type controls shown here are the same animals used in Extended Data Fig. 3c as both sets of silencing experiments were carried out as part of the same series of studies. Values are mean ± s.e.m. b, Silencing of GPR65 neurons does not impair the innate attraction to sweet solutions. Shown are behavioural responses to AceK versus water and glucose versus water (n = 5, two-tailed paired t-test, p = 0.0040 for consumed volumes of AceK vs water, p = 0.0023 for consumed volumes of glucose vs water). Values are mean ± s.e.m.
Extended Data Figure 10: Vagal neurons responding to intestinal glucose are also activated by SGLT-1 agonists.
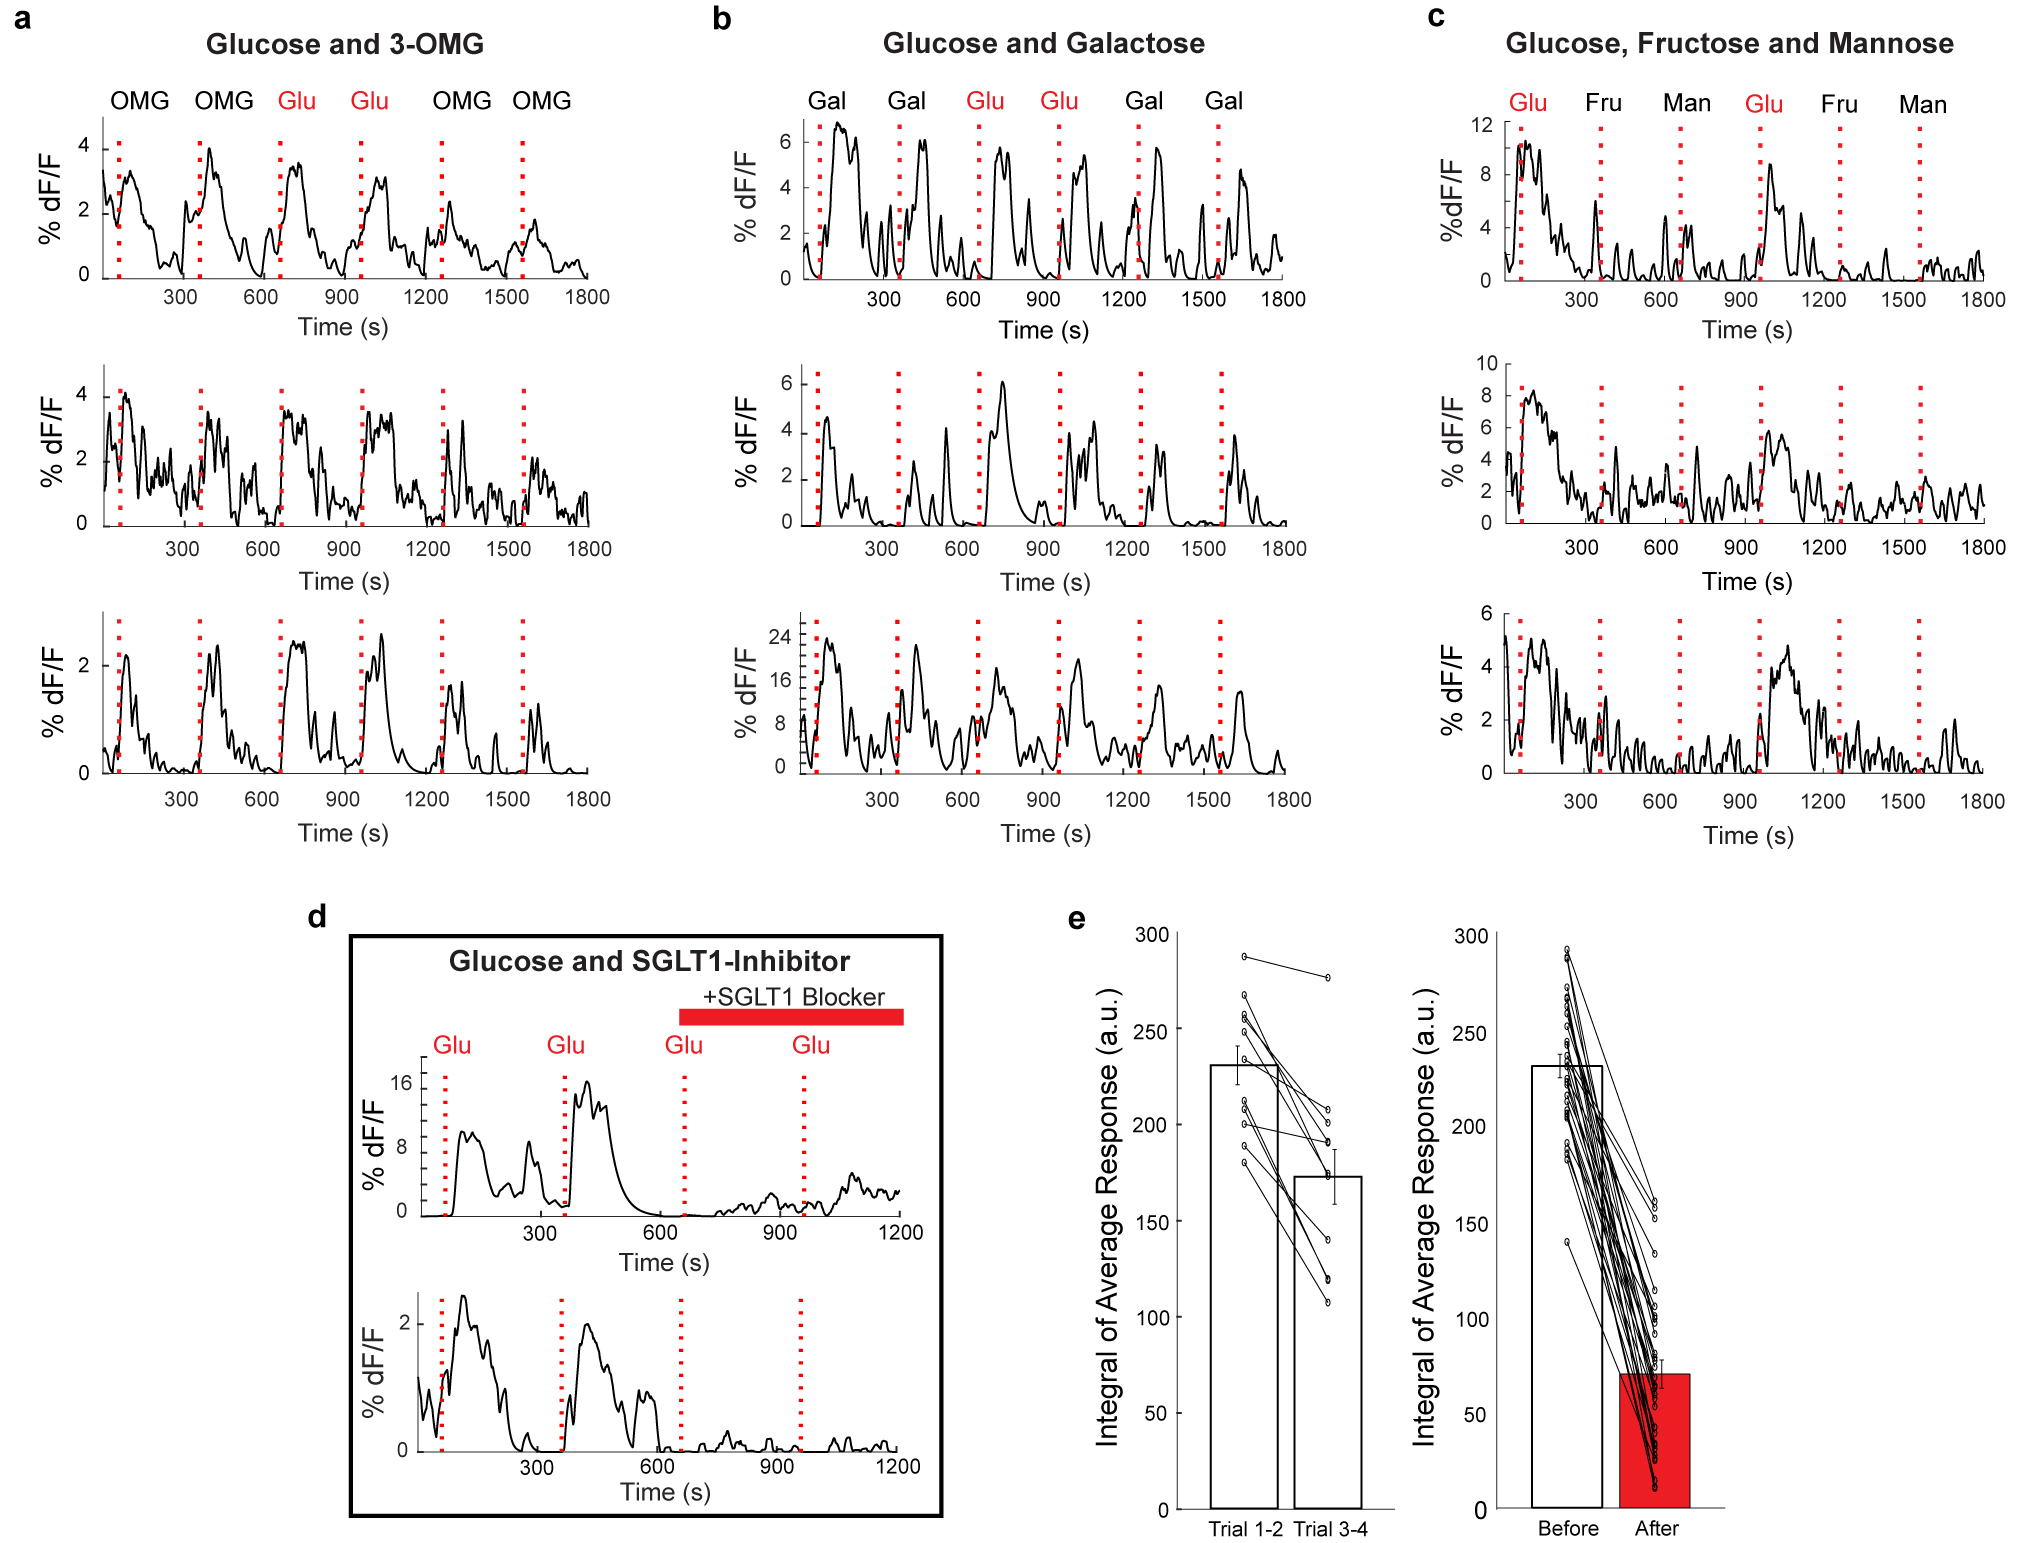
a, Traces of vagal neurons responding to a 10 s pulse of 500 mM intestinal glucose, also challenged with a 10 s pulse of 500 mM 3-OMG. Shown are sample neurons from 2 animals. b, Traces of vagal neurons responding to a 10 s pulse of 500 mM intestinal glucose, also challenged with a 10 s pulse of 500 mM galactose. Shown are sample neurons from 2 animals. c, Traces of vagal neurons responding to a 10 s pulse of 500 mM intestinal glucose, also challenged with a 10s pulse of 500 mM fructose and 500 mM mannose. Shown are sample neurons from 3 mice. d, Traces of vagal neurons responding to two consecutive 10 s pulses of 500 mM intestinal glucose, before and after treating the intestinal segment with 8 mM Phlorizin for 5 min. Note the loss of responses. e, Because responses, in general, show some decay during the time of the experiment (in part due to desensitizing and bleaching of the fluorescent signals), we also analysed the average decay of corresponding glucose responses in the absence of any blocker. The graphs compare the loss of responses during normal decay, and in response to the blocker. For normal decay (left), n = 11 neurons, Pre = 230.8 a.u., Post = 172.8 a.u.; for blocker (right), n = 31 neurons, Pre = 229.7 a.u., Post = 67.0 a.u. All values are mean ± s.e.m. Scale indicates average integral of the responses to the two trials before and after inhibition (a.u. = arbitrary units).
Supplementary Material
Acknowledgements
We thank Nick Ryba for experimental suggestions and helpful comments, and Robert Barretto for advice on the calcium imaging pipeline. We particularly thank Liqun Luo (Stanford University) for the generous gift of TRAP animals, Stephen Liberles (Harvard University) for kindly providing GPR65-Cre animals, Peer Wulff (University of Aberdeen) for the kind gift of the Tetanus toxin construct, Alicja Skowronski and Charles Leduc for their assistance performing blood glucose and insulin measurements, Laura Rickman for expert help with figures, and Ryan Lessard for earlier contributions. We also thank members of the Zuker lab for helpful discussions, and an extraordinary group of undergraduate students from Columbia University that participated in various aspects of this work, Elizabeth Sobolik, Lily Hsin, Yameng Zhang, Adriana Holguin, Alexa Conomikes, Eelia Shaw, Brian McTyre, and Justine Li. Research reported in this publication was supported in part by the Russell Berrie Foundation program in the neurobiology of obesity (to C.S.Z and Rudy Leibel). A.S. was supported by the MSTP program, H-E.T. was supported by the Agency for Science, Technology and Research (A*STAR) of Singapore, and Y.G. was supported by a predoctoral fellowship from NRSA and the MSTP program. C.S.Z. is an investigator of the Howard Hughes Medical Institute and a Senior Fellow at Janelia Farm Research Campus. Figures were generated with the help of BioRender.
Footnotes
Competing Interests
C.S.Z. is a scientific co-founder and advisor of Kallyope.
References:
- 1.Sclafani A, Marambaud P & Ackroff K Conditioned flavor preferences in sweet ageusic T1r3 and Calhm1 knockout mice. Physiology & Behavior 126, 25–29 (2014). [DOI] [PMC free article] [PubMed] [Google Scholar]
- 2.de Araujo IE et al. Food Reward in the Absence of Taste Receptor Signaling. Neuron 57, 930–941 (2008). [DOI] [PubMed] [Google Scholar]
- 3.Yarmolinsky DA, Zuker CS & Ryba NJP Common Sense about Taste: From Mammals to Insects. Cell 139, 234–244 (2009). [DOI] [PMC free article] [PubMed] [Google Scholar]
- 4.Zuker CS Food for the brain. (2015). doi: 10.1016/j.cell.2015.03.016. [DOI] [PubMed] [Google Scholar]
- 5.Elliott Perry. & Elliott P. Production of sugar in the United States and foreign countries. (U.S. Dept. of Agriculture, 1917). [Google Scholar]
- 6.USDA Sugar and Sweeteners Yearbook Tables. https://www.ers.usda.gov/data-products/sugar-and-sweeteners-yearbook-tables/sugar-and-sweeteners-yearbook-tables/#U.S.%20Consumption%20of%20Caloric%20Sweeteners (2019).
- 7.Nelson G et al. Mammalian sweet taste receptors. Cell 106, 381–390 (2001). [DOI] [PubMed] [Google Scholar]
- 8.Spector AC & Travers SP The representation of taste quality in the mammalian nervous system. Behav Cogn Neurosci Rev 4, 143–191 (2005). [DOI] [PubMed] [Google Scholar]
- 9.Wang L et al. The coding of valence and identity in the mammalian taste system. Nature (2018) doi: 10.1038/s41586-018-0165-4. [DOI] [PMC free article] [PubMed] [Google Scholar]
- 10.Scott K Taste Recognition: Food for Thought. Neuron 48, 455–464 (2005). [DOI] [PubMed] [Google Scholar]
- 11.Peng Y et al. Sweet and bitter taste in the brain of awake behaving animals. Nature 1–12 (2015) doi: 10.1038/nature15763. [DOI] [PMC free article] [PubMed] [Google Scholar]
- 12.Wang Z, Singhvi A, Kong P & Scott K Taste Representations in the Drosophila Brain. Cell 117, 981–991 (2004). [DOI] [PubMed] [Google Scholar]
- 13.Sclafani A, Zukerman S & Ackroff K Postoral glucose sensing, not caloric content, determines sugar reward in C57BL/6J mice. Chem. Senses 40, 245–258 (2015). [DOI] [PMC free article] [PubMed] [Google Scholar]
- 14.Ren X et al. Nutrient Selection in the Absence of Taste Receptor Signaling. J Neurosci 30, 8012–8023 (2010). [DOI] [PMC free article] [PubMed] [Google Scholar]
- 15.Zhang Y et al. Coding of sweet, bitter, and umami tastes: Different receptor cells sharing similar signaling pathways. Cell (2003) doi: 10.1016/S0092-8674(03)00071-0. [DOI] [PubMed] [Google Scholar]
- 16.Pérez CA et al. A transient receptor potential channel expressed in taste receptor cells. Nature Neuroscience 5, 1169 (2002). [DOI] [PubMed] [Google Scholar]
- 17.Sclafani A Gut–brain nutrient signaling. Appetition vs. satiation. Appetite 71, 454–458 (2013). [DOI] [PMC free article] [PubMed] [Google Scholar]
- 18.Zukerman S, Ackroff K & Sclafani A Post-oral appetite stimulation by sugars and nonmetabolizable sugar analogs. Am J Physiol Regul Integr Comp Physiol 840–853 (2013) doi: 10.1152/ajpregu.00297.2013. [DOI] [PMC free article] [PubMed] [Google Scholar]
- 19.Wright EM, Loo DDF & Hirayama BA Biology of Human Sodium Glucose Transporters. Physiological Reviews 91, 733–794 (2011). [DOI] [PubMed] [Google Scholar]
- 20.Sheng M & Greenberg ME The regulation and function of c-fos and other immediate early genes in the nervous system. Neuron 4, (1990). [DOI] [PubMed] [Google Scholar]
- 21.Berthoud H-R & Neuhuber WL Functional and chemical anatomy of the afferent vagal system. Autonomic Neuroscience 85, 1–17 (2000). [DOI] [PubMed] [Google Scholar]
- 22.Sclafani A & Glendinning JI Flavor preferences conditioned in C57BL/6 mice by intragastric carbohydrate self-infusion. Physiology & Behavior 79, 783–788 (2003). [DOI] [PubMed] [Google Scholar]
- 23.Zukerman S, Ackroff K & Sclafani A Rapid post-oral stimulation of intake and flavor conditioning by glucose and fat in the mouse. Am J Physiol Regul Integr Comp Physiol 301, R1635–R1647 (2011). [DOI] [PMC free article] [PubMed] [Google Scholar]
- 24.Williams EK et al. Sensory Neurons that Detect Stretch and Nutrients in the Digestive System. Cell 166, 209–221 (2016). [DOI] [PMC free article] [PubMed] [Google Scholar]
- 25.Han W et al. A Neural Circuit for Gut-Induced Reward. Cell (2018) doi: 10.1016/j.cell.2018.08.049. [DOI] [PMC free article] [PubMed] [Google Scholar]
- 26.Kaelberer MM et al. A gut-brain neural circuit for nutrient sensory transduction. Science 5236, (2018). [DOI] [PMC free article] [PubMed] [Google Scholar]
- 27.Gunaydin LA et al. Natural Neural Projection Dynamics Underlying Social Behavior. Cell 157, 1535–1551 (2014). [DOI] [PMC free article] [PubMed] [Google Scholar]
- 28.Guenthner CJ, Miyamichi K, Yang HH, Heller HC & Luo L Permanent genetic access to transiently active neurons via TRAP: Targeted recombination in active populations. Neuron (2013) doi: 10.1016/j.neuron.2013.03.025. [DOI] [PMC free article] [PubMed] [Google Scholar]
- 29.Allen WE et al. Thirst-associated preoptic neurons encode an aversive motivational drive. Science (2017) doi: 10.1126/science.aan6747. [DOI] [PMC free article] [PubMed] [Google Scholar]
- 30.Callaway EM & Luo L Monosynaptic Circuit Tracing with Glycoprotein-Deleted Rabies Viruses. Journal of Neuroscience 35, 8979–8985 (2015). [DOI] [PMC free article] [PubMed] [Google Scholar]
- 31.Reardon TR et al. Rabies Virus CVS-N2cδG Strain Enhances Retrograde Synaptic Transfer and Neuronal Viability. Neuron (2016) doi: 10.1016/j.neuron.2016.01.004. [DOI] [PMC free article] [PubMed] [Google Scholar]
- 32.Yamamoto M et al. Reversible Suppression of Glutamatergic Neurotransmission of Cerebellar Granule Cells In Vivo by Genetically Manipulated Expression of Tetanus Neurotoxin Light Chain. J. Neurosci 23, 6759–6767 (2003). [DOI] [PMC free article] [PubMed] [Google Scholar]
- 33.Chen TW et al. Ultrasensitive fluorescent proteins for imaging neuronal activity. Nature (2013) doi: 10.1038/nature12354. [DOI] [PMC free article] [PubMed] [Google Scholar]
- 34.Chang RB et al. Vagal Sensory Neuron Subtypes that Differentially Control Breathing. Cell 161, 622–633 (2015). [DOI] [PMC free article] [PubMed] [Google Scholar]
- 35.Lee H, Macpherson LJ, Parada CA, Zuker CS & Ryba NJP Rewiring the taste system. Nature 548, 330–333 (2017). [DOI] [PMC free article] [PubMed] [Google Scholar]
- 36.Barretto RPJ et al. The neural representation of taste quality at the periphery. Nature (2015) doi: 10.1038/nature13873. [DOI] [PMC free article] [PubMed] [Google Scholar]
- 37.Mei N Vagal glucoreceptors in the small intestine of the cat. J Physiol 282, 485–506 (1978). [DOI] [PMC free article] [PubMed] [Google Scholar]
- 38.Conte WL, Kamishina H & Reep RL The efficacy of the fluorescent conjugates of cholera toxin subunit B for multiple retrograde tract tracing in the central nervous system. Brain Struct Funct 213, 367–373 (2009). [DOI] [PubMed] [Google Scholar]
- 39.Dyer J, Salmon KSH, Zibrik L & Shirazi-Beechey SP Expression of sweet taste receptors of the T1R family in the intestinal tract and enteroendocrine cells. Biochemical Society Transactions 33, 302–305 (2005). [DOI] [PubMed] [Google Scholar]
- 40.Geillinger KE et al. The Role of SGLT1 and GLUT2 in Intestinal Glucose Transport and Sensing. 9, 20–22 (2014). [DOI] [PMC free article] [PubMed] [Google Scholar]
- 41.Latorre R, Sternini C, Giorgio RD & Meerveld BG-V Enteroendocrine cells: a review of their role in brain–gut communication. Neurogastroenterology & Motility 28, 620–630 (2016). [DOI] [PMC free article] [PubMed] [Google Scholar]
- 42.Chambers AP, Sandoval DA & Seeley RJ Integration of Satiety Signals by the Central Nervous System. Current Biology 23, R379–R388 (2013). [DOI] [PMC free article] [PubMed] [Google Scholar]
- 43.Lein ES et al. Genome-wide atlas of gene expression in the adult mouse brain. Nature 445, 168–176 (2007). [DOI] [PubMed] [Google Scholar]
- 44.Armbruster BN, Li X, Pausch MH, Herlitze S & Roth BL Evolving the lock to fit the key to create a family of G protein-coupled receptors potently activated by an inert ligand. Proc Natl Acad Sci U S A 104, 5163–5168 (2007). [DOI] [PMC free article] [PubMed] [Google Scholar]
- 45.Gomez JL et al. Chemogenetics revealed: DREADD occupancy and activation via converted clozapine. Science 357, 503–507 (2017). [DOI] [PMC free article] [PubMed] [Google Scholar]
- 46.Vong L et al. Leptin Action on GABAergic Neurons Prevents Obesity and Reduces Inhibitory Tone to POMC Neurons. Neuron 71, 142–154 (2011). [DOI] [PMC free article] [PubMed] [Google Scholar]
- 47.Peron S, Chen T-W & Svoboda K Comprehensive imaging of cortical networks. Current Opinion in Neurobiology 32, 115–123 (2015). [DOI] [PubMed] [Google Scholar]
- 48.Daigle TL et al. A Suite of Transgenic Driver and Reporter Mouse Lines with Enhanced Brain-Cell-Type Targeting and Functionality. Cell 174, 465–480.e22 (2018). [DOI] [PMC free article] [PubMed] [Google Scholar]
Associated Data
This section collects any data citations, data availability statements, or supplementary materials included in this article.
Supplementary Materials
Data Availability Statement
All data supporting the findings of this study are available upon request.