
Extended Data Figure 5: Animals with the sugar-preference circuit silenced behave as normal mice drinking artificial sweeteners.
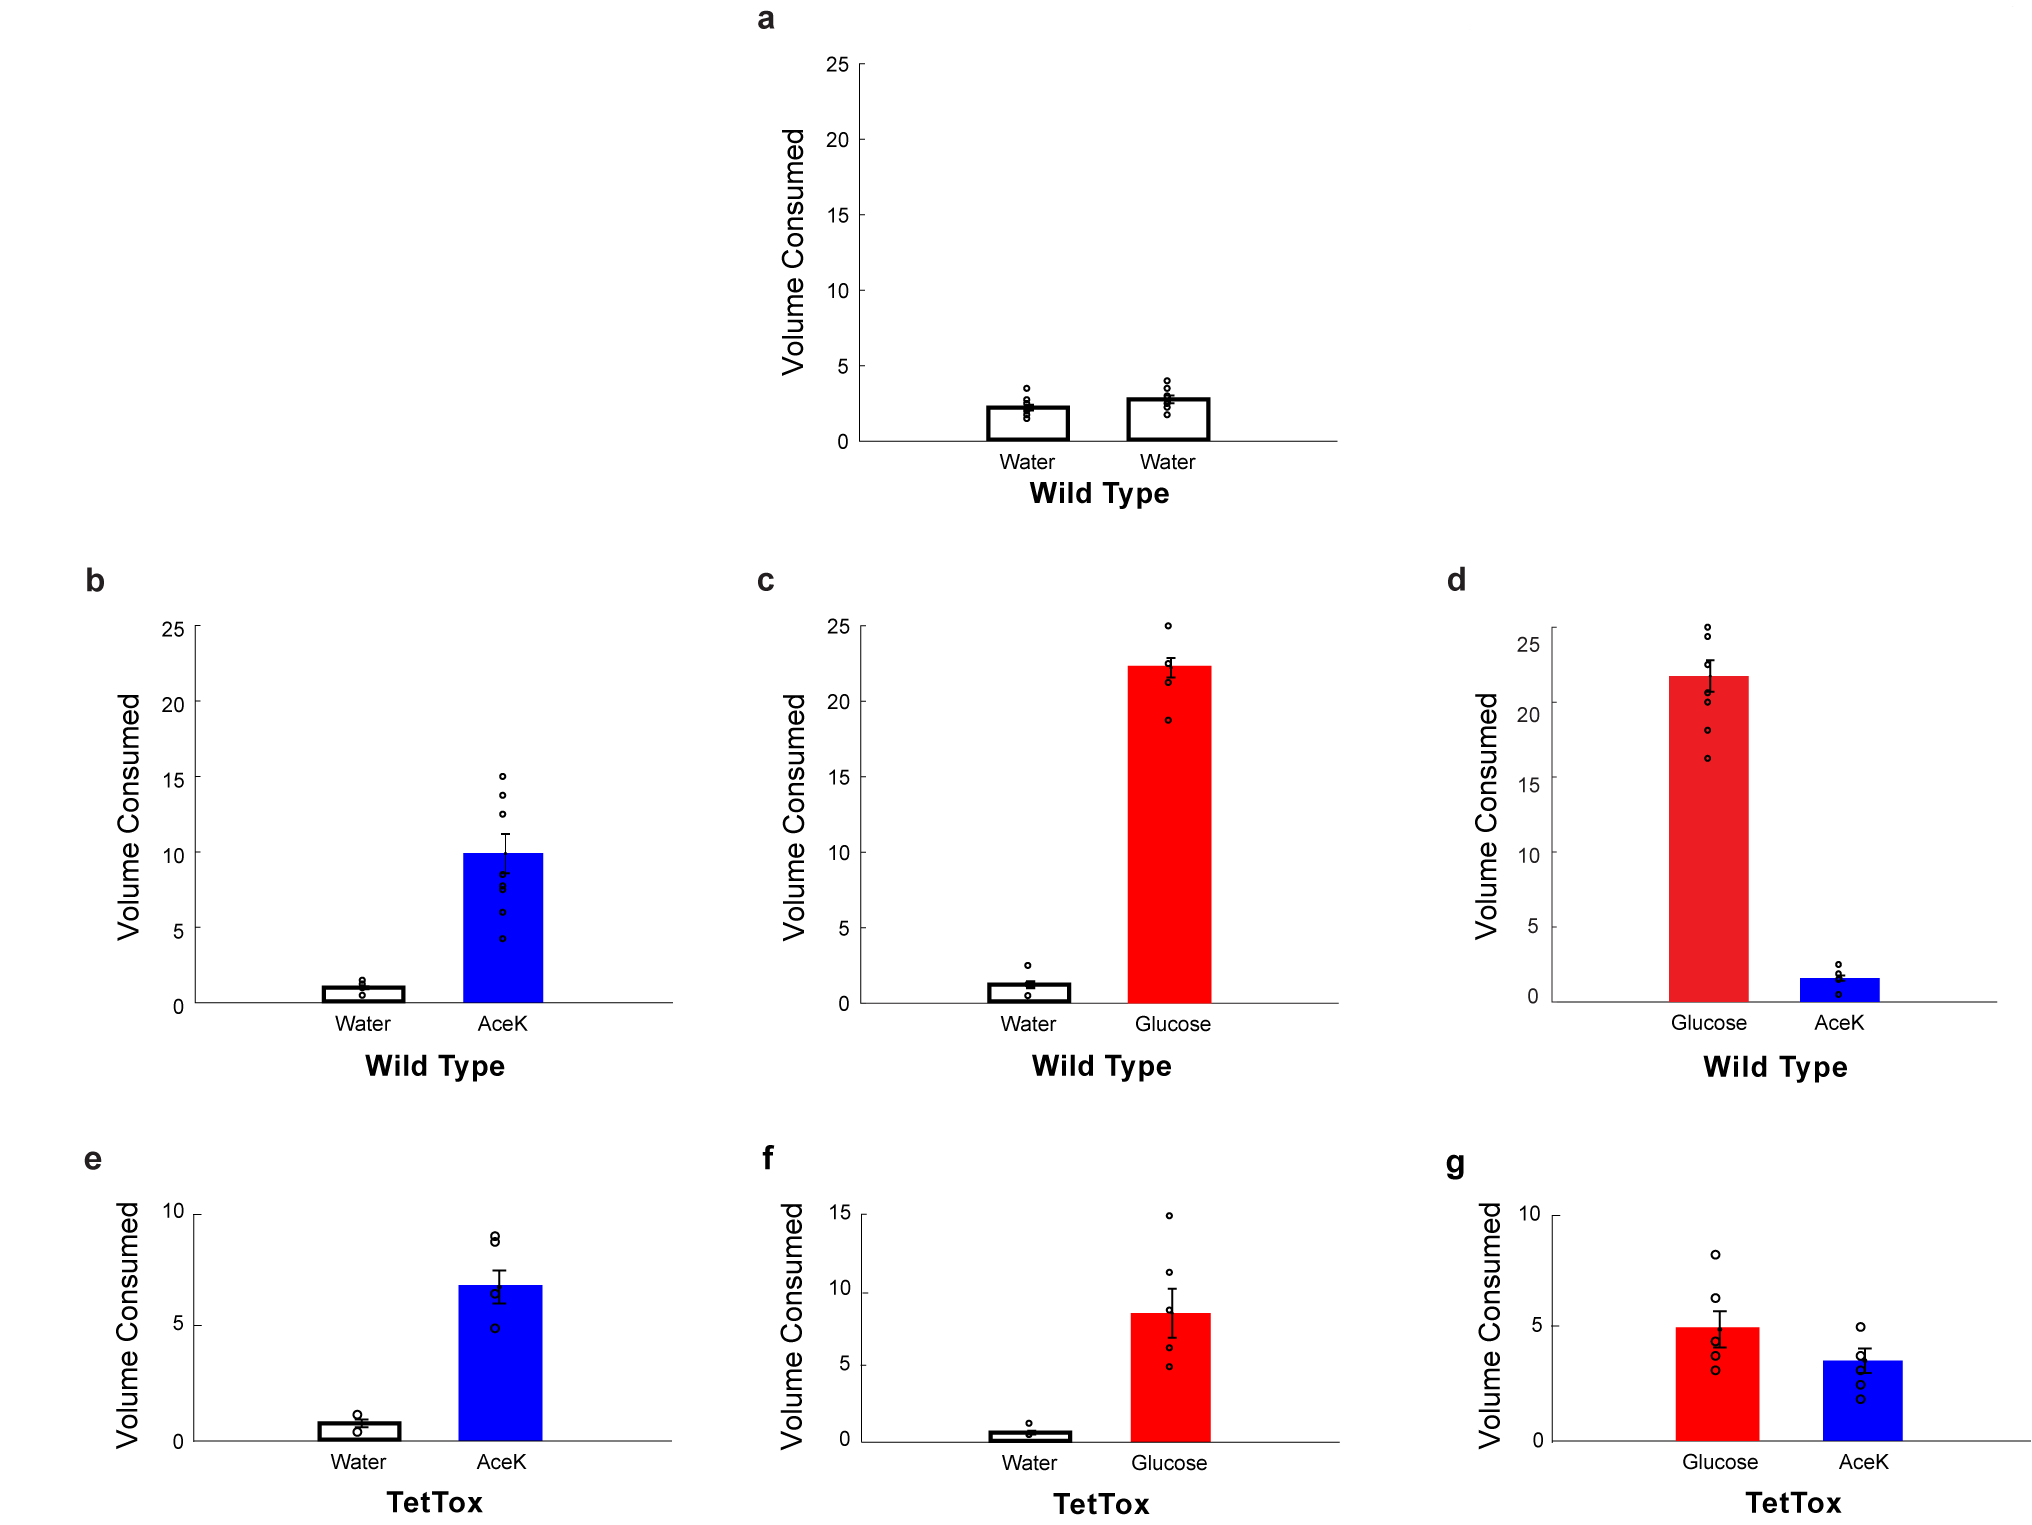
a, A normal, non-thirsty mouse drinks ~5ml of water during a 24 h window, n = 11 animals. Values are mean ± s.e.m. b, If presented with a “sweet” option (but not sugar, so as to not create a preference) they show a small but significant increase in total volume consumed, but now most of the total consumption is from the sweet choice rather than water (n = 9 animals, two-tailed paired t-test, p = 1 × 10⁻⁴). Values are mean ± s.e.m. c, In contrast, if the options are water versus sugar, so that it creates a preference, they massively increase total volume consumed, and nearly all is from the sugar solution (n = 9 animals, two-tailed paired t-test, p = 3 × 10⁻¹⁰). Values are mean ± s.e.m. d, As expected, wild type controls develop strong preference for sugar versus AceK (n = 9 animals, two-tailed paired t-test, p = 3 × 10⁻⁸). Values are mean ± s.e.m. e-f, Animals with the preference circuit silenced now behave as control animals presented with a sweet, non-preference creating choice (compare panels e-f to panel b) (n = 6 animals, two-tailed paired t-test, p = 6 × 10⁻⁴ for AceK, p = 4 × 10⁻³ for glucose). Values are mean ± s.e.m. g, Silenced animals consumed nearly equal volumes of sugar and artificial sweetener (n = 6 animals, two-tailed paired t-test, p = 0.1). Values are mean ± s.e.m.