
Extended Data Figure 10: Vagal neurons responding to intestinal glucose are also activated by SGLT-1 agonists.
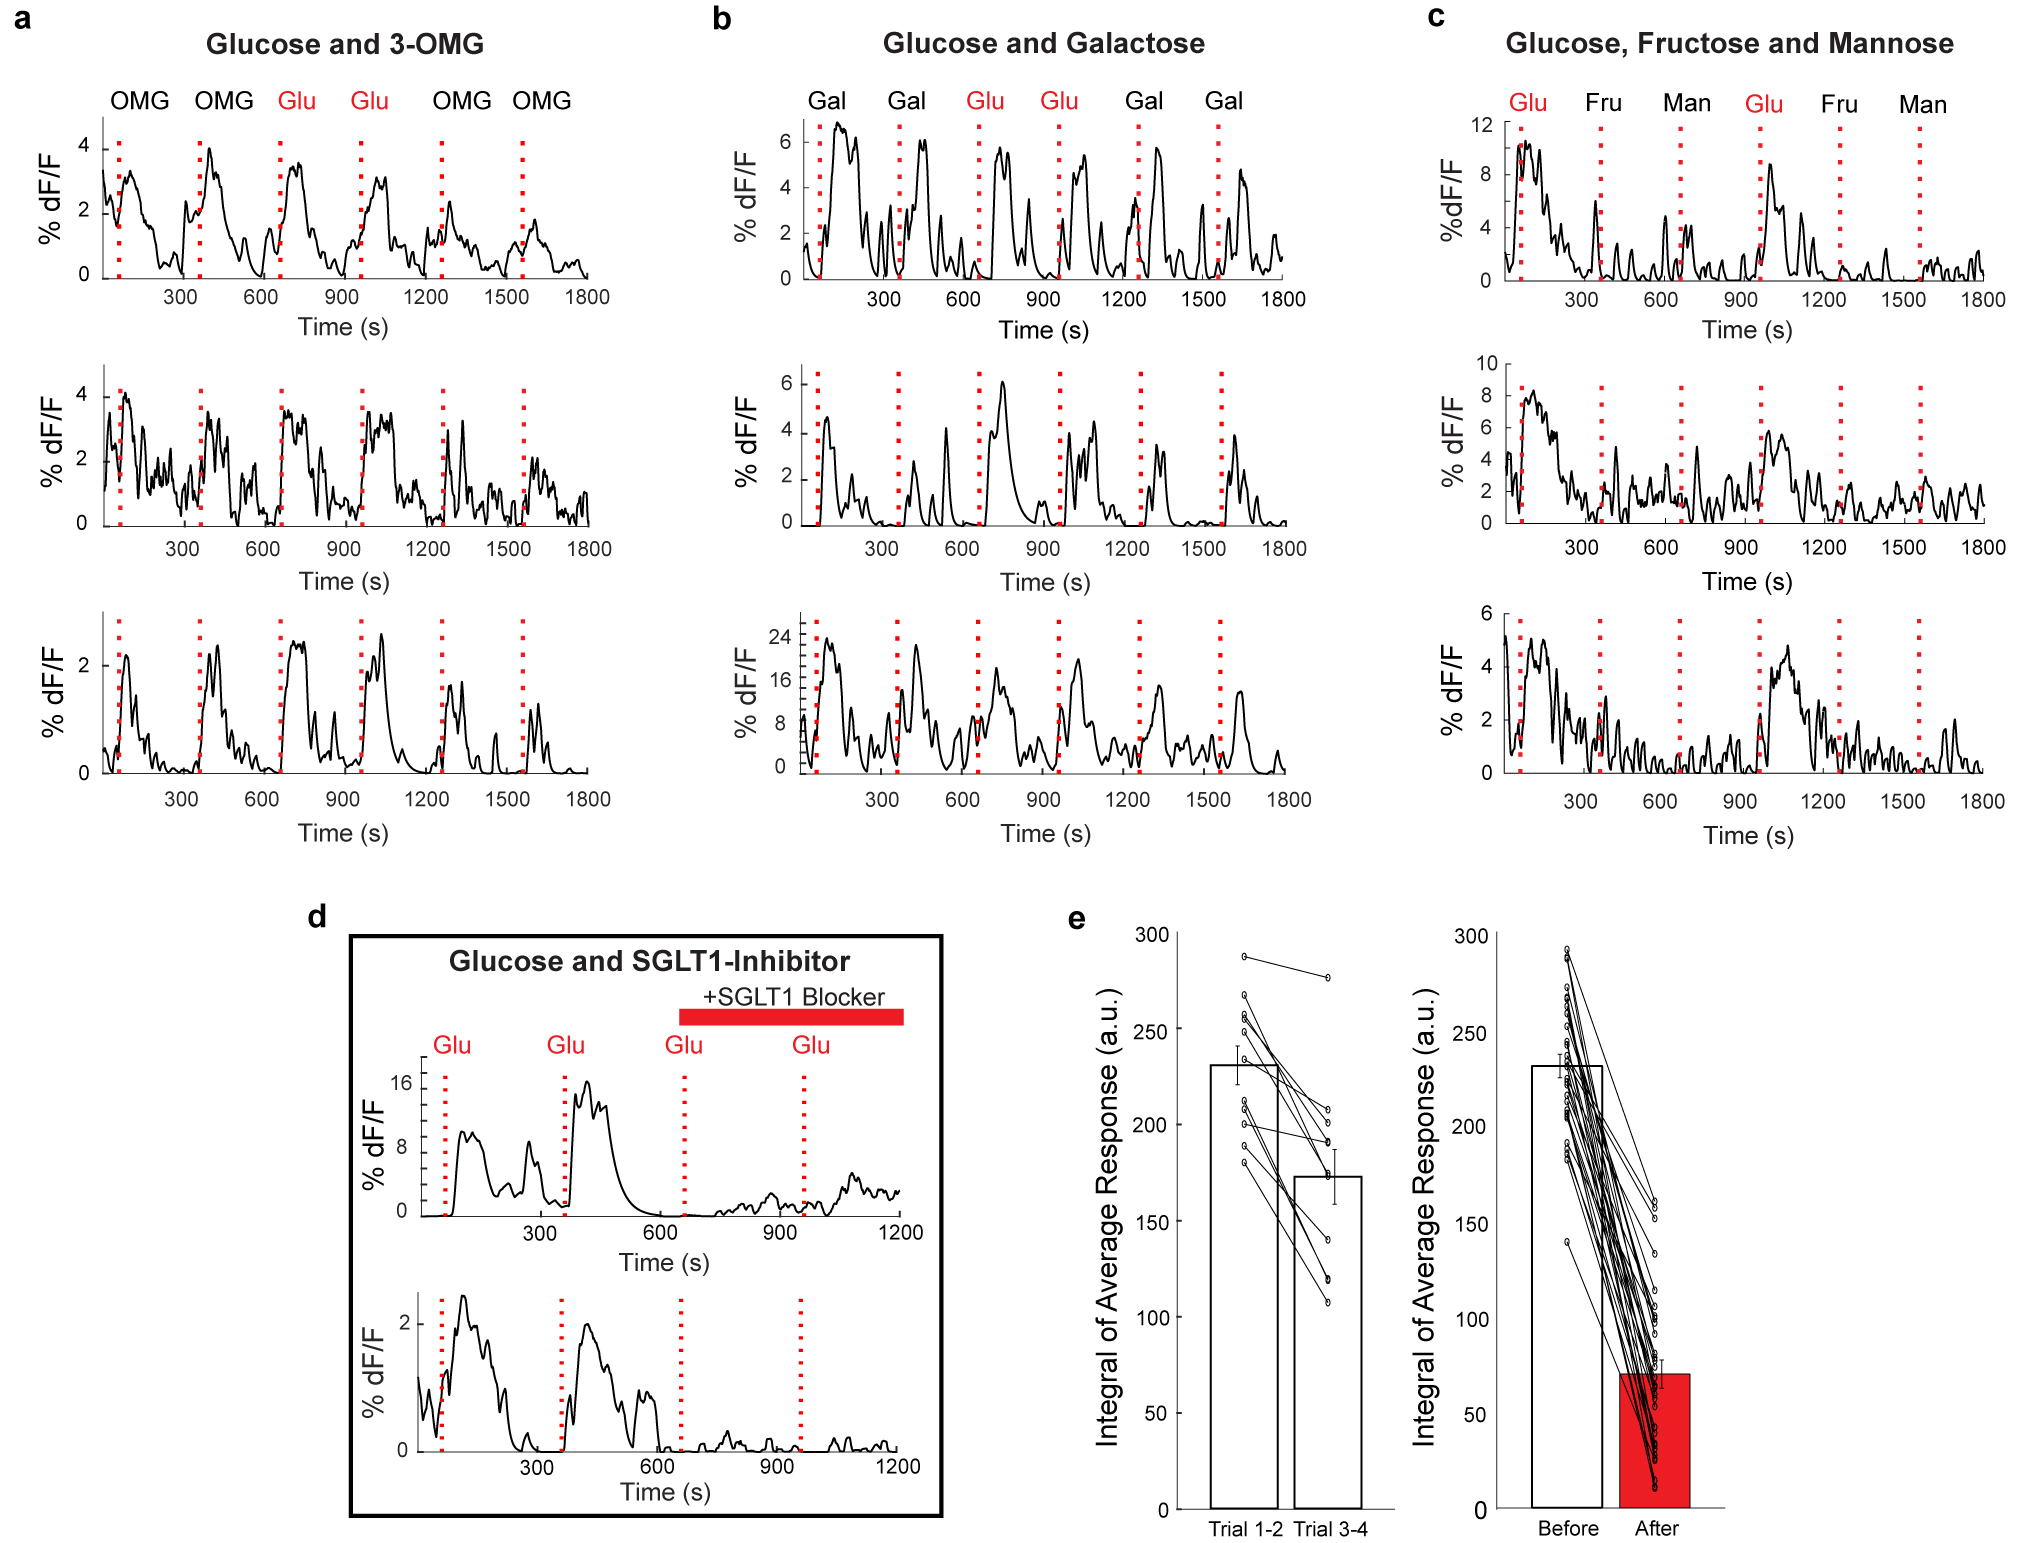
a, Traces of vagal neurons responding to a 10 s pulse of 500 mM intestinal glucose, also challenged with a 10 s pulse of 500 mM 3-OMG. Shown are sample neurons from 2 animals. b, Traces of vagal neurons responding to a 10 s pulse of 500 mM intestinal glucose, also challenged with a 10 s pulse of 500 mM galactose. Shown are sample neurons from 2 animals. c, Traces of vagal neurons responding to a 10 s pulse of 500 mM intestinal glucose, also challenged with a 10s pulse of 500 mM fructose and 500 mM mannose. Shown are sample neurons from 3 mice. d, Traces of vagal neurons responding to two consecutive 10 s pulses of 500 mM intestinal glucose, before and after treating the intestinal segment with 8 mM Phlorizin for 5 min. Note the loss of responses. e, Because responses, in general, show some decay during the time of the experiment (in part due to desensitizing and bleaching of the fluorescent signals), we also analysed the average decay of corresponding glucose responses in the absence of any blocker. The graphs compare the loss of responses during normal decay, and in response to the blocker. For normal decay (left), n = 11 neurons, Pre = 230.8 a.u., Post = 172.8 a.u.; for blocker (right), n = 31 neurons, Pre = 229.7 a.u., Post = 67.0 a.u. All values are mean ± s.e.m. Scale indicates average integral of the responses to the two trials before and after inhibition (a.u. = arbitrary units).