
Figure 4: Imaging the gut-brain axis.
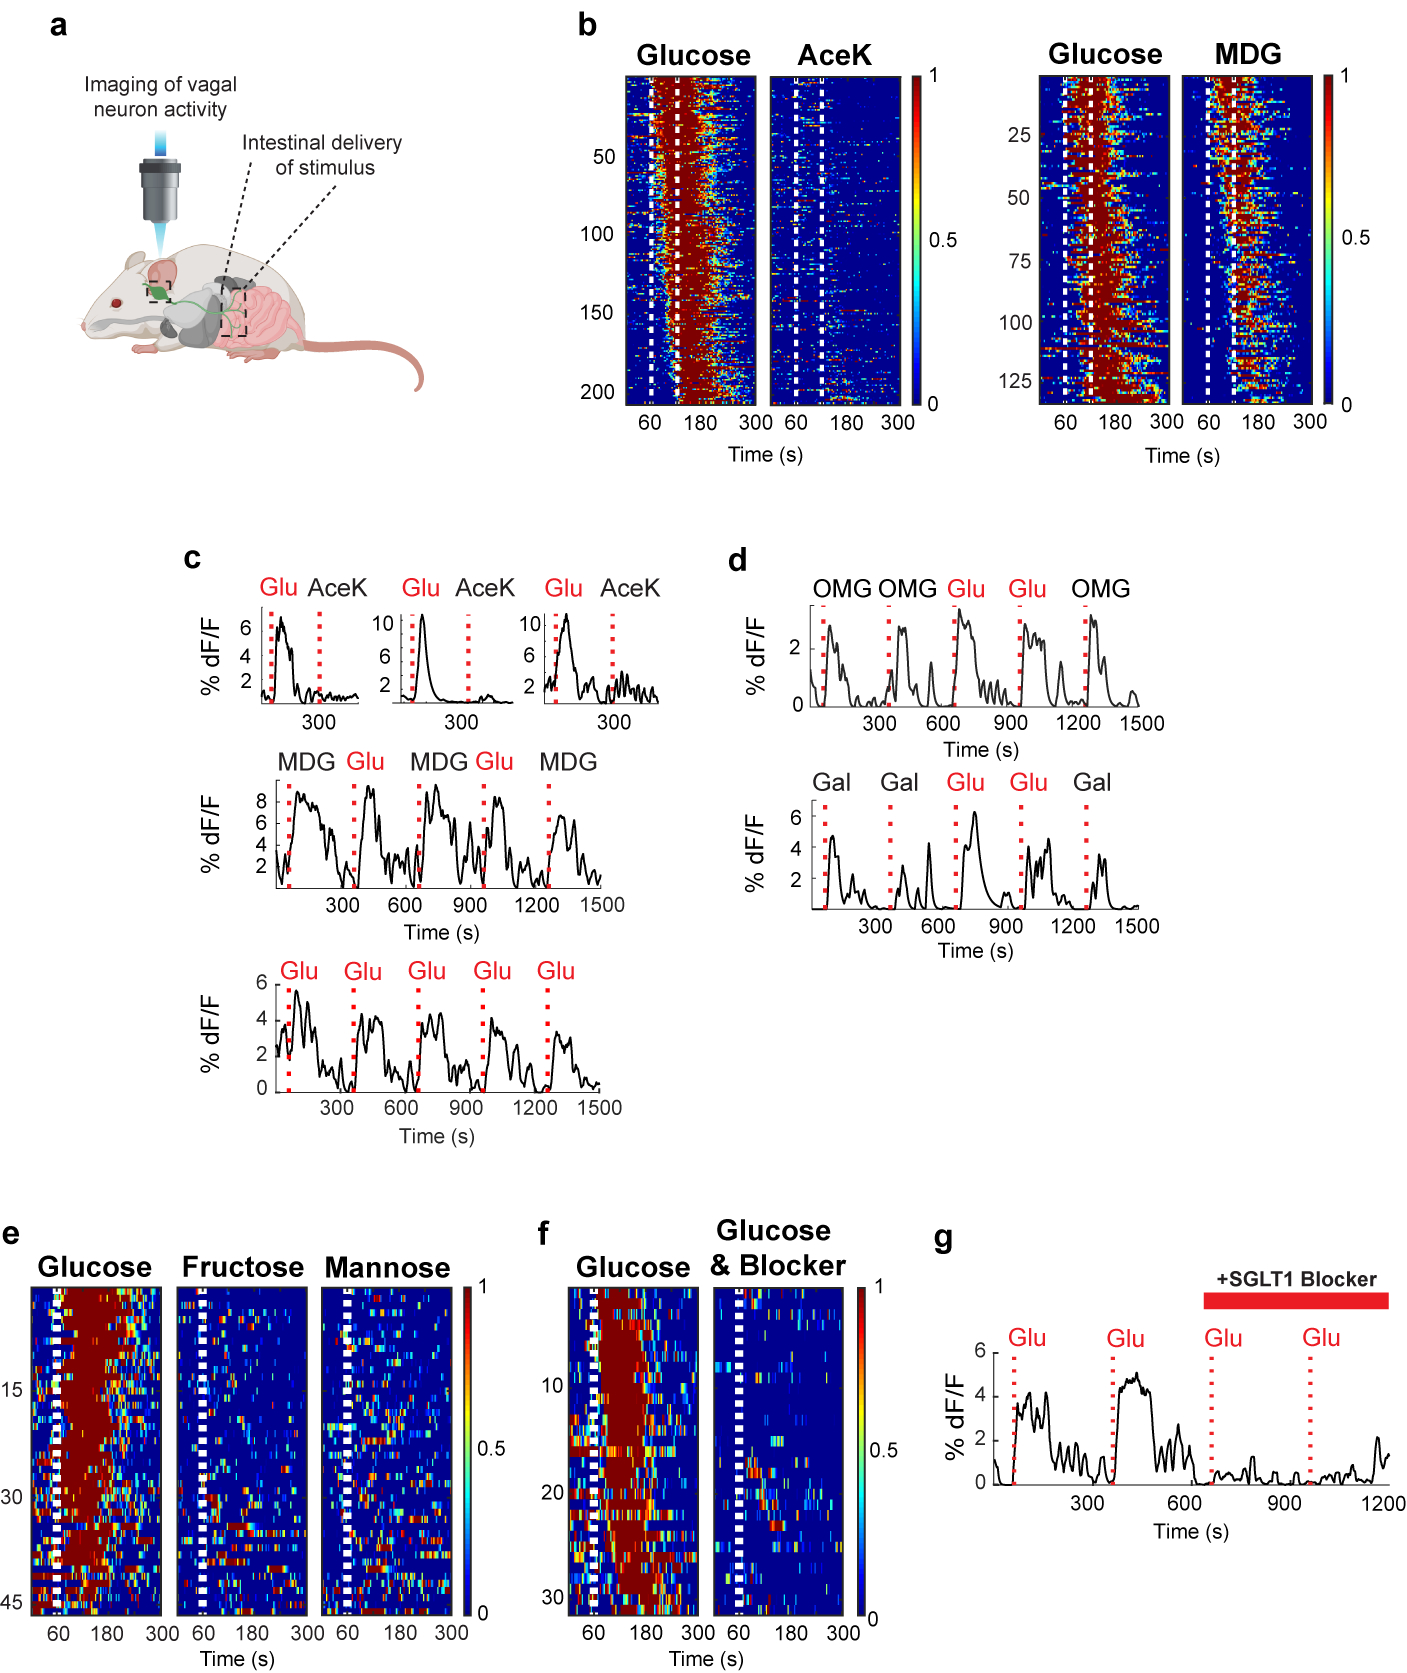
a, We imaged calcium responses in vagal sensory neurons expressing the fluorescent calcium indicator GCaMP6s while stimulating the intestines. b, Heat maps depicting z-score normalized fluorescence traces33,47 from vagal neurons identified as glucose responders. Each row represents the average activity of a single cell to 3 trials. Stimulus window shown by dashed white lines. The left panels are responses of n = 206 vagal neurons to a 60 s intestinal infusion of 500 mM glucose; note lack of responses to 30 mM AceK. The right heatmaps depict n = 133 vagal neurons that responded to 60 s 500 mM glucose, and tested for their responses to 500 mM MDG; heatmaps were normalized across stimuli; responses to glucose and MDG were similar (two-tailed paired t-test, p = 0.06). c, Sample traces of vagal neuron responses to intestinal stimulation with 60 s pulses of 30 mM AceK and 500 mM glucose from 3 mice (upper traces), or to 10 s pulses of 500 mM glucose and 500 mM MDG (lower traces). Note the reliability and rapid onset of responses to the 10 s stimulus (Extended Data Fig. 6c). When using a 10 s stimulus, to minimize potential osmolarity responses (Extended Data Fig. 8), approximately 5% of imaged neurons show statistically significant responses to glucose (Extended Data Fig. 6d). We compared imaging sessions with both the right and left ganglia25 and did not observe any meaningful difference in the proportion of glucose-responding neurons (Extended Data Fig. 6e). d, Vagal neuron responses to 3-OMG (top traces) and galactose (lower traces), n = 3 independent experiments each. These agonists activate vagal neurons in a similar manner to glucose (Extended Data Fig. 2b and 10a–b). e, The monosaccharides fructose and mannose, which are not substrates for SGLT-1, do not activate glucose-responsive neurons. Shown are heat maps of 46 glucose-responding neurons to 500 mM fructose and 500 mM mannose (n = 5 ganglia). Fewer than 10% of glucose responders were activated by either fructose or mannose. f-g, Summary of responses to a 10 s stimulus of 500 mM glucose for 33 neurons before and after intestinal application 8 mM Phlorizin for 5 min (n = 4 mice). Responses are severely diminished after blocker application (see Extended Data Fig. 10d–e and Methods).