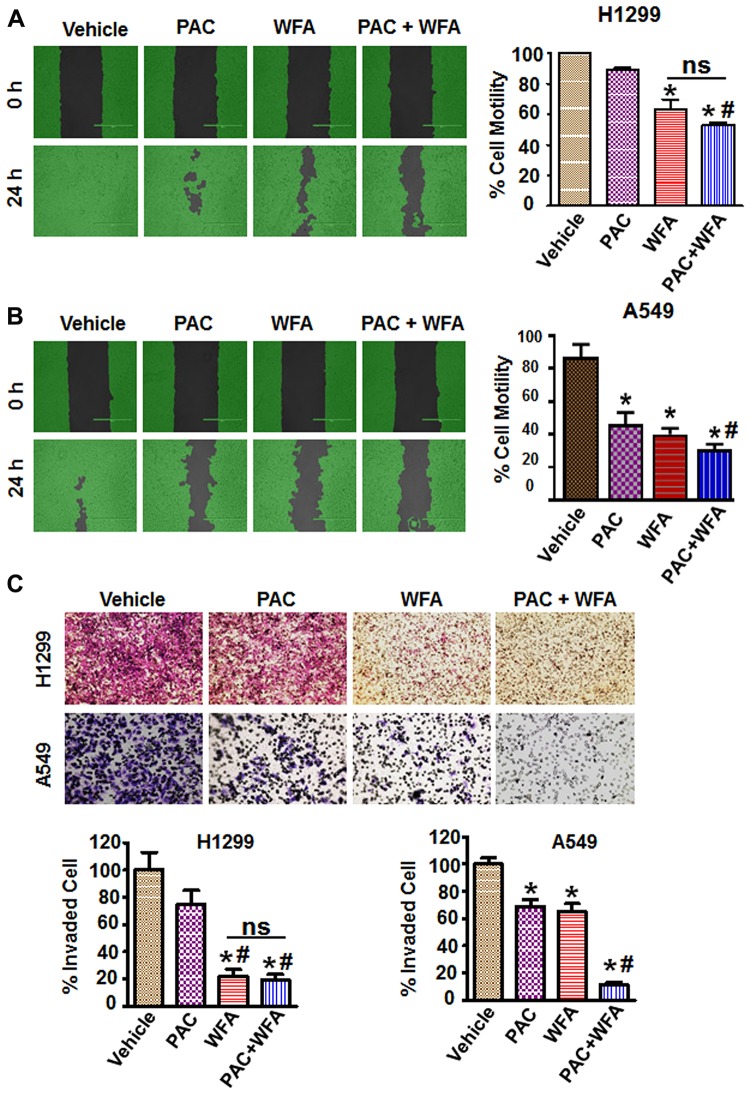
Figure 6. PAC and WFA synergistically inhibited NSCLC cell motility and migration.
H1299 (A) and A549 (B) cells were incubated with PAC (5 nM) and WFA (0.2 μM) alone, and in combination. Percent cell motility was assessed by wound healing assay over 24 h and represented as mean ± SD. *p < 0.05. Student’s t-test was used to compare the treatments versus control. Pictures of wound areas were taken using a light microscope and analysis by Wimasis software. (C) Invasion assay depicting the synergistic inhibition of cellular trans-well migration in H1299 and A549 cells. A small blurred portion in the PAC alone (A549 cells) might have occurred due to a lack of proper focus and/or uneven staining. Data are mean ± SD and *p < 0.05. Significant difference between treatments and vehicle is shown by an asterisk whereas significance between PAC and/or WFA versus combination is shown by #. Data represent mean ± SD and *p < 0.05.

