Abstract
The availability of nucleotides has a direct impact on transcription. Inhibition of dihydroorate dehydrogenase (DHODH) with leflunomide impacts nucleotide pools by reducing pyrimidine levels. Leflunomide abrogates effective transcription elongation of genes required for neural crest development and melanoma growth in vivo1. To define the mechanism of action, we undertook an in vivo chemical suppressor screen for restoration of neural crest after leflunomide treatment. Surprisingly, we found that alterations in progesterone and progesterone receptor (Pgr) signalling strongly suppressed leflunomide-mediated neural crest effects in zebrafish. Progesterone additionally bypasses the transcriptional elongation block resulting from Paf complex deficiency, rescuing neural crest defects in ctr9 morphant and paf1(alnz24) mutant embryos. Using proteomics, we found that Pgr binds the RNA helicase protein Ddx21. Ddx21-deficient zebrafish show resistance to leflunomide-induced stress. On a molecular level, nucleotide depletion reduced the chromatin occupancy of DDX21 in human A375 melanoma cells. Nucleotide supplementation reversed the gene expression and DDX21 occupancy changes prompted by leflunomide. Together, our results show that DDX21 acts as a sensor and mediator of transcription during nucleotide stress.
Maintenance of adequate nucleotide pools is necessary for many biological processes2. Changes in nucleotide metabolism can cause cellular transformation and tumorigenesis3,4. Inhibition of DHODH, an enzyme involved in de novo nucleotide biosynthesis, lowers pyrimidine levels and blocks transcription elongation in neural crest and melanoma1. Transcription elongation is highly regulated following recruitment of RNA polymerase II (Pol II) to the transcriptional start site (TSS) and establishment of promoter-proximal pausing5,6. The positive transcription elongation factor b (p-TEFb), composed of cyclin-dependent kinase 9 (CDK9) and cyclin T1 (CCNT1), is able to relieve pausing and stimulate productive elongation7,8. HEXIM1, a component of the 7SK small nuclear ribonuclear protein (7SK snRNP), sequesters p-TEFb to enforce transcriptional pausing under nucleotide stress9. Despite these insights, the mechanisms through which nucleotide depletion is sensed are unknown.
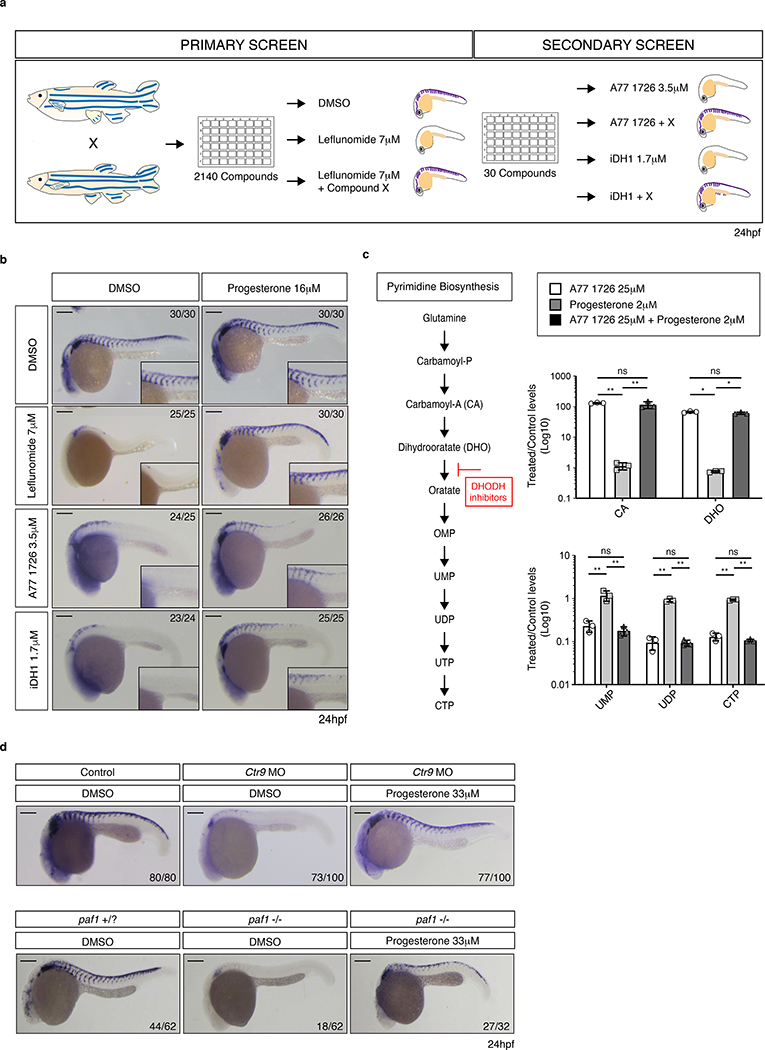
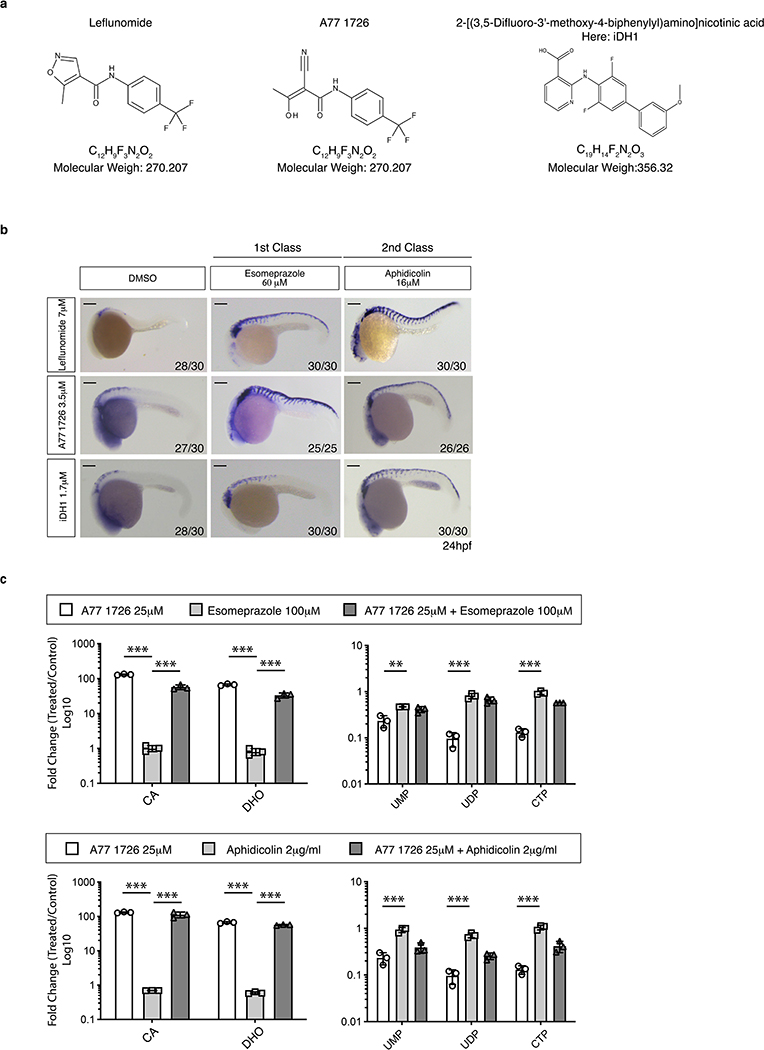
To elucidate how a block in pyrimidine biosynthesis affects transcription elongation, we performed a chemical suppressor screen for the DHODH inhibitor leflunomide in zebrafish (Danio rerio). We treated embryos with leflunomide and screened 2140 chemicals by whole mount in situ hybridization (WISH) for the neural crest marker crestin10 (Fig. 1a). We identified 30 compounds that were able to rescue the neural crest lineage upon leflunomide treatment (Supplementary Table 1). To ensure specificity, we tested these chemicals in combination with A77 1726 (Terileflunomide), the active metabolite of leflunomide, and 2-[(3,5-Difluoro-3’-methoxy-4-biphenylyl)amino]nicotinic acid, a DHODH inhibitor with a distinct chemical structure hereafter named iDH1 (Extended Data Fig. 1a). We found that 13 chemicals were able to rescue crestin expression independent of the DHODH inhibitor used (Supplementary Table 1).
Figure 1. Progesterone confers resistance to nucleotide depletion in vivo.
(a) Schematic overview of chemical suppressor screen performed in zebrafish embryos with the DHODH inhibitors leflunomide, A77 1726, and iDHODH1 (iDH1). Crestin expression was assessed at 24hpf. (b) In situ hybridization for crestin at 24hpf in embryos treated with the indicated DHODH inhibitors plus or minus progesterone. Number of embryos displaying the represented phenotype is noted. Scale bar represents 200μm. (c) Pyrimidine biosynthesis pathway highlighting the enzymatic conversion inhibited by the leflunomide, A77 1726 and iDH1. Metabolite profiling of A375 melanoma cells exposed to indicated chemicals for 24 hours. (n = 3 biologically independent experiments, Mean ± SD, Two-Way ANOVA with Bonferroni Comparison, * = p < 0.001, ** = p < 0.0001, ns = p > 0.05). (d) In situ hybridization for crestin at 24hpf in Ctr9 morpholine (MO) injected or paf mutant zebrafish embryos exposed to DMSO or progesterone. Number of embryos displaying the presented phenotype is indicated. Scale bars represent 200μm. Source data are available online.
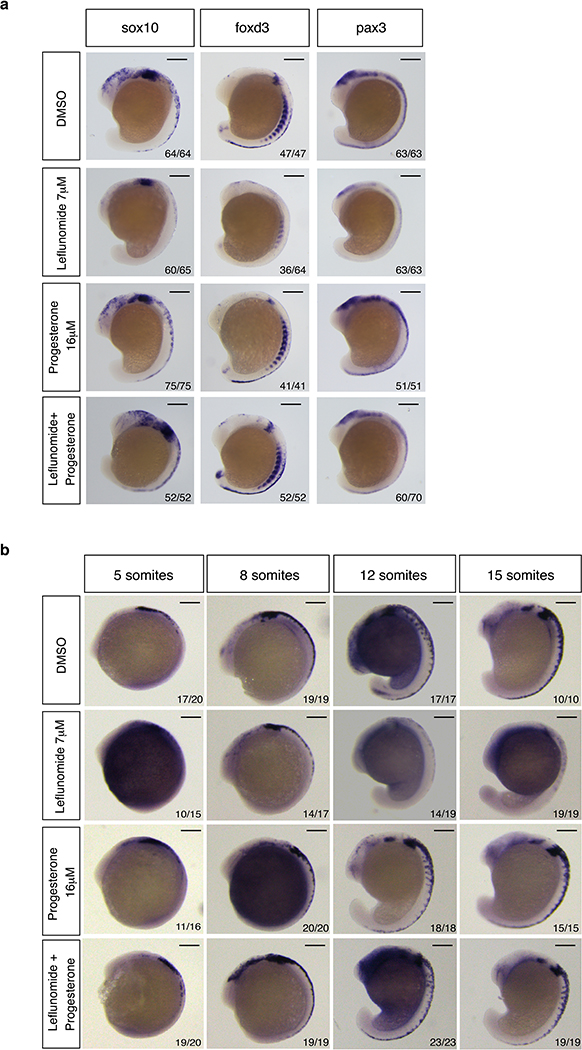
We performed metabolite profiling by mass spectrometry on A375 melanoma cells to evaluate nucleotide and precursor levels 24 hours post treatment. Analysis revealed that hits fall into three classes. The first class affects the biochemical activity of leflunomide while the second class affects nucleotide pools. Chemicals of the third class bypass transcriptional defects through independent mechanisms (Fig. 1b–c, Extended Data Fig. 1b–c). Within this third group is the steroid hormone progesterone. Progesterone, an activator of Pgr, recued expression of the neural crest markers crestin, sox10, pax3 and foxd3 (Fig. 1b, Extended Data Fig. 2a). We then tested whether progesterone also rescues neural crest defects resulting from Paf complex deficiency. The Paf complex plays a crucial role in transcription elongation11–13. We found that progesterone circumvents aberrant transcription in ctr912 morphants and paf1(alnz24)14 mutants (Fig. 1d). This establishes that progesterone rescues elongation defects consequent to leflunomide or Paf complex deficiency.
To understand the developmental aspects of rescue, we added progesterone at varying times after leflunomide treatment. We found that 12 to 15 somites is the earliest stage to rescue neural crest (Extended Data Fig. 2b). We performed RNA-Seq on embryos treated with leflunomide, progesterone or both compounds at 8 and 15 somites. This captured transcriptional changes before onset and at emergence of the phenotype, respectively. Although DHODH inhibition is expected to lead to ubiquitous effects, different cell types may have varying sensitivities to inhibition depending on their ability to engage alternative mechanisms for nucleotide production, such as salvage pathways. Analysis of differentially expressed genes (DEGs) at 15 somites revealed that several lineages are likely affected by leflunomide, including muscle and skeletal systems (Supplementary Table 2). We additionally observed specific enrichment for neural crest-derived lineages. Mutations in DHODH cause Miller Syndrome, a human craniofacial disorder15. This highlights the susceptibility of neural crest to DHODH deficiency during development. Together, the data illustrate the tissue specific nature of gene expression defects with neural crest being prominently affected.
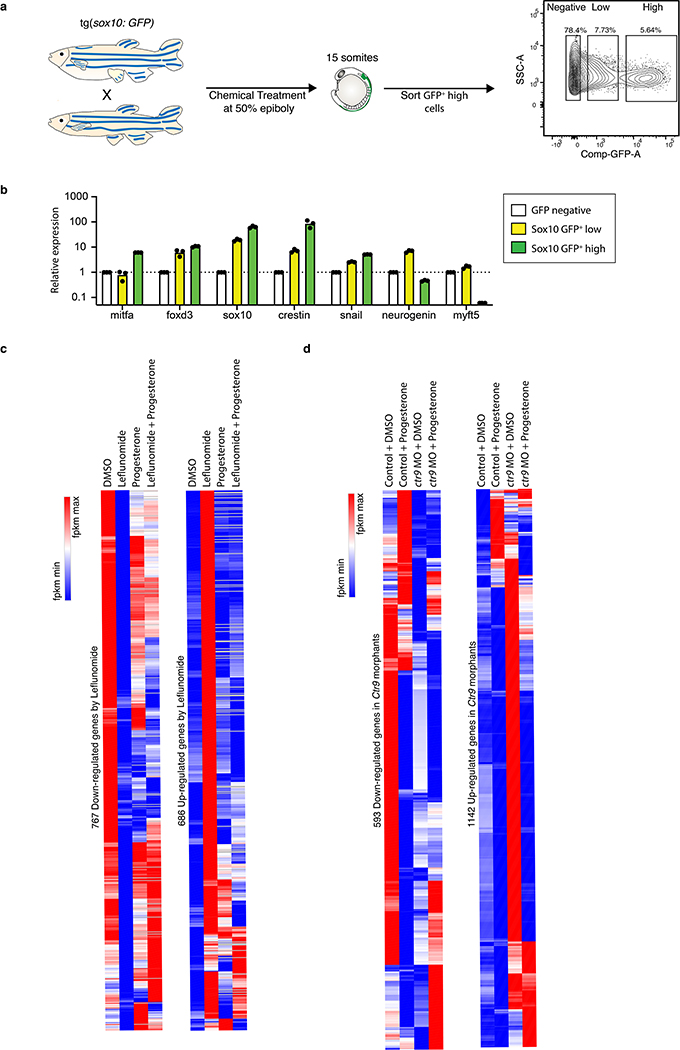
We observed little overlap (7%) in DEGs at 8 and 15 somites (Supplementary Table 2). We suspected neural crest effects to be obscured through bulk transcriptomic profiling of heterogeneous developing embryos. In order to resolve specific changes, we sorted sox10+ neural crest cells at 15 somites from transgenic embryos treated with leflunomide, progesterone or both compounds (Extended Data Fig. 3a–b). Progesterone restores the gene signature imposed by leflunomide to near completion, rescuing over 83% of DEGs, including foxd3 and pax3 (Extended Data Fig. 3c, Supplementary Table 3). We observed a similar (72%) transcriptional reversion in ctr9-morphant sox10+ cells (Extended Data Fig. 3d, Supplementary Table 4). Genes not rescued showed enrichment in developmental signaling pathways. We cannot exclude that these genes may require additional signals or time to restore their expression. Nonetheless, the data define progesterone as a strong chemical suppressor of leflunomide-mediated neural crest defects and supports a role for nuclear hormone signalling in overcoming transcriptional defects.
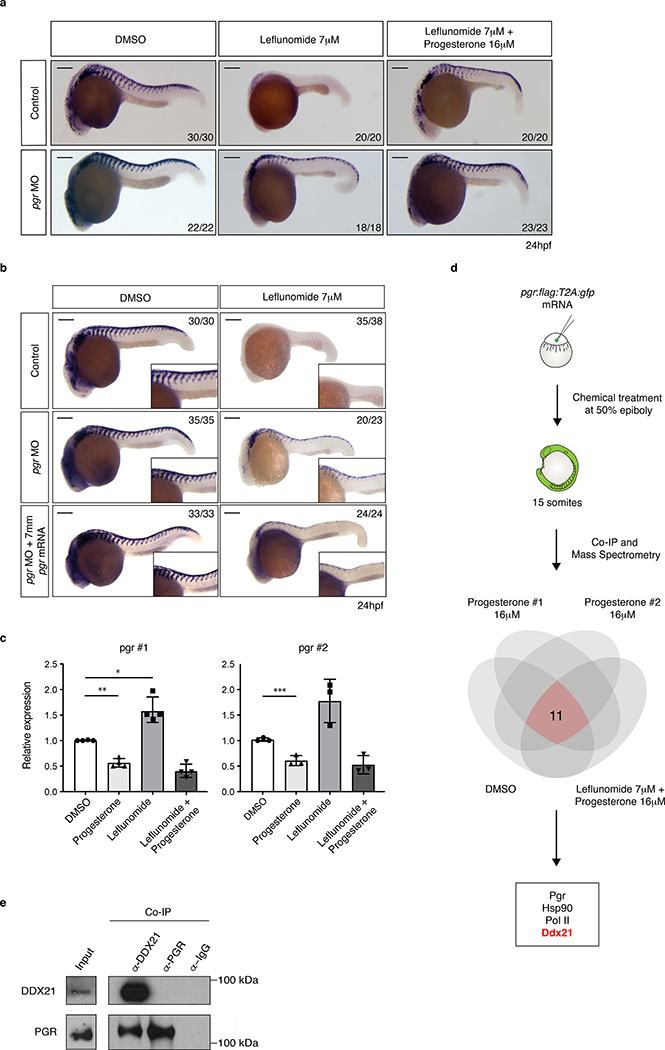
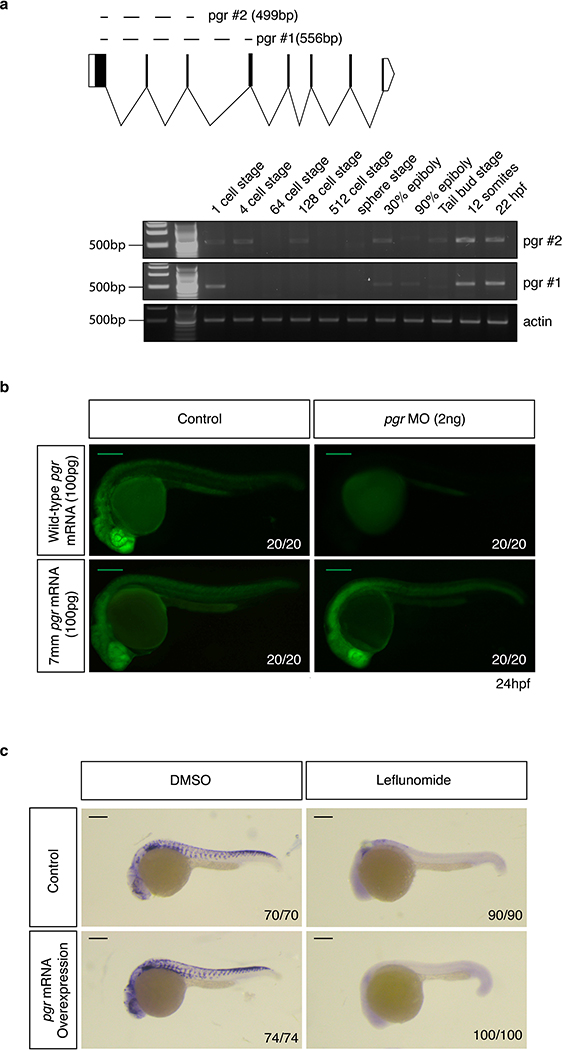
We verified pgr expression during early embryonic development by RT-PCR (Extended Data Fig. 4a). To test whether the effect of progesterone is mediated via its receptor, we abolished pgr expression using an ATG morpholino (MO). Embryos were treated with leflunomide or leflunomide plus progesterone, and crestin expression was assessed. We found that loss of pgr did not affect progesterone-mediated rescue. Rather, loss of pgr by itself was sufficient to rescue crestin upon leflunomide treatment (Fig. 2a). We ensured MO specificity through co-injection with wild-type (wt) or mismatched (7mm) pgr mRNA (Extended Data Fig. 4b). In line with the previous observation, crestin rescue was reduced by co-injection of the pgr MO with mismatched pgr mRNA (Fig. 2b). These data demonstrate that knockdown of pgr counteracts transcriptional defects arising from nucleotide depletion.
Figure 2. The progesterone receptor interacts with RNA-helicase DDX21.
(a, b) In situ hybridization at 24hpf for crestin in control, pgr morpholine (MO) and pgr mRNA injected embryos exposed to leflunomide in the presence and absence of progesterone. Number of embryos displaying the presented phenotype is indicated. Scale bars represent 200μm. (c) qPCR for pgr on zebrafish embryos at 24hpf using two different primer sets. (pgr primer set 1; n = 4, pgr primer set 2; n = 3 biologically independent experiments, Mean ± SD, Unpaired T-test with Welch Correction, * p = 0.017, ** p = 0.002, *** p = 0.021). (d) Co-Immunoprecipitation followed by mass-spectrometry of pgr:flag:T2A:gfp injected embryos identified complex association partners of Pgr in vivo. (e) DDX21 associates with PGR in A375 melanoma cells (2 biologically independent experiments). Source data are available online.
As pgr knockdown rescues neural crest, we hypothesized whether the progesterone dosage used in our studies decreased receptor expression through self-regulatory mechanisms. Effects of progesterone on PGR expression have been previously described in cancer16,17. We observed that progesterone reduced pgr levels by almost 2-fold in the embryos (Fig. 2c). These findings may explain why both exposure to progesterone and loss of its receptor yield the same biological effect in vivo. We also found that leflunomide increases pgr expression and were prompted to assess if pgr overexpression can mimic the effects of leflunomide. Overexpression of pgr was not sufficient to abrogate crestin expression (Extended Data Fig. 4c). This indicates that additional mechanisms are in play to establish loss of neural crest lineage through leflunomide. Together, the data support a function for Pgr during nucleotide stress.
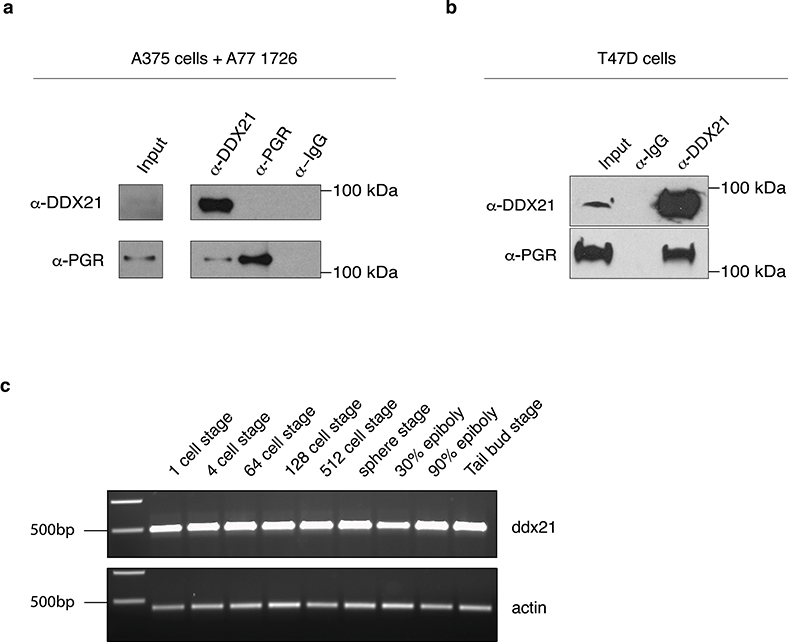
To clarify the role of Pgr, we conducted co-immunoprecipitation (Co-IP) followed by mass spectrometry to identify complex interaction partners of the receptor. We injected embryos with pgr:flag:T2A:gfp mRNA and exposed them to DMSO, progesterone, or leflunomide plus progesterone prior to Co-IP at 15 somites. Amongst the top peptides identified was Hsp90, a known interactor of Pgr18 (Fig. 2d, Supplementary Table 5). We found associations between Pgr and proteins from two major biological processes. First, Pgr associates with nucleotide metabolism enzymes such as Atic and Impdh2. This highlights a function for Pgr in the regulation of nucleotide levels. We also identified RNA metabolism proteins as potential complex partners of Pgr, including Ddx21. Ddx21 is an RNA helicase with reported functions in transcription and rRNA metabolism19–21. We verified the association between DDX21 and PGR in A375 cells with inducible PGR expression and in T47D cells where both proteins are expressed naturally (Fig. 2e, Extended Data Fig. 5a–b). This reveals an association between PGR and DDX21 in several cellular contexts.
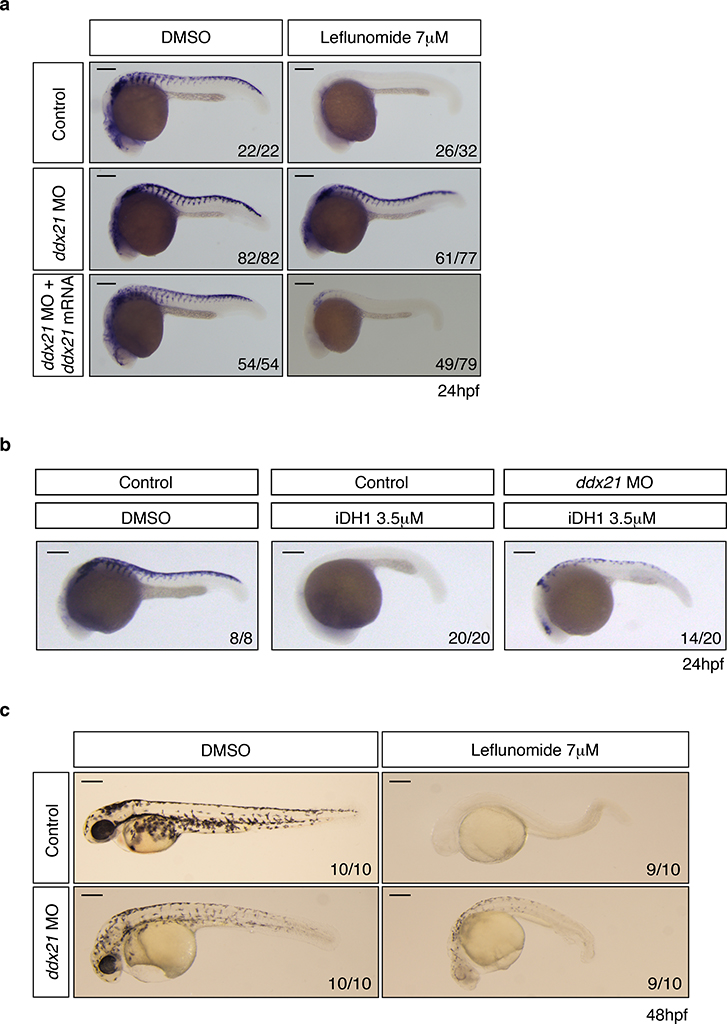
Due to its regulating function in Pol I and Pol II transcription19–21, we studied the role of Ddx21 in vivo. We confirmed ddx21 expression during early development by RT-PCR (Extended Data Fig. 5c). We then knocked down ddx21 using an ATG MO and exposed embryos to DMSO, leflunomide or iDH1. We observed that loss of ddx21 rescues the neural crest upon leflunomide or iDH1 treatment (Fig. 3a–b). Co-injection of the MO with wild-type ddx21 mRNA reduced rescue effects confirming MO specificity. Additionally, we assessed whether crestin rescue through loss of function recovers in vivo melanocyte differentiation potential. Pigmentation defects characterizing leflunomide-treated embryos are overcome by ddx21 knock down (Fig. 3c). This establishes that knockdown of ddx21 confers resistance to nucleotide depletion.
Figure 3. Loss of Ddx21 rescues neural crest defects under nucleotide depletion.
(a, b) In situ hybridization at 24hpf for crestin in control, ddx21 morpholine (MO) and ddx21 mRNA injected embryos exposed to DHODH inhibitors. Number of embryos displaying the presented phenotype is indicated. Scale bars represent 200μm. (c) Lateral view of pigmentation of zebrafish embryos at 48hpf. Number of embryos displaying the phenotype represented is indicated in lower right corner. Scale bars represent 250μm.
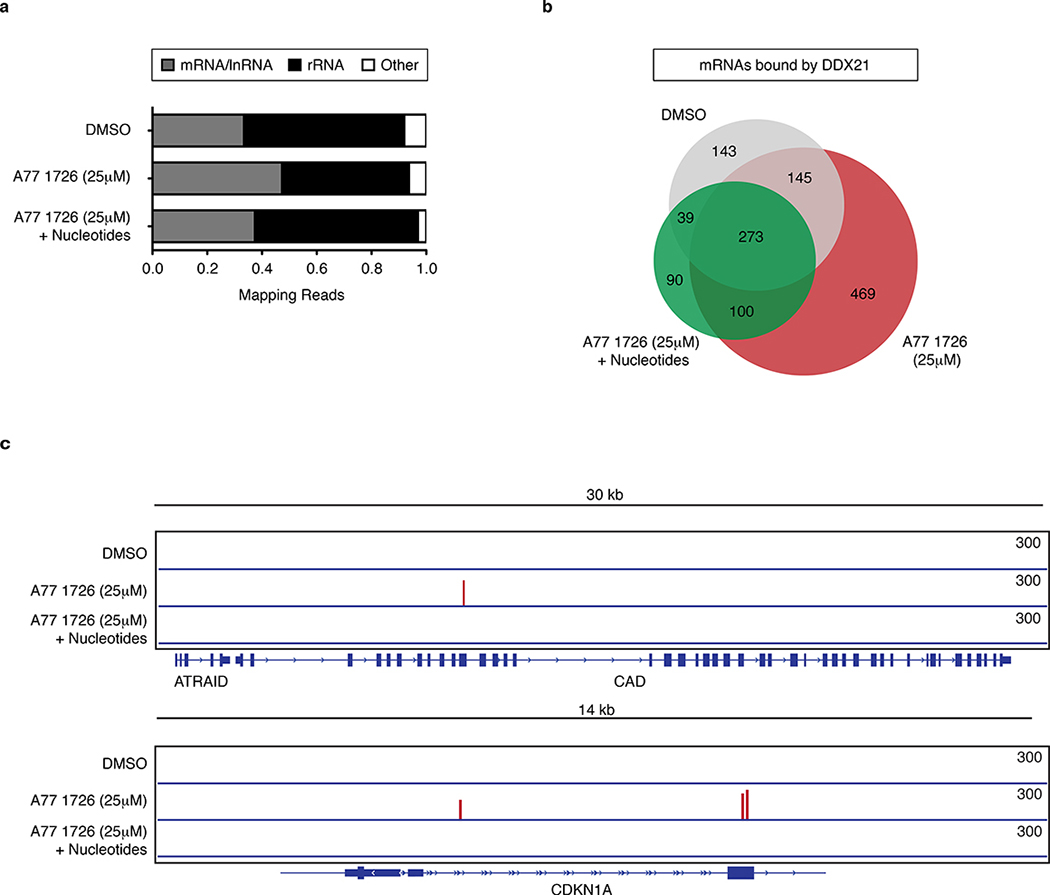
Ribosomal biosynthesis encompasses a significant demand for nucleotides. The rRNA of ribosomes is where the majority of nucleotides reside22. Given the dual function of DDX21 in regulating mRNA transcription and rRNA transcription, processing and modifications23, we hypothesized that DDX21 responds to changes in nucleotide levels. To determine whether nucleotide depletion affects DDX21 binding to rRNA, we performed irCLIP for DDX21 in A375 cells after A77 1726 treatment. Remarkably, we observed that DDX21 binding to rRNA is reduced by nucleotide stress (Fig. 4a). Simultaneously, there is a significant increase in binding of DDX21 to mRNA, including 469 new bound transcripts (Fig. 4b, Supplementary Table 6). New DDX21-bound transcripts include mRNAs of genes involved in pyrimidine metabolism and the cell cycle such as CAD and CDKN1A, respectively (Fig. 4c). The shift in DDX21 interaction from rRNA to mRNA is reversed by nucleotide supplementation, indicating this effect is specific to a reduction of nucleotide pools. We hypothesized that binding of DDX21 to mRNA affects corresponding protein levels. We therefore performed whole-proteomics analysis on A77 1726-treated A375 cells (Supplementary Table 7). We found no significant correlation between DDX21-bound mRNAs and their respective protein expression levels. Currently, the consequence of DDX21 binding to mRNAs is unknown. We do not exclude a role for DDX21 in mRNA processing during nucleotide stress. We conclude that nucleotide depletion leads to altered binding of DDX21 to mRNAs, but these changes are not reflected at protein levels of targeted transcripts.
Figure 4. Nucleotide stress alters binding of DDX21 to RNA.
(a) Annotation of DDX21-associated RNAs identified by irCLIP in A375 melanoma cells after DHODH inhibition with or without nucleotide supplementation. (b) Venn diagram comparing overlap in mRNA binding targets of DDX21 under different conditions. (c) Gene tracks showing enhancer irCLIP signal of DDX21 at the CAD and CDKN1A locus during nucleotide depletion. (n = 3 biologically independent experiments). Source data are available online.
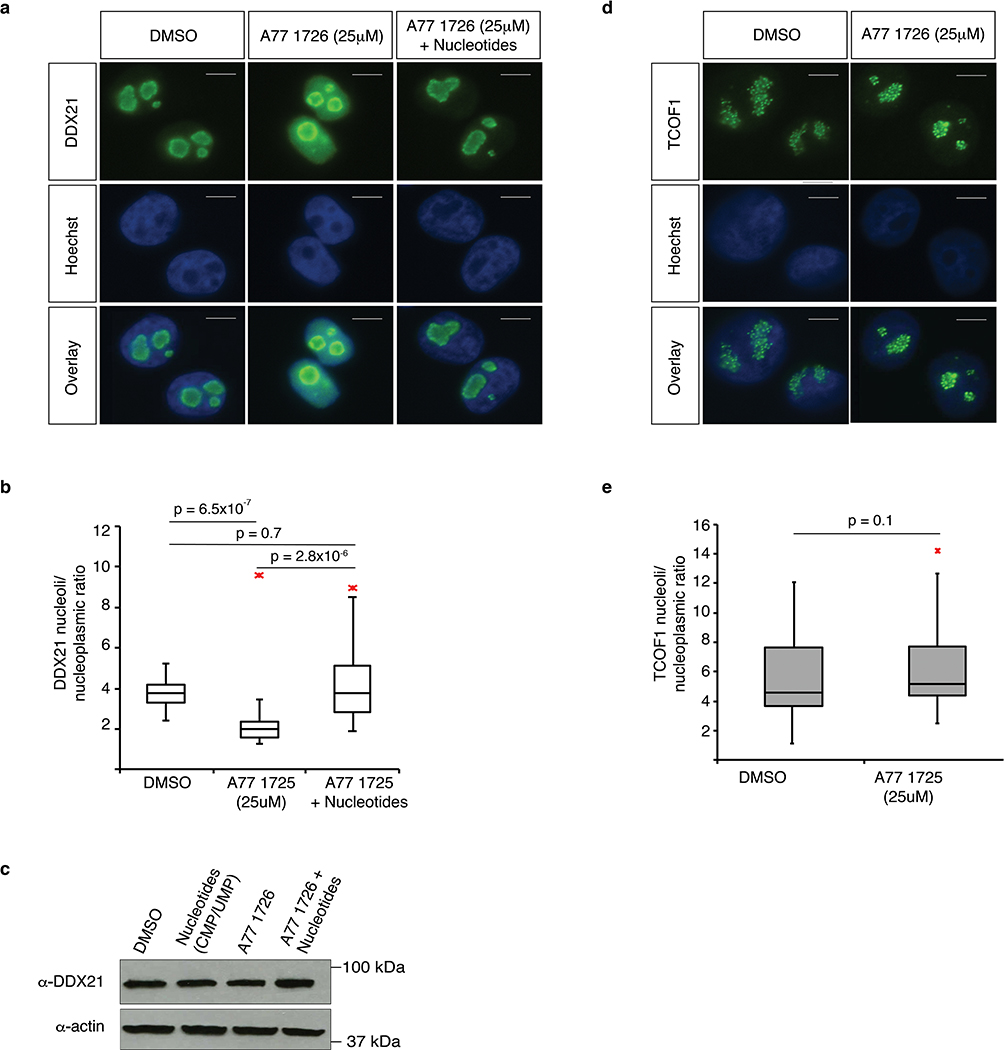
Under homeostatic conditions, DDX21 is localized to the nucleolus where it directly binds rRNAs and snoRNAs19,24. Following transcriptional stress, DDX21 relocalizes to the nucleoplasm19,20. Based on our observation that DDX21 engages mRNAs during low nucleotide levels, we investigated whether DHODH inhibition affects DDX21 localization. We performed immunofluorescence (IF) staining for DDX21 in A375 cells 24 hours after A77 1726 treatment, the timepoint when nucleotide depletion is first observed9. We observed partial relocalization of DDX21 from the nucleolus to the nucleoplasm, which is reversed by nucleotide supplementation. No changes in total DDX21 protein levels were noted (Extended Data Fig. 6a–c). TCOF1, an unrelated nucleolar protein, did not display changes in localization upon nucleotide stress (Extended Data Fig. 6d–e). These observations reveal that DDX21 can interpret nucleotide levels and relocalizes to the nucleoplasm when nucleotide pools are limited.
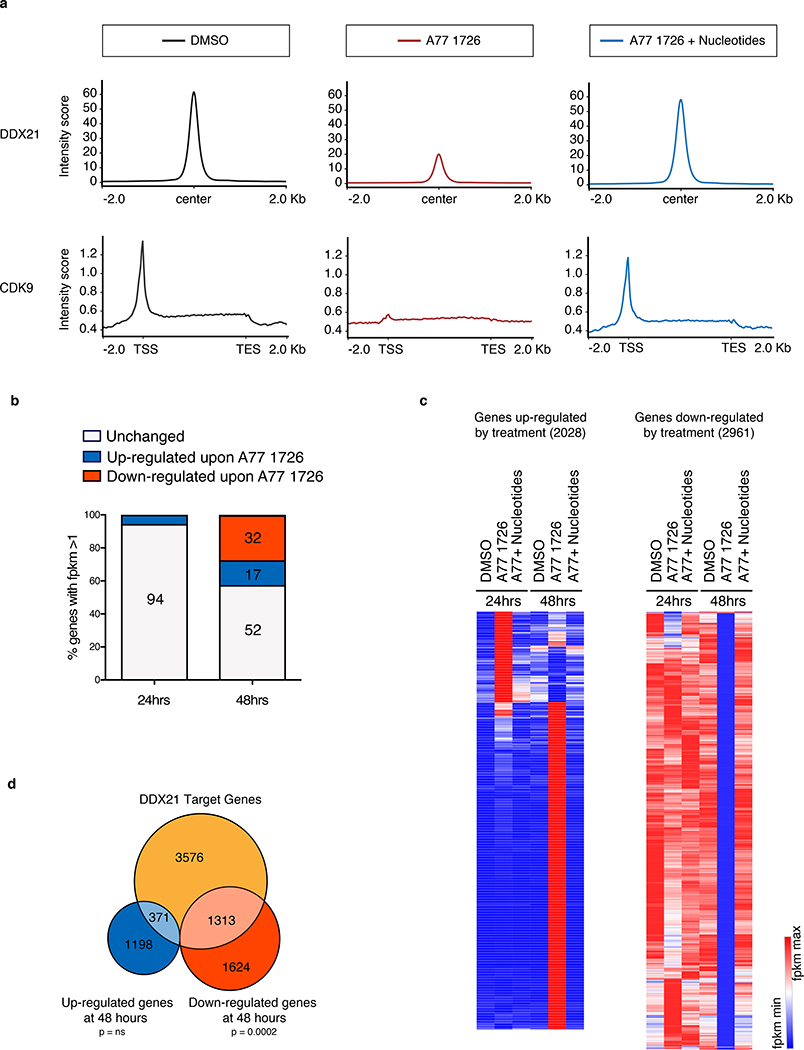
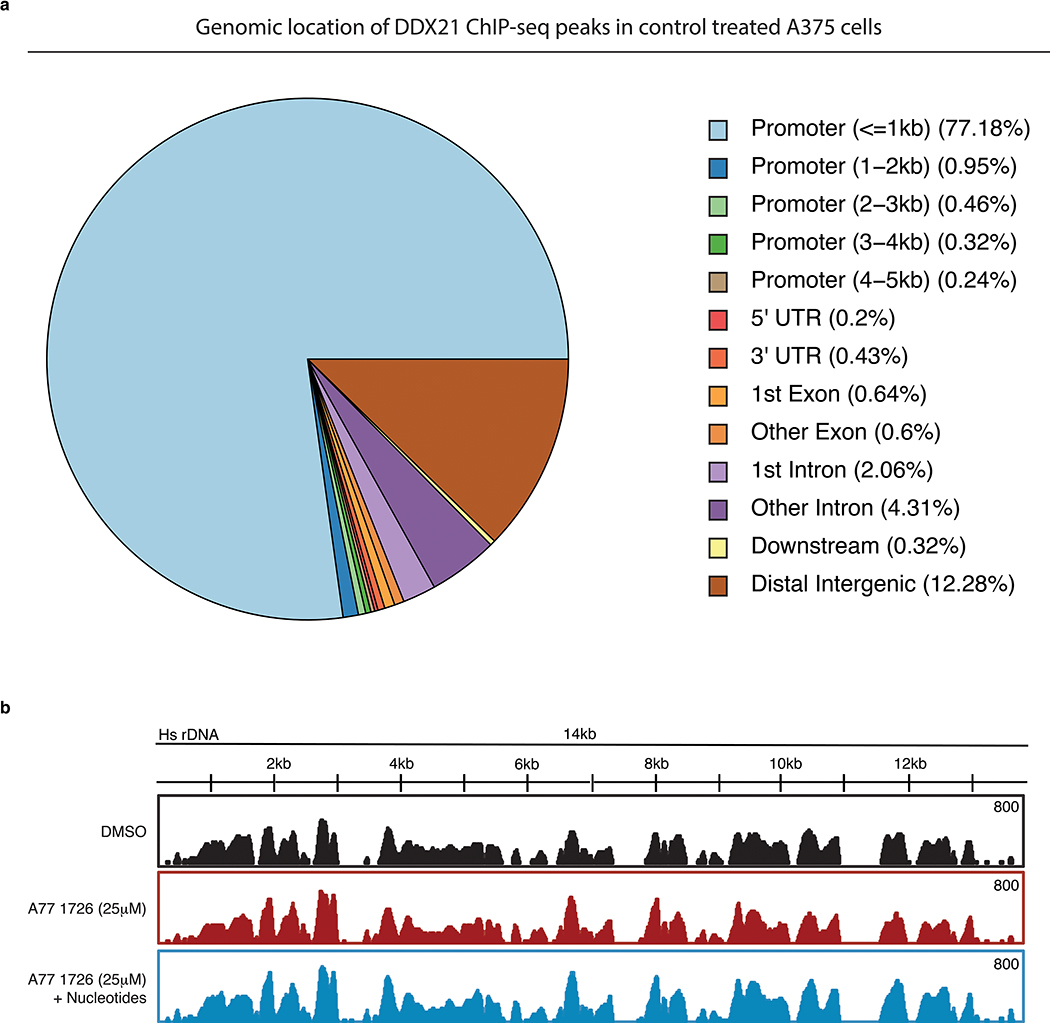
Given that changes in DDX21 localization correlate with its chromatin occupancy19, we investigated whether nucleotide stress affects DDX21 binding to chromatin. We performed ChIP-Seq for DDX21 and the CDK9 subunit of p-TEFb in A375 cells (Extended Data Fig.7a). Cells exposed to A77 1726 showed substantially reduced genomic occupancy of DDX21 and CDK9 compared to control cells. Remarkably, chromatin binding was re-established by the addition of nucleotides (Fig. 5a). Because of suggestions that DDX21 senses the transcriptional status of Pol I21,25, we examined DDX21 occupancy in the 14kb rDNA repeat region. The data show that the genomic distribution of DDX21 along the rDNA genes for Pol I-directed transcripts is not affected by limited nucleotide pools (Extended Data Fig. 7b). However, we previously observed reduced binding of DDX21 to rRNA during nucleotide stress (Fig. 4a). Taken together, these observations suggest that the bulk effect of DDX21 in the nucleolus is reduced as well as the efficiency of ribosomal biogenesis. These data demonstrate that nucleotide depletion predominantly affects the activity of DDX21 on Pol II-mediated transcription and target genes.
Figure 5. Ddx21 mediates transcriptional changes during nucleotide stress.
(a) ChIP-Seq for DDX21 and CDK9 in A375 melanoma cells after 24 hours of treatment. Upper panel: Metagene analysis of DDX21-bound regions. Normalized peak intensities ± 2Kb from the center of DDX21 ChIP-seq are shown. Lower panel: Metagene representation of normalized CDK9 occupancy at transcription start site (TSS), along gene bodies and at transcription end site (TES) are shown. (b) Percentage of differentially expressed genes (DEGs) in A375 melanoma cells after 24 hours and 48 hours in the presence of A77 1726. DEG criteria: FPMK ≥1 after treatment, Log2 fold change ≥1 or ≤ −1. (n = 3 biologically independent experiments). (c) Hierarchical clustering heatmap of FPKM values from genes up-regulated (2028) and down-regulated (2961) at 24 hours and 48 hours post DHODH inhibition plus or minus nucleotide supplementation. (d) Venn diagram of DDX21 target genes with reduced DDX21 binding upon A77 1726 treatment as defined by ChIP-Seq (orange); genes up-regulated by RNA-Seq (blue) and genes down-regulated by RNA-Seq (red) at 48 hours post treatment with A77 1726 in A375 melanoma cells (n = 3 biologically independent experiments, Hypergeometric Test, ns = not significant; under enrichment p-value = 2.7e-58). Source data are available online.
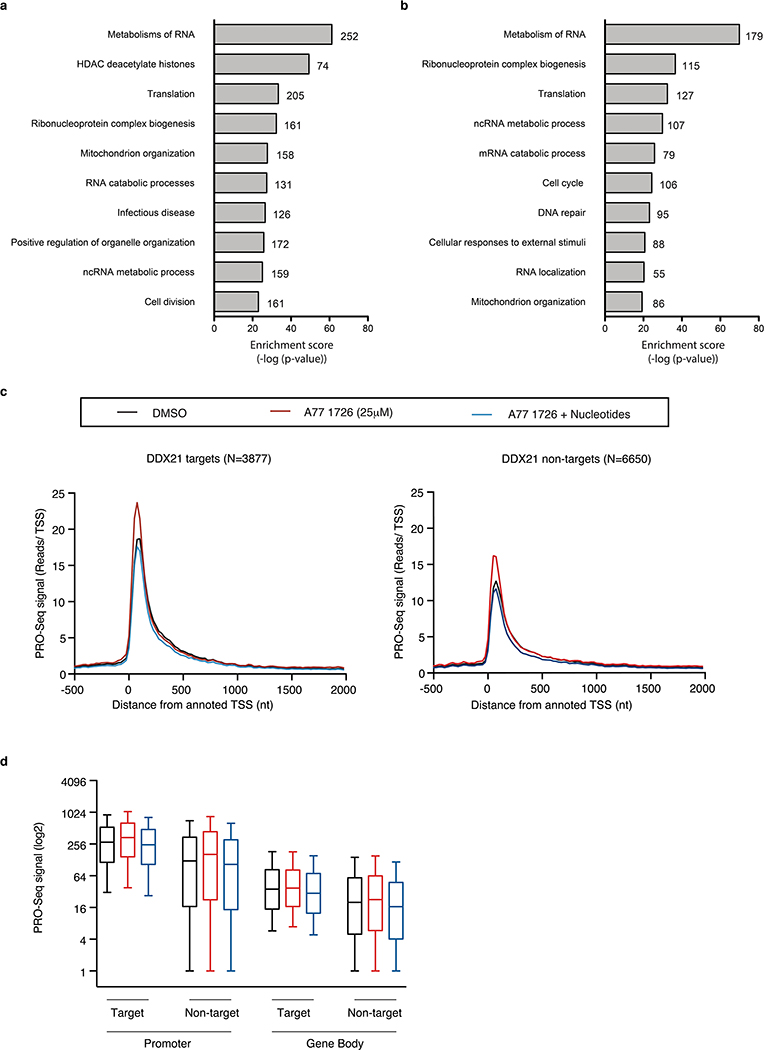
To investigate if reduced genomic occupancy of DDX21 correlates with gene expression changes, we performed RNA-Seq 24 and 48 hours post A77 1726 treatment in A375 cells. We found that majority of transcriptional changes occur 48 hours after DHODH inhibition. More specifically, 32% of the genome was at least 2-fold downregulated while 17% of genes showed significant upregulation (Fig. 5b, Supplementary Table 8). Analysis of genes downregulated at 48 hours revealed high enrichment for genes involved in RNA metabolic processes (Extended Data Fig. 8a). Nucleotide supplementation restores the gene signature imposed by A77 1726, indicating that the transcriptional changes originate from nucleotide stress (Fig. 5c).
We then compared DEGs at 48 hours to genes displaying reduced chromatin occupancy of DDX21 at 24 hours post A77 1726 treatment. We observed that 45% of the downregulated genes show loss of DDX21 binding during nucleotide depletion (Fig. 5d). Gene set analysis of downregulated DDX21 targets uncovers enrichment in genes associated with RNA metabolism and the cell cycle (Extended Data Fig. 8b). The data show that loss of DDX21 binding precedes transcriptional downregulation of genes such as CSTF2 (mRNA processing) and CCNB1 (cell cycle) under nucleotide stress. These observations could explain the transcriptional and proliferative defects seen in neural crest and melanoma after DHODH inhibition1,9.
To test if loss of DDX21 and CDK9 from chromatin impacts promoter-proximal pausing, we performed PRO-Seq in A375 cells 24 hours post A77 1726 treatment26. Consistent with a broad increase in transcriptional pausing, we observed a genome-wide increase in signal at the promoter region. No changes within the gene body were found (Extended Data Fig. 8c–d). The PRO-Seq data suggests that the increased Pol II pausing that is occurring at 24 hours after treatment underlies the transcriptional downregulation seen at 48 hours. Due to its strong interaction with CDK919, we hypothesize that DDX21 sequesters CDK9 from chromatin following nucleotide depletion. This could drive the observed genome-wide loss of CDK9 under nucleotide stress. Consequent increases in Pol II pausing lead to transcriptional defects driving cell cycle arrest. In summary, limited nucleotide pools reduce expression of DDX21-bound genes.
Here, we employed an in vivo chemical suppressor screen in zebrafish to find drugs that confer resistance to DHODH-mediated nucleotide stress and subsequent transcriptional defects. While we do not distinguish between cell autonomous and non-cell autonomous effects of leflunomide, we consider both mechanisms to play a role. We found that alterations in progesterone and Pgr signalling lead to neural crest resilience when nucleotide pools are limited. Progesterone can bypass the elongation block induced by DHODH inhibition or Paf complex deficiency in vivo. We suggest that downregulation of Pgr reduces transcriptional activity of the receptor hereby ameliorating effects due to low abundance of nucleotides. We found that Pgr interacts with Ddx21 and propose that Ddx21 acts as a mediator between nuclear hormone signalling and the nucleotide stress response. Competition between the two signals could occur when both nucleotide stress and progesterone are present. In vitro, DDX21, together with CDK9, falls off chromatin to prevent transcription elongation when nucleotide levels are limited. Upon treatment with progesterone, DDX21 activity could be skewed toward its function in nuclear hormone signalling. We hypothesize that the presence of both progesterone and nucleotide depletion restores the interaction between DDX21 and CDK9 on chromatin thereby re-establishing efficient transcription and rescuing the neural crest lineage. Additionally, our study reveals a function for DDX21 as a sensor of nucleotide pools and mediator of transcription during nucleotide stress. DDX21 occupancy is lost at Pol II, but not Pol I (rDNA) targets when nucleotide pools are limited. This shows that polymerase I and II hold intrinsic differences in their response to changes in nucleotide levels. While ribosomal genes are affected by nucleolar stress20, cell cycle genes are affected by nucleotide stress through Pol II-mediated transcriptional effects. Patients undergoing chemotherapy regimens that target nucleotide metabolism often develop resistance27. Work in this study suggests that modulating DDX21 levels could be an attractive therapeutic strategy to delay disease progression.
Methods
Zebrafish handling
Zebrafish were handled according to the vertebrate animal protocol as approved by the Harvard University Animal Care Committee. Strains used are AB (wild-type) and paf1(alnz24) mutants.
Chemical screen and drug treatment
Wild-type zebrafish embryos were treated with leflunomide from 50% epiboly until 24 hours post-fertilization in E3 embryo media and fixed with 4% Formaldehyde. Chemical libraries screened: LOPAC (n= 1280), ICCBL (n= 480) and NIH clinical collection (n=450). Other chemical used include leflunomide (Sigma L5025), Progesterone (Sigma, P0130), Esomeprazole (Enzo life sciences), Aphidicolin (Enzo life sciences, BML-CC101–0001) and A77 1726 (Enzo Life Sciences, ALX-430–096-M025). For nucleotide rescue experiments, a cocktail of 10 μg/ml uridine 5′-monophosphate (Sigma, UMP) and 10 μg/ml cytidine 5′-monophosphate (Sigma, CMP) was added to A77 1726. For in situ hybridizations, we followed the methods as described by Thisse C, and Thisse, B28,29.
Cell culture and generation of A375-iPRG (PRB) line
A375 cells (ATCC) and T47D cells (ATCC) were grown in DMEM or RPMI with 10% fetal bovine serum, 1X GlutaMAX and 1% Penicillin-Streptomycin. The full-length human PRB CDS was cloned into a pENTD (Life technologies) from a vector kindly provided by Brown Myles via Gateway recombination (Invitrogen). The primers used are F: caccATGACTGAGCTGAAGGCAAAGGG, R: CTTTTTATGAAAGAGAAGGGGTTTCAC (Supplementary Table 9). Subsequently PRB was subcloned to add a myc-tag using F: caccATGACTGAGCTGAAGGCAAAGGG, R: CTATAGTTCTAGAGGCTCGAGAG. The pENTD vector containing myc-tagged PRB was cloned into the pHage vector via Gateway recombination. Lentiviral particles were produced by co-transfection of 293T cells (ATCC) with sequence verified pHage-PRB and packaging plasmids pMD2.G (Addgene, #12259) and psPAX2 (Addgene #12260, gifts from Didier Trono), using FuGENE HD (Promega). Viral particles were harvested 48- and 72-hours post-transfection, concentrated by overnight PEG precipitation30, resuspended in PBS, and stored at −80°C. A375 cells were overlaid with viral particles diluted in DMEM/1x Glutamax with 10% TET System Approved FBS (Clontech) and supplemented with 5 μg/ml polybrene (Sigma) for 24 hours at 37°C. 48 hours post-transduction, infected cells were selected with 500 μg/ml G418 (Gibco) for 7 days. Cell line is available upon request.
Targeted mass spectrometry and metabolite profile analyses
Targeted mass spectrometry and metabolite analysis were performed as previously described9. In short, samples were re-suspended using 20μL HPLC grade water. 5μL were injected and analysed using a hybrid 5500 QTRAP triple quadrupole mass spectrometer (AB/SCIEX) coupled to a Prominence UFLC HPLC system (Shimadzu) via selected reaction monitoring (SRM) 31. Peak areas from the total ion current for each metabolite SRM transition were integrated using MultiQuant v2.0 software (AB/SCIEX). Spectral counts of metabolites were first normalized to the row average of the DMSO samples, followed by normalization to the median of the entire dataset.
cDNA cloning and in vitro transcription
Danio rerio Pgr cDNA was cloned into pENTR/D-TOPO (Thermo Fisher Scientific) using the following primers: F: CACCATGGACACGGTGAAC, R: CATCAGCGGTTTGACCATTCCTG. Final Destination vector cloning was performed using LR Clonase mix (Thermo Fisher Scientific) and 5’entry p5E-CMV/SP6 vector, 3’entry flag:bio:T2A:gfp vector and a pDestTol2CG2 backbone. The 7mm pgr construct was generated by NEB Q5 mutagenesis using pENTRD-pgr as a template and with the following primers: Q5_F:atacgtcccctgCTGATTCCACTGGGACGGTGACGGG, Q5_R: tgacggtatccatGGTGAAGGGGGCGGCCGC. hsDDX21 (wild-type) was subcloned using BamHI/XhoI into pCS2+ from the original plasmids provided by E. Calo19. Primers used: F:GTCAGGATCCATGCCGGGAAAACTCC, R:CGTACTCGAGTCATCATTGACCAAATGCTT. mRNA was generated using mMESSAGE mMACHINE SP6 Transcription Kit (Life technologies). 1 nanoliter of mRNA mix was injected into 1-cell stage embryos.
Protein extracts Co-IP and mass spectrometry of zebrafish embryos
500 embryos were injected with pgr:flag:T2A:gfp mRNA, treated with the respective chemicals and collected at 15 somites. Embryos were checked for GFP expression, dechorionated, deyolked32 and resuspended in Pierce IP Buffer. Anti-Flag M2 Magnetic beads (Sigma, M8823) were used to pull down Pgr:Flag proteins. Protein complexes were eluted using 3xFlag peptides (Sigma, F4799). Proteins were concentrated by TCA precipitation and loaded on a 10% acrylamide gel. Gel was stained with Colloidal Blue and excised bands were cut into 1 mm3 pieces. Gel pieces were subjected to a modified in-gel trypsin digestion procedure32. Gel pieces were washed and dehydrated with acetonitrile for 10 minutes followed by removal of acetonitrile. Pieces were dried in a speed-vac. Rehydration of the gel pieces was done using 50 mM ammonium bicarbonate solution containing 12.5ng/μl modified sequencing-grade trypsin (Promega) at 4ºC. After 45 min, excess trypsin solution was removed and replaced with 50mM ammonium bicarbonate solution to cover the gel pieces. Samples were placed at 37ºC overnight. Peptides were extracted by removing the ammonium bicarbonate solution, followed by one wash with a solution containing 50% acetonitrile and 1% formic acid. The extracts were dried in a speed-vac and samples were stored at 4ºC. On the day of analysis, the samples were reconstituted in 5–10μl of HPLC solvent A (2.5% acetonitrile, 0.1% formic acid). A nano-scale reverse-phase HPLC capillary column was created by packing 2.6 μm C18 spherical silica beads into a fused silica capillary (100 μm inner diameter x ~30 cm length) with a flame-drawn tip. After equilibrating the column each sample was loaded via a Famos auto sampler (LC Packings). A gradient was formed and peptides were eluted with increasing concentrations of solvent B (97.5% acetonitrile, 0.1% formic acid). As peptides eluted, they were subjected to electrospray ionization and entered into an LTQ Orbitrap Velos Pro ion-trap mass spectrometer. Peptides were detected, isolated, and fragmented to produce a tandem mass spectrum of specific fragment ions for each peptide. Peptide sequences were determined by matching to protein databases using Sequest software (v.28 (rev. 12). All databases include a reversed version of the sequences and the data was filtered to a 1–2% percent false discovery rate.
Co-immunoprecipitation (Co-IP)
Cells were washed twice with 1X PBS. Nuclei were isolated with 0.05% Triton in PBS and lysed in nuclei lysis buffer (20mM Hepes-KOH pH7.9, 25% glycerol, 420mM NaCl, 1.5mM MgCl2, 0.2mM EDTA, 0.5mM DTT). 500ug of protein extracts was used and the salt concentration was diluted from 420mM to 150mM NaCl using 20mM Hepes-KOH pH7.9, 20% glycerol, 0.25mM EDTA, 0.05% NP-40. Cell lysates were pre-cleared with non-antibody bounds beads for 1 hour at 4°C. Antibody bounds protein G Dynabeads were added to pre-cleared lysate and samples incubated overnight at 4°C. Antibodies used: IgG (Cell Signalling #2729), Progesterone Receptor B (C1A2), Cell Signalling #3157) and DDX21 (Novus Biologicals NB100–1718). Protein-bead complexes were then washed 5 times with wash buffer (20mM Hepes-KOH pH7.9, 10% Glycerol, 150mM NaCl, 1.5 MgCl2, 0.2mM EDTA, 0.5mM DTT) and beads were boiled in 50μL Laemmli Buffer for 15min at 95°C to elute proteins.
Western blotting and immunofluorescence stainings
A375 cells were treated for 24 hours, washed in 1X PBS, and collected in RIPA buffer with protease and phosphatase inhibitors. Samples were run on acrylamide gel and transferred onto a nitrocellulose membrane. Membrane was blocked for one hour in 5% of milk or TBS-T and incubated overnight at 4ºC with anti-DDX21 (Novus Biologicals NB100–1718, 1:3000), Progesterone Receptor B (C1A2), Cell Signalling #3157, 1:1000) or anti-actin (Abcam, ab14128, 1:1000). The next day, membranes were washed, incubated with HRP-conjugated secondary antibodies for 1 hour at RT, and developed with SuperSignal West Pico Plus Chemiluminescent substrate. DDX21 immunostaining was performed and quantified as described previously19 using anti-DDX21 (NBP1–83310, 1:300) and anti-TCOF (NBP1–86909, 1:100). Images were acquired using an Andor Zyla VSC-04746 camera, calibrated at 1.63 μm/px, binning of 1×1 and an exposure of 70ms.
RNA extraction, RT-PCR and qRT-PCR
RNA isolation was performed using Trizol (Life Technologies, 15596–026) and the RNAeasy Kit (Qiagen). cDNA was synthesized with the Superscript Vilo cDNA synthesis kit (Life Technologies, 11754–050).
RT-PCR primers used:
Actin-F: ACCTCATGAAGATCCTGACC
Actin-R: TGCTAATCCACATCTGCTGG
Pgr#1-F: AAAGCTGCTACGACTCCACC
Pgr#1-R: AGACGACATGCGGGACAATT
Pgr#2-F: CAGACAGCATACACCGCATT
Pgr#2-R: GCTGTTGAGGAGGAGGTGAG
ddx21-F: ATCCAGCATGCCGTCAAAGA
ddx21-R: TCAAACAGGTACGAGACGCC
qPCR primers used:
bactin_F: CGAGCAGGAGATGGGAACC
bactin_R: CAACGGAAACGCTCATTGC
sox10_F: ATATCCGCACCTGCACAA
sox10_R: CGTTCAGCAGTCTCCACAG
crestin_F: AGTGCCTGCCAATGTTCAC
crestin_R: CTGAAAAAGGCCGATGAGTT
foxd3_F: CATGCAAAACAAGCCCAAG
foxd3_R: ATGAGGGCGATGTACGAGTAG
mitfa_F: GGCGGTTTAATATCAATGACAGA
mitfa_R: GGTGCCTTTATTCCACCTCA
snail2_F: TTATAGTGAACTGGAGAGTCCAACA
snail2_R: TCCATACTGTTATGGGATTGTACG
neurog1_F: CGTGCCATTATCTTCAACACA
neurog1_R: CGATCTCCATTGTTGATAACCTT
myf5_F: GCTACAACTTTGACGCACAAAA
myf5_R: CACGATGCTGGACAAACACT
qPCR_PGR#1_F: TTCTCGCTGGGTTGGAGAAC
qPCR_PGR#1_R: GCATAGCCAAGCAAAGGTCG
qPCR_PGR#2_F: CAGCATACACCGCATTCTCC
qPCR_PGR#2_R: ACCCTCAACAGCTGTCTTGA
Cell sorting and RNA-sequencing
300 embryos were treated with 7uM leflunomide, 16uM Progesterone or both drugs from 50% epiboly until 15 somites. Embryos were dechorionated with pronase and treated with Liberase. Sox10+ cells were sorted on a BD FACS aria II. 16.5ng of RNA from Sox10+ sorted cells was used for library preparation. For RNA-sequencing of zebrafish and human cells, isolated RNA was subjected to rRNA depletion (Zebrafish: RiboGone, Takara #634847, Human: Epicentre, RZG1224, MRZ11124C). For zebrafish: NGS libraries were generated using the Smarter Low Input and Low input library prep kits (Takara). For human: libraries were prepared using the NEBnext Ultra RNA library prep kit (NEB, E7530S). Libraries were sequenced on Illumina Hi-Seq2000. Quality control of RNA-Seq datasets was performed by FastQC and Cutadapt to remove adaptor sequences and low-quality regions. The high-quality reads were aligned to UCSC build danRer7 for zebrafish or hg19 for human using Tophat 2.0.11 without novel splicing form calls. Transcript abundance and differential expression were calculated with Cufflinks 2.2.1. FPKM values were used to normalize and quantify each transcript; the resulting list of differential expressed genes are filtered by log fold change > 1.
Morpholino injection and pgr overexpression
Morpholinos were obtained from Gene Tools, LLC, and injected into the yolk of 1-cell stage embryos with 2ng MO in 1nl volume. The ctr9 MO has been described by Bai, et al33. Morpholino sequences are:
ctr9 (NM_001083583): GATTTCAATGGATCCCCGAGACATG
pgr (NM_001166335.1): GGAGAAGTGTTCACCGTGTCCATTC
ddx21(ENSDART00000093149.5): ATTCTGGGAGACTCTTTGACGGCAT
100pg of wild-type pgr:flag:T2A:gfp mRNA (wild-type pgr mRNA) or mismatch pgr:flag:T2A:gfp mRNA containing 7 silent mutations (7mm pgr mRNA) was co-injected for MO experiments. For overexpression, 100pg of wild-type pgr:flag:T2A:gfp mRNA was injected.
ChIP-sequencing and analysis
ChIP-Seq was performed as previously described 9,34. A375 cells were treated with 25μM DMSO, 25μM A771726 or 25μM A771726 plus nucleotides. After a 24 hours, cells were fixed in 1% formaldehyde and subjected to Co-IP using DDX21 (Novus Biologicals, NB100–1718) and Cdk9 (Santa Cruz, C-20) antibodies. Libraries were sequenced on Illumina Hi-Seq2000. All datasets were aligned to UCSC build version hg19 of the human genome using Bowtie2 (version 2.2.1) with the following parameters: --end-to-end, -N0, -L20. We used the MACS2 version 2.1.035 peak finding algorithm to identify regions of ChIP-Seq peaks, with a q-value threshold of enrichment of 0.05 for all datasets. The genome-wide occupancy profile figures were generated by deeptools36 using the reference-point mode and the scale-regions mode. The genomic distribution of DDX21 ChIP was plotted using the ChIPSeeker R package, annotatePeak to assign peaks to a genomic annotation, which includes whether a peak is in the TSS, Exon, 5’ UTR, 3’ UTR, Intronic or Intergenic. The genome annotation is from the R-bioconductor annotation packages. To map DDX21 ChIP-seq peak to the rDNA data, we followed published work19. Briefly, we obtained the DNA consensus sequence of the 43Kb ribosomal locus NCBI (GeneBank ID: U13369.1). Using the unique 43Kb region, we used Bowtie to map ChIP-seq reads with standard mapping parameters to the hg19 human genome build. Data was visualized with Integrative Genomics Viewer.
Infrared Crosslinking and Immunoprecipitation (irCLIP) and data analysis
irCLIP was performed as described37. DDX21 (Novus Biologicals, NB100–1718) bound to Protein G Dynabeads (Thermo Fisher Scientific) was used to IP for 8 hours at 4°C. irCLIP data was processed using the irCLIP pipeline (https://github.com/ChangLab/irCLIP/tree/lite). PCR duplicates were removed using unique molecular identifiers (UMI) in the RT primer region. Adapter and barcode sequences were trimmed, and reads were mapped step-wise to repetitive and then non-repetitive (GRCh38) genomes. Specific parameters used for the irCLIP pipeline are as follows: -f 18 (trims 17nt from the 5’ end of the read), -l 16 (includes all reads longer than 16nt), –bm 29 (minimum MAPQ score from bowtie2 of 29 is required for mapping; unique mapping only), and –tr 2,3 (repetitive genome) and –tn 2,3 (non-repetitive genome) RT stop intersection (n,m; where n = replicate number and m = number of unique RT stops required per n replicates). Using the –tr/tn 2,3 parameters, a minimum of 6 RT stops are required to support any single nucleotide identified as crosslinking site.
Whole proteomics: Cell lysis, protein digest and TMT labeling mass spectrometry analysis
Cells were lysed by homogenization in lysis buffer (2% SDS, 150mM NaCl, 50mM Tris pH 7.4). Lysates were reduced with 5mM DTT, alkylated with 15mM iodoacetamide for 30 minutes in the dark, quenched with 50mM fresh DTT and proteins precipitated by methanol/chloroform precipitation. Digests were carried out in 200mM EPPS pH 8.5 in presence of 2% acetonitrile (v/v) with LysC (Wako, 2mg/ml at 1:75) for 3 hours at RT and subsequently trypsinated (Promega, #V5111, stock 1:75) overnight at 37°C. Missed cleavage rate was assayed from a small aliquot by mass spectrometry. For whole proteome analysis, digests containing 60μg of peptide material were directly labelled with TMT reagents. After quenching of TMT labelling reactions with hydroxylamine, TMT labelling reactions were mixed, solvent evaporated to near completion and TMT labelled peptides purified and desalted by acidic reversed phase C18 chromatography. Peptides were then fractionated by alkaline reversed phase chromatography into 96 fractions and combined into 12 samples. Before mass spectrometric analysis, peptides were desalted over Stage Tips38. Data were collected by a MultiNotch MS3 TMT method39 using an Orbitrap Fusion Lumos mass spectrometer (Thermo Fisher Scientific) coupled to an EasynLC1200 HPL system (Thermo Fisher Scientific). The 100μm inner diameter capillary column used was packed with C18 resin (SepPax Technologies Inc., 1.8μm). Peptides of each fraction were separated over 3 hours acidic acetonitrile gradients by LC prior to mass spectrometry (MS) injection. The first scan of the sequence was an MS1 spectrum (Orbitrap analysis; resolution 120,000; mass range 400−1400 Th). MS2 analysis followed collision-induced dissociation (CID, CE=35) with a maximum ion injection time of 150 ms and an isolation window of 0.7 Da. In order to obtain quantitative information, MS3 precursors were fragmented by high-energy collision-induced dissociation (HCD) and analyzed in the Orbitrap at a resolution of 50,000 at 200 Th. Further details on LC and MS parameters and settings used were described recently40. Peptides were searched with a SEQUEST (v.28, rev. 12) based software against the human proteome (Uniprot 02/2014) with added common contaminant proteins. For this, spectra were first converted to mzXML. Searches were performed using a mass tolerance of 50 ppm for precursors, fragment ion tolerance 0.9Da to maximize sensitivity in conjunction with SEQUEST searches and linear discriminant analysis. For the searches maximally 2 missed cleavages per peptide were allowed. We searched dynamically for oxidized methionine residues (+15.9949 Da) and applied a target decoy database strategy and a false discovery rate (FDR) of 1% set for peptide-spectrum matches following filtering by linear discriminant analysis (LDA) and a final collapsed protein-level FDR of 1%. Quantitative information on peptides was derived from MS3 scans. Quant tables were generated requiring an MS2 isolation specificity of >65% for each peptide and a sum of TMT s/n of >150 over all channels for any given peptide and exported to Excel and further processed therein. Details of the TMT intensity quantification method and further search parameters applied were described recently40.
PRO-Seq Analysis
Cells were collected, washed with PBS and washed with wash buffer (10mM Tris-Cl, pH 8.0, 10mM KCl, 250mM sucrose, 5mM MgCl2, 0.5mM DTT, 10% Glycerol). Cells were permeabilized with 0.1% Igepal for 2 minutes at RT, spun and resuspended in freezing buffer (50mM Tris-CL pH 8.3, 40% glycerol, 5mM MgCl2, 0.5mM DTT). Nuclei were counted, and flash frozen. PRO-Seq libraries were generated using 1 million nuclei per sample. Samples were spiked with 40,000 Drosophila S2 cells as normalization control. Samples were sequenced on the NextSeq using a High Output 75-cycle kit to an average depth of 10 million mappable reads per sample. To remove adapter sequence and low quality 3’ ends, we used cutadapt 1.14 to discard reads shorter than 20nt (-m 20 -q 10), and removing a single nucleotide from the 3’ end of all trimmed reads to allow successful alignment with Bowtie 1.2.2. Remaining read pairs were aligned to the Drosophila Dm3 genome index to determine spike-normalization ratios based on uniquely mapped reads. Counts of pairs mapping uniquely to spike-in RNAs were determined for each sample. Depth normalization was used for each bedGraph. Reads mapped to dm3 were excluded from further analysis, and unmapped pairs were aligned to the human hg19 genome. Identical parameters were utilized in each alignment described above (-m1, -v2, -X1000, --un). Pairs mapping uniquely to hg19, representing biotin-labeled RNAs were separated, and strand-specific counts of the 3’-end mapping positions determined at single nucleotide resolution, genome-wide, and expressed in bedGraph format with “plus” and “minus” strand labels, as appropriate. Combined bedGraphs were generated after deduplication by summing counts per nucleotide of all 3 replicates for each condition. Read counts were calculated per gene (from transcription start site to transcription end site), in a strand-specific manner, based on default annotations (Ensembl hg19), using feature Counts. Differentially expressed genes were identified using DESeq2 v1.18.1 under R 3.3.1. PRO-Seq size factors were determined based on spike normalization (for Control: 1.401, 1.365, 1.422; drug-treated: 0.973, 1.158, 0.832; rescued: 1.225, 1.805, 1.089). At an adjusted p-value threshold of p<0.05, 3135 affected genes were identified in A77 1726 treated cells and 2 affected genes in A77 1726 plus nucleotides treated cells, as differentially expressed compared to A375 control cells. UCSC Genome Browser tracks were generated from the combined replicates per condition, normalized as in the differential expression analysis.
Statistics and Reproducibility
Bar graphs represent mean ± s.d. for n = 3 or more independent experiments. Box plots represent median with minima and maxima (relocalization assay) or median with 10th and 90th percentiles (PRO-Seq) for n = 3 experiments. Significance was calculated using two-way ANOVA with Bonferri correction (metabolimics assay), unpaired T-test with Welch correction (pgr qPCR), two-sided Wilcoxon–Mann–Whitney test (relocalization assay), hypergeometric Test (ChIP-seq to RNA-seq overlap) and hypergeometric test and Benjamini-Hochberg correction (Gene Ontology analysis). All statistical analysis was performed using GraphPad Prism 5 (GraphPad Software). For qPCR of sorted sox10+-GFP cells in Extended Data Fig. 3b. The data is from one independent experiment due to limited material. For RT-PCR of pgr during early development in Extended Data Fig. 4a. This data is from one independent experiment as pgr expression during early zebrafish development has been verified previously assessed through in situ hybridization and single-cell RNA-seq in zebrafish embryos by Bertrand, et al. 41 and Wagner, et al. 42, respectively.
Data availability
Deep-sequencing (ChIP-seq, RNA–seq, PRO-seq, irCLIP) data that support the findings of this study have been deposited in the Gene Expression Omnibus (GEO) under accession code GSE128086. Mass spectrometry data have been deposited in ProteomeXchange with the primary accession code PXD014433. All other data supporting the findings of this study are available from the corresponding author on reasonable request.
Reporting summary
Further information on research design is available in the Nature Research Reporting Summary linked to this article.
Extended Data
Extended Data Fig. 1. A chemical suppressor screen for Leflunomide.
(a) Chemical structure of the Leflunomide, the active metabolite of leflunomide known as A77 1726 and an the independent DHODH inhibitor named here iDHODH1, or iDH1. (b) Lateral view of embryos at 24hpf treated with chemicals as indicated and subjected to in situ hybridization for crestin. Number of embryos displaying the indicated phenotype is indicated in the lower right corner. Scale bars represent 200μm. (c) Metabolite profiling in A375 melanoma cells. Upper panel: A375 cells exposed to A77 1726, Esomeprazol or both compounds for 24 hours. Lower panel: cells exposed to A77 1726, Aphidicolin or both chemicals. (n = 3 independent experiments, Mean ± SD, Two-Way ANOVA with Bonferroni Comparison, ** = p < 0.01, *** = p < 0.0001). Source data are available online.
Extended Data Fig. 2. Effects of Leflunomide and Progesterone on neural crest during embryonic development.
(a) In situ hybridization for the neural crest cell markers sox10, foxd3 and pax3 in zebrafish embryos at the 15-somite stage upon treatment with indicated chemicals. (b) Lateral view of embryos subjected to in situ hybridization for crestin at 5, 8, 12 and 15 somites. Number of embryos displaying the presented phenotype is indicated in lower right corner. Scale bars represent 200μm.
Extended Data Fig. 3. Progesterone restores transcriptional changes caused by DHODH inhibition.
(a) Schematic representation workflow to sort neural crest cells, here defined as sox10:GFP positive cells. (b) qPCR on whole embryos, sorted GFP low and sorted GFP high neural crest cells for neural crest (mitfa, foxd3, sox10, crestin, snail2) and non-neural crest (neurogenin and myf5) genes (n = 3 technical replicates, pooled from 1 experiment, Mean ± SD). (c, d) Hierarchical clustering heatmap of genes down-regulated or up-regulated in sox10:GFP high cells sorted from leflunomide-treated zebrafish (c) or ctr9 morphants (d). Differentially expressed genes criteria: log2 fold change ≥ 1.5 or ≤ 1.5. (n = 3 biologically independent experiment). Source data are available online.
Extended Data Fig. 4. Progesterone receptor expression and perturbation effects.
(a) RT-PCR for pgr using two primer sets to reveal receptor expression during early development (1 experiment). (b) GFP positive embryos injected with pgr:flag:T2A:gfp mRNA or mismatched pgr mRNA with a pgr morpholine (MO) reveals MO specificity. Scale bars represent 200μm. (c) In situ hybridization for crestin at 24hpf in control and pgr mRNA injected embryos with or without leflunomide treatment. Number of embryos displaying the phenotype represented is indicated. Scale bars represent 200μm.
Extended Data Fig. 5. DDX21 interacts with PGR and loss of pgr function rescues crestin expression in vivo.
(a, b) DDX21 associates with PGR in A375 melanoma cells containing a doxycycline inducible PGR expression and in T47D breast cancer cells (2 independent biological experiments per cell line). (c) RT-PCR for ddx21 to reveal receptor expression during early development (3 independent experiments). Source data are available online.
Extended Data Fig. 6. DDX21 relocalizes from the nucleolus to the nucleoplasm upon nucleotide depletion.
(a, d) DDX21 and TCOF1 immunofluorescence staining in A375 melanoma cells. Experiment was 4 times repeated independently with similar results. Scale bar represents 100μm. (b, e) Quantification of nucleoli to nucleoplasm ratio (n = 5 sections per condition, Two-sided Wilcoxon-Mann-Whitney test). Box plots represent median value and 25th and 75th percentiles. Whiskers are minima and maxima. Red asterisks indicate outliers. (c) Western blot analysis for DDX21 in A375 cells treated for 24 hours with DMSO, A77 1726 or A77 1726 plus nucleotides. Actin was used as loading control. Immunoblot are representative of at least 2 independent experiments. Source data are available online.
Extended Data Fig. 7. Genome wide annotation for DDX21 bound regions in A375 cells.
(a) Pie chart indicating the location of DDX21 ChIP-Seq peaks relative to gene locations in A375 melanoma cells treated with DMSO for 24hrs. (b). Gene track of DDX21 binding at 14kb rDNA region in A375 melanoma cells treated for 24 hours with DMSO, A77 1726 or and A77 1726 plus nucleotides. Source data are available online.
Extended Data Fig. 8. Gene Ontology analysis and PRO-Seq analysis in A375 cells.
Gene Ontology (GO) term enrichment analysis of genes down-regulated (a) and down-regulated DDX21 target genes (b) in A375 melanoma cells 48 hours post treatment with A77 1726 (n = 3 independent biological experiments, hypergeometric test and Benjamini-Hochberg correction). The number of genes associated to each GO term is shown at the end of each bar within the graph. (c) PRO-seq in A375 cells. Nascent transcription at the transcription start site (TSS) and at the gene body of DDX21 target and not-DDX21 target genes in cells treated for 24hrs with DMSO, A77 1726 or A77 1726 plus nucleotides (n = 3 biologically independent experiments). (d) Box plot of PRO-Seq signal shows no difference of nascent transcription in DDX21-bound and non-bound genes, as no changes are observed in promoter to gene body ratio between DDX21 targets and non-targets. Box plots represent median value and 25th and 75th percentiles. Whiskers are 10th and 90th percentile (n = 3 biologically independent experiments). Source data are available online.
Supplementary Material
Acknowledgments
We thank the following for their support and contribution: E. Fast, A. Choudhuri, and J.M. Ordovas-Montanes for critical reading of our manuscript; M. Rossman, E. Patton, J. Johansson, R. A. Young, and J. Wysocka for discussions about the project; B. Miles, L. Krug, D. Grunwald, S. Spengler, M. Yuan, J. Asara, L. Rubin, A. Avanites, and T. Schlaeger for help with reagents and experiments. This work was supported by NIH grant P50-GM107618 (M.K.), the Hope Funds for Cancer Research (B.J.A.) and the following grants from L.I.Z: Cancer Biology R01 CA103846, NIH Melanoma PPG, P01CA63222, Melanoma Research Alliance, Starr Cancer Consortium grant.
Footnotes
Conflict of Interests
B.J.A. is a shareholder of Syros Pharmaceuticals. L.I.Z. is founder and stockholder of Fate, Inc., Scholar Rock, Camp4 therapeutics and a scientific advisor for Stemgent. The other authors declare no competing interests.
References
- 1.White RM et al. DHODH modulates transcriptional elongation in the neural crest and melanoma. Nature 471, 518–522 (2011). [DOI] [PMC free article] [PubMed] [Google Scholar]
- 2.Lane AN & Fan TW-M Regulation of mammalian nucleotide metabolism and biosynthesis. Nucleic Acids Res. 43, 2466–2485 (2015). [DOI] [PMC free article] [PubMed] [Google Scholar]
- 3.Chabosseau P et al. Pyrimidine pool imbalance induced by BLM helicase deficiency contributes to genetic instability in Bloom syndrome. Nature Communications 2, 368–6 (2011). [DOI] [PubMed] [Google Scholar]
- 4.Liu W et al. Reprogramming of proline and glutamine metabolism contributes to the proliferative and metabolic responses regulated by oncogenic transcription factor c-MYC. Proc. Natl. Acad. Sci. U.S.A 109, 8983–8988 (2012). [DOI] [PMC free article] [PubMed] [Google Scholar]
- 5.Guo J & Price DH RNA polymerase II transcription elongation control. Chemical Reviews 113, 8583–8603 (2013). [DOI] [PMC free article] [PubMed] [Google Scholar]
- 6.Gressel S et al. CDK9-dependent RNA polymerase II pausing controls transcription initiation. eLife 6, R106 (2017). [DOI] [PMC free article] [PubMed] [Google Scholar]
- 7.Peng J, Liu M, Marion J, Zhu Y & Price DH RNA polymerase II elongation control. Cold Spring Harb. Symp. Quant. Biol 63, 365–370 (1998). [DOI] [PubMed] [Google Scholar]
- 8.Adelman K & Lis JT Promoter-proximal pausing of RNA polymerase II: emerging roles in metazoans. Nat. Rev. Genet 13, 720–731 (2012). [DOI] [PMC free article] [PubMed] [Google Scholar]
- 9.Tan JL et al. Stress from Nucleotide Depletion Activates the Transcriptional Regulator HEXIM1 to Suppress Melanoma. Mol. Cell 62, 34–46 (2016). [DOI] [PMC free article] [PubMed] [Google Scholar]
- 10.Luo R, An M, Arduini BL & Henion PD Specific pan-neural crest expression of zebrafish Crestin throughout embryonic development. Dev. Dyn 220, 169–174 (2001). [DOI] [PubMed] [Google Scholar]
- 11.Jurynec MJ et al. The Paf1 Complex and P-TEFb have reciprocal and antagonist roles in maintaining multipotent neural crest progenitors. Development dev.180133 (2019). doi: 10.1242/dev.180133 [DOI] [PMC free article] [PubMed] [Google Scholar]
- 12.Akanuma T, Koshida S, Kawamura A, Kishimoto Y & Takada S Paf1 complex homologues are required for Notch-regulated transcription during somite segmentation. EMBO Rep. 8, 858–863 (2007). [DOI] [PMC free article] [PubMed] [Google Scholar]
- 13.Yoo H-S, Seo J-H & Yoo J-Y CTR9, a component of PAF complex, controls elongation block at the c-Fos locus via signal-dependent regulation of chromatin-bound NELF dissociation. PLoS ONE 8, e61055 (2013). [DOI] [PMC free article] [PubMed] [Google Scholar]
- 14.Cretekos CJ & Grunwald DJ alyron, an insertional mutation affecting early neural crest development in zebrafish. Developmental Biology 210, 322–338 (1999). [DOI] [PubMed] [Google Scholar]
- 15.Rainger J et al. Miller (Genee-Wiedemann) syndrome represents a clinically and biochemically distinct subgroup of postaxial acrofacial dysostosis associated with partial deficiency of DHODH. Hum. Mol. Genet. 21, 3969–3983 (2012). [DOI] [PubMed] [Google Scholar]
- 16.Read LD, Snider CE, Miller JS, Greene GL & Katzenellenbogen BS Ligand-modulated regulation of progesterone receptor messenger ribonucleic acid and protein in human breast cancer cell lines. Molecular Endocrinology 2, 263–271 (1988). [DOI] [PubMed] [Google Scholar]
- 17.Diep CH, Ahrendt H & Lange CA Progesterone induces progesterone receptor gene (PGR) expression via rapid activation of protein kinase pathways required for cooperative estrogen receptor alpha (ER) and progesterone receptor (PR) genomic action at ER/PR target genes. Steroids 114, 48–58 (2016). [DOI] [PMC free article] [PubMed] [Google Scholar]
- 18.Botos J, Xian W, Smith DF & Smith CL Progesterone receptor deficient in chromatin binding has an altered cellular state. J. Biol. Chem 279, 15231–15239 (2004). [DOI] [PubMed] [Google Scholar]
- 19.Calo E et al. RNA helicase DDX21 coordinates transcription and ribosomal RNA processing. Nature 518, 249–253 (2015). [DOI] [PMC free article] [PubMed] [Google Scholar]
- 20.Calo E et al. Tissue-selective effects of nucleolar stress and rDNA damage in developmental disorders. Nature 554, 112–117 (2018). [DOI] [PMC free article] [PubMed] [Google Scholar]
- 21.Xing Y-H et al. SLERT Regulates DDX21 Rings Associated with Pol I Transcription. Cell 169, 664–678.e16 (2017). [DOI] [PubMed] [Google Scholar]
- 22.Valvezan AJ et al. mTORC1 Couples Nucleotide Synthesis to Nucleotide Demand Resulting in a Targetable Metabolic Vulnerability. Cancer Cell 32, 624–638.e5 (2017). [DOI] [PMC free article] [PubMed] [Google Scholar]
- 23.Sarkar M & Ghosh MK DEAD box RNA helicases: crucial regulators of gene expression and oncogenesis. Front Biosci (Landmark Ed) 21, 225–250 (2016). [DOI] [PubMed] [Google Scholar]
- 24.Sloan KE et al. The association of late-acting snoRNPs with human pre-ribosomal complexes requires the RNA helicase DDX21. Nucleic Acids Res. 43, 553–564 (2015). [DOI] [PMC free article] [PubMed] [Google Scholar]
- 25.Song C, Hotz-Wagenblatt A, Voit R & Grummt I SIRT7 and the DEAD-box helicase DDX21 cooperate to resolve genomic R loops and safeguard genome stability. Genes & Development 31, 1370–1381 (2017). [DOI] [PMC free article] [PubMed] [Google Scholar]
- 26.Kwak H, Fuda NJ, Core LJ & Lis JT Precise maps of RNA polymerase reveal how promoters direct initiation and pausing. Science 339, 950–953 (2013). [DOI] [PMC free article] [PubMed] [Google Scholar]
- 27.Luengo A, Gui DY & Vander Heiden MG Targeting Metabolism for Cancer Therapy. Cell Chem Biol 24, 1161–1180 (2017). [DOI] [PMC free article] [PubMed] [Google Scholar]
Methods References
- 28.Thisse C & Thisse B High-resolution in situ hybridization to whole-mount zebrafish embryos. Nat Protoc 3, 59–69 (2008). [DOI] [PubMed] [Google Scholar]
- 29.Thisse B & Thisse C In situ hybridization on whole-mount zebrafish embryos and young larvae. Methods Mol. Biol 1211, 53–67 (2014). [DOI] [PubMed] [Google Scholar]
- 30.Kutner RH, Zhang X-Y & Reiser J Production, concentration and titration of pseudotyped HIV-1-based lentiviral vectors. Nat Protoc 4, 495–505 (2009). [DOI] [PubMed] [Google Scholar]
- 31.Yuan M, Breitkopf SB, Yang X & Asara JM A positive/negative ion-switching, targeted mass spectrometry-based metabolomics platform for bodily fluids, cells, and fresh and fixed tissue. Nat Protoc 7, 872–881 (2012). [DOI] [PMC free article] [PubMed] [Google Scholar]
- 32.Link V, Shevchenko A & Heisenberg C-P Proteomics of early zebrafish embryos. BMC Dev. Biol 6, 1–9 (2006). [DOI] [PMC free article] [PubMed] [Google Scholar]
- 33.Bai X et al. TiF1-gamma plays an essential role in murine hematopoiesis and regulates transcriptional elongation of erythroid genes. Developmental Biology 373, 422–430 (2013). [DOI] [PMC free article] [PubMed] [Google Scholar]
- 34.Batsché E, Yaniv M & Muchardt C The human SWI/SNF subunit Brm is a regulator of alternative splicing. Nature Structural & Molecular Biology 13, 22–29 (2006). [DOI] [PubMed] [Google Scholar]
- 35.Zhang Y et al. Model-based analysis of ChIP-Seq (MACS). Genome Biol. 9, R137–9 (2008). [DOI] [PMC free article] [PubMed] [Google Scholar]
- 36.Ramírez F et al. deepTools2: a next generation web server for deep-sequencing data analysis. Nucleic Acids Res. 44, W160–5 (2016). [DOI] [PMC free article] [PubMed] [Google Scholar]
- 37.Zarnegar BJ et al. irCLIP platform for efficient characterization of protein-RNA interactions. Nature Methods 13, 489–492 (2016). [DOI] [PMC free article] [PubMed] [Google Scholar]
- 38.Rappsilber J, Friesen WJ, Paushkin S, Dreyfuss G & Mann M Detection of arginine dimethylated peptides by parallel precursor ion scanning mass spectrometry in positive ion mode. Anal. Chem. 75, 3107–3114 (2003). [DOI] [PubMed] [Google Scholar]
- 39.McAlister GC et al. MultiNotch MS3 enables accurate, sensitive, and multiplexed detection of differential expression across cancer cell line proteomes. Anal. Chem 86, 7150–7158 (2014). [DOI] [PMC free article] [PubMed] [Google Scholar]
- 40.Paulo JA et al. Quantitative mass spectrometry-based multiplexing compares the abundance of 5000 S. cerevisiae proteins across 10 carbon sources. J Proteomics 148, 85–93 (2016). [DOI] [PMC free article] [PubMed] [Google Scholar]
- 41.Bertrand S et al. Unexpected novel relational links uncovered by extensive developmental profiling of nuclear receptor expression. PLoS Genet. 3, e188 (2007). [DOI] [PMC free article] [PubMed] [Google Scholar]
- 42.Wagner DE et al. Single-cell mapping of gene expression landscapes and lineage in the zebrafish embryo. Science 360, 981–987 (2018). [DOI] [PMC free article] [PubMed] [Google Scholar]
Associated Data
This section collects any data citations, data availability statements, or supplementary materials included in this article.
Supplementary Materials
Data Availability Statement
Deep-sequencing (ChIP-seq, RNA–seq, PRO-seq, irCLIP) data that support the findings of this study have been deposited in the Gene Expression Omnibus (GEO) under accession code GSE128086. Mass spectrometry data have been deposited in ProteomeXchange with the primary accession code PXD014433. All other data supporting the findings of this study are available from the corresponding author on reasonable request.


