

Abstract
Ovarian cancer is a major health problem for women in the United States. Despite evidence of considerable heterogeneity, most cases of ovarian cancer are treated in a similar fashion. The molecular basis for the clinicopathologic characteristics of these tumors remains poorly defined. Whole genome expression profiling is a genomic tool, which can identify dysregulated genes and uncover unique sub-classes of tumors. The application of this technology to ovarian cancer has provided a solid molecular basis for differences in histology and grade of ovarian tumors. Differentially expressed genes identified pathways implicated in cell proliferation, invasion, motility, chromosomal instability, and gene silencing and provided new insights into the origin and potential treatment of these cancers. The added knowledge provided by global gene expression profiling should allow for a more rational treatment of ovarian cancers. These techniques are leading to a paradigm shift from empirical treatment to an individually tailored approach. This review summarizes the new genomic data on epithelial ovarian cancers of different histology and grade and the impact it will have on our understanding and treatment of this disease.
Keywords: gynecologic, malignancies, expression profiling, pathway analysis
Introduction
Ovarian cancer remains an important health problem for women in the United States. It is estimated that there will be 21 650 cases of invasive ovarian cancer resulting in 15 520 deaths in 2008 [1]. Ovarian cancer has the highest case fatality rate of any gynecologic cancer [1], and it is the most common cause of death from cancers of the female genital track [1-4].
The high cases fatality rate results in part from the frequent diagnosis of epithelial ovarian cancer at an advanced stage. There is no effective screening assay for this disease and the symptoms of ovarian cancer are relatively non-specific, including bloating, abdominal distension, and pain [2, 3, 5]. This results in 75% of all cases being diagnosed as advanced, stage III and IV, where the disease has spread throughout the abdomen [1, 6, 7]. Patients with advanced stage disease have a 5-year survival of only 29%. This is in direct contrast to early-stage disease (confined to the ovaries), which has a 5-year survival in excess of 80% [1-3, 6, 7]. Despite these dismal statistics, epithelial ovarian cancer is considered a chemoresponsive tumor with response rates to standard therapy of platinum/taxol in the 80% range [1-3, 6, 7]. Unfortunately most patients develop recurrent disease, which rapidly evolves into chemoresistant disease and the patients become essentially incurable. The mechanism(s) for chemoresistance in this disease remains unknown.
There is a desperate need for a better understanding of the molecular pathogenesis of ovarian cancer so that new drug targets and biomarkers that facilitate better early detection and treatment can be identified. Understanding the molecular basis of ovarian cancer should eventually lead to the development of more specific and effective treatments for patients with this disease.
Heterogeneity of epithelial ovarian cancer: histology and grade
Although the clinical approach to epithelial ovarian cancer is quite uniform, with all patients being treated with standard surgery and chemotherapy, there is in fact considerable clinicopathologic heterogeneity among the tumors. The most common histology of ovarian cancer is papillary serous (50-60% of all cancers), and less common histologies include endometrioid (25%), clear cell (4%), and mucinous (4%) [4]. These tumors have histologic features consistent with various components of the mullerian system, including epithelial glands resembling the fallopian tube (papillary serous), mucinous cysts lined with mucin-secreting cells resembling colonic epithelium (mucinous), glandular structures resembling endometrial epithelium (endometrioid) and clear cell tumors which are thought to resemble components of endometriosis [8]. Visually the tumors appear radically different, yet they are approached in a therapeutically similar fashion despite major differences in clinical behavior. Papillary serous and endometrioid tumors frequently present as advanced stage disease, having spread throughout the abdomen [9]. In contrast, clear cell and mucinous tumors tend to present as tumors limited to one or both of the ovaries and are amenable to complete surgical resection [10, 11]. Even in advanced stage disease, there are notable differences among histology types, with papillary serous and endometrioid tumors being very chemoresponsive (75% response rate) while mucinous and clear cell tumors are considerably more resistant to standard therapy (35% response rate) [10, 12-14].
Ovarian cancer also spans a broad spectrum of histologic grade [9]. A unique feature of ovarian cancer is the subdivision of “low malignant potential” (LMP) tumors, which form one end of the pathologic grade (grade 0) (Figure 1) [9]. These tumors have features of malignancy including nuclear atypia, multiple cellular layers, ant pushing borders [15-17], and yet patients with these tumors even in advanced stage disease have an excellent 5-year survival [16]. Due to these unique features, it has been hypothesized that LMP tumors might be an intermediate or transition lesion between benign cysts and high-grade tumors. In addition, patients with low-grade invasive tumors (grade 1) also seem to have an excellent prognosis although there are limited available data [15-17]. This is in direct contrast to high-grade invasive ovarian cancers (grades 2, 3), which behave much more aggressively, resulting in poor survival [16].
Figure 1.

Photomicrograph of papillary serous ovarian cancer: low malignant potential tumors (A: low power, B: high power) and high-grade invasive carcinoma (C: low power, D: high power).
Clearly, this tumor heterogeneity has a molecular basis. Unfortunately, the underlying biochemical basis for these clinicopathologic differences remains completely unknown. The molecular relationship between these tumors and their origin has not been well characterized. Do they originate from the same precursor cell and what are the transformation events?
Origin of ovarian cancer
The precise origin of epithelial ovarian cancer remains unknown. One of the major stumbling blocks has been the characterization of a mutually agreed upon precursor lesion and the identification of intermediate/transition lesions [18]. For example, there is controversy on whether the surface epithelium of the ovary displays abnormal lesions [19, 20]. The distal fallopian tube also has been thought to harbor the precursor lesions of serous ovarian cancer [21, 22]. Most theories concerning the origin of ovarian cancer hypothesize that the cell of origin resides in the single-cell layer of epithelial cells, which cover the surface of the ovaries. Repeated trauma of this cellular layer by ovulation (incessant ovulation) with subsequent tissue repair has been proposed as a mechanism for the early transformation events for ovarian cancer [8, 18]. This hypothesis is supported by the well-known correlation between total ovulatory cycles and the risk of developing ovarian cancer [18, 23-25]. Further, in vitro models involving rat and mouse ovarian surface epithelial cells in culture demonstrate transformation and chromosomal abnormalities with repeated passaging [26-29]. This hypothesis is also consistent with data demonstrating the interaction of wound-healing cytokines with ovarian cancer [18, 30]. An alternative hypothesis regarding the origin of ovarian cancer includes the development of cancer from inclusion cysts resulting from the pinching off of epithelium post ovulation [18, 31, 32]. The transformation process results from epithelium being located in an abnormal environment where it is exposed to different growth factors and signaling molecules from the stroma (Figure 2). Support for this includes the occasional finding of hyperplastic lesions within these cysts and, again, the correlation with total ovulatory cycles [18, 33].
Figure 2.

Model of the development of an epithelial ovarian tumor. Incessant ovulation and wound repair increases the risk of genetic abnormalities, leading to dysplastic changes in epithelial cells lining the mullerian inclusion cyst. Stromal microenvironment in the forms of activated fibroblast formation, microvessel proliferation, and growth factors contributes to dysplastic formation and eventual malignant transformation.
Other theories concerning the origin of ovarian cancer involve the potential role of hormones. Since in most cases ovarian cancer occurs after menopause, it has been hypothesized that elevated levels of gonadotropins might contribute to the development of ovarian cancer. Several anecdotal cases of the diagnosis of ovarian cancer in women after treatment with clomiphene support this hypothesis [34]. Finally, there has been conjecture that other hormones (e.g. androgens, estrogens, and progesterone) may be involved in the development of ovarian cancer [18, 35-38].
Molecular analysis of ovarian cancer
Efforts from many different laboratories have provided the molecular characterization of individual oncogenes or tumor suppressor genes in ovarian tumors [39], This “gene by gene” analysis, while helpful, has not been able to provide a global mechanistic basis for the clinicopathologic characteristics of these tumors, nor determine the biologic relationship among these different tumors. The development of new genomic technologies provides for the global assessment of molecular events within ovarian cancers. Oligonucleotide microarrays have the capability to determine the expression of all the genes expressed within a cell simultaneously [40-42]. In addition, the gene expression pattern can be correlated with many clinically relevant characteristics of an individual tumor [43, 44]. This powerful approach can be used to characterize the biological relationships among histologic subtypes of ovarian cancer and identify genes whose altered expression is important in the development of ovarian cancer. Further, it has the potential to identify activated pathways and key genes which can be targeted for the effective prevention and treatment of the disease.
Genomic analysis of ovarian cancers: what is “normal”?
As with many cancers of epithelial origin, it is important to establish an appropriate control for evaluating differential gene expression between “normal” and cancer. Expression profiling studies of ovarian cancer have relied on a variety of sources of “normal” cells for comparison with tumors, including whole ovary (WO) samples, ovarian surface epithelium (OSE) exposed to short-term culture, and immortalized OSE cell lines (IOSE) [45]. Each “normal” equivalent has its merit as well as its criticism. Zorn et al. [45] used microarray technology to generate a molecular gene signature of each commonly used “normal” equivalent used for expression profiling studies. Direct comparison of the gene expression profiles generated from OSE brushings, WO samples, short-term cultures of normal OSE (NOSE), IOSE, and telomerase-immortalized OSE (TIOSE) cell lines revealed that these “normal” samples formed robust, but very distinct groups in hierarchical clustering (Figure 3) [45]. These findings emphasize concerns regarding the source of the “normal” controls. Exposing cells to tissue culture conditions significantly alters gene expression, either by directly affecting transcriptional regulation or by selecting for a subset of cells that are not representative of the original culture [45]. The immortalization technique may result in changes to the expression profile in addition to those caused by the culture process itself. The WO samples form a distinct cluster likely due to the large stromal component in the WO profile. The brushing technique allows the collection of OSE without stroma, and provides a relatively pure sample of OSE that is not exposed to culture conditions. The most striking result is the low Pearson correlation coefficient between any two “normal” groups. The majority of genes found in each molecular gene signature comparing “normal” to ovarian tumor were unique to that comparison pair. No gene was found in common to all five normal-cancer comparison lists. These results suggest that the selection of a normal control to compare to epithelial ovarian cancer samples in microarray studies can strongly influence the genes that are identified as differentially expressed. Great care must be given to the research question being addressed and the resulting data interpretation when the “normal equivalent” is not a homogenous population, or has been exposed to external factors that alter its gene expression profile to an extent not normally found in vivo.
Figure 3.
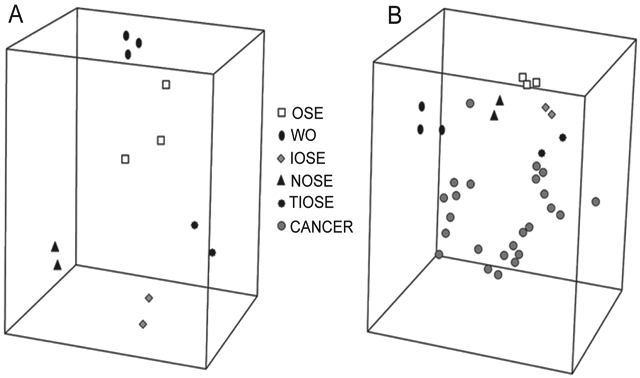
Principle component analysis (PCA) of the expression profiles of ovarian specimens. Samples with similar profiles cluster relatively close. (A) PCA of the normal groups. (B) Unsupervised MDS of the normal groups and the serous ovarian carcinoma samples.
Genomic analysis of ovarian cancers: different histologies
The distinct histologies and the unique clinical phenotypes displayed by epithelial ovarian cancers are hypothesized to be driven by specific genes. The biochemical pathways driven by these genes should distinguish between the various histotypes of ovarian cancer including papillary serous, endometrioid, clear cell, and mucinous. Gene expression profiling has been used to characterize the histotypes of ovarian cancer in order to provide a mechanistic underpinning to the distinct clinicopathologic characterization of these tumors. Additionally, comparisons of gene expression profiles from tumors with similar histotypes across different organs have also been performed to understand the similarities and differences of the transformation processes that produce these tumors.
It is well recognized that tumors of similar histology are found in the ovary and in the endometrium [46]. This raises the hypothesis that there may be similar developmental origins and tumor progression, as well as questions concerning the clinical management of these tumors. Zorn et al. compared 75 gene expression profiles of serous, endometrioid, and clear cell tumor subhistotypes from the ovary and endometrium to determine the similarities and differences between all samples. Principle component analysis (PCA) shows in three-dimensional space the similarities of the gene expression profiles under investigation (Figure 4). An elliptic region for each group represents the area where an additional sample of that type will fall with a 95% confidence level. It is clear by the PCA elliptic regions the serous and endometrioid histotypes from the ovary and endometrium are distinct. The elliptic regions of the ovarian and endometrial clear cell histotypes overlapped. Inclusion of renal clear cell tumors, a third organ with clear cell histotype, showed the renal cell clear tumors were interspersed among the gynecologic tumors. Thus, clear cell cancers did not group according to their organ of origin. Specifically, clear cell tumors from the ovary, endometrium, and kidney were not segregated. Overall these results support the premise that these similar histology tumors from different organs of origin have important gene expression differences, which makes it less likely that they can be clinically managed in an identical fashion [46].
Figure 4.
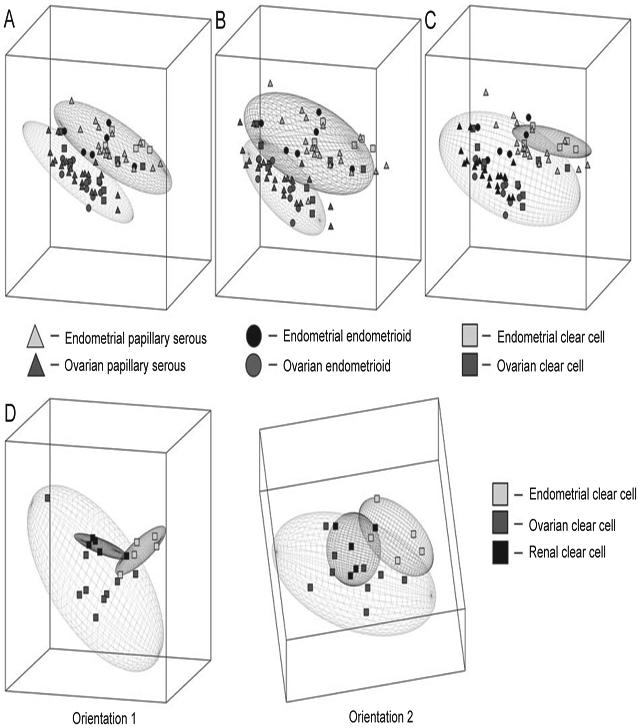
Principle component analysis (PCA) of ovarian and endometrial cancers according to histology. (A) PCA of tumors with serous histology showing two nonoverlapping elliptical regions separating endometrial (top) from ovarian (bottom) specimens. (B) PCA of tumors with endometrioid histology showing two nonoverlapping elliptical regions separating endometrial (top) from ovarian (bottom) specimens. (C) PCA of tumors with clear cell histology showing overlapping elliptical regions representing endometrial (top) and ovarian (bottom) specimens. (D) PCA of tumors according to organ of origin shows three overlapping elliptical regions among ovarian, endometrial, and renal clear cell specimens, with two different orientations (1 and 2).
An extensive microarray analysis of 103 primary ovarian and uterine adenocarcinomas focused on endometrioid and serous histology to determine the contributions of organ of origin and histotype on the tumor gene expression profile [47]. The observed number of differentially expressed genes for serous versus endometrioid expression within ovary histotypes was 62. Of these 62 genes, endometrioid carcinomas in either organ often highly expressed the MSX1, TFF3, SFN, and CEACAM1b genes. Within the endometrioid carcinomas, however, there were statistically significant differences in gene expression between uterine and ovarian tumors. Serous carcinomas in either organ often highly express the FOLR1, PTGS1, WT1, and GAS6 genes. Many of the same genes that were specifically expressed in either serous or endometrioid tumors in the ovary followed the pattern observed in the uterus. This also suggests that, although endometrioid carcinomas in the uterus and ovary might share some molecular defects, there are likely some additional organ-specific factors that contribute to the gene signature of a given endometrioid carcinoma [47].
Expression profiling on epithelial ovarian cancer of varying histologies has also afforded the elucidation of genes which contribute to the biological and clinical features seen in the four major histological types of ovarian carcinoma [46-51], Zorn et al. [46] compared the molecular signatures of 24 papillary serous, 11 endometrioid, and nine clear cell ovarian tumors, and Schwartz et al. [49] compared 53 papillary serous, 33 entrometrioid, 10 mucinous, and 8 clear cell ovarian tumors. The resulting unsupervised hierarchical dendogram shows that the mucinous and clear cell histotypes are clearly clustered within their histogroups [46, 49], and the endometrioid and serous histotypes initially group together and then separate into two distinct branches, each dominated by either the endometrial or the serous histotype [46]. The gene signature list from Zorn et al. revealed 166 genes that differentiated the samples into the three subtypes: serous, endometrioid, and clear cell. When clear cell ovarian cancer was compared with non-clear cell ovarian cancer (serous and endometrioid ovarian cancer grouped together), 171 differentially expressed genes were identified, while only 62 and 66 differentially expressed genes were identified for serous and endometrioid cancer when compared to the other histologic subtypes, respectively [46]. In all, 158 genes were found to be histotype specific for the serous, endometrioid, clear cell, and mucinous ovarian cancers in the Schwartz et al. study [49]. Of these 158 genes, 73 genes were clear cell histotype-specific, 64 genes were mucinous histotype-specific, and 19 and 2 genes were specific for serous and endometrioid, respectively [49]. These results demonstrated that there were larger genomic differences between clear cell and non-clear cell tumors and between mucinous and nonmucinous tumors than among the serous and endometrioid histotypes [46, 49].
Clear cell and mucinous histologies have distinct molecular signatures that differentiate them from other histologies [46, 49]. For clear cell tumors, there is a small set of differentially expressed genes common to tumors from all organs and these included TFPI2 (tissue factor pathway inhibitor), ANXA4 (Annexin), UGT1A1 (UDP glycosyltransferase1 family, polypeptideA1), FXYD2 (FXYD domain containing ion transport regulator 2), GLRX (Glutaredoxin), KIAA1922 (KIAA1922 protein), MAP3K5 (mitogen-activated protein kinase kinase kinase 5), CXADR(Coxsackievirus and adenovirus receptor), and RFX5 (regulatory factor X, 5) [46]. Superoxide dismutase (SOD2), glutathione peroxidase 3 (GPX3), retinol binding protein 4 (RBP4), TFPI2, FXYD2, GLRX, and ANXA4 were also found to be associated with ovarian and endometrial clear cell cancer [49], overlapping with genes identified in the study by Zorn et al. [46]. This overexpression of certain types of genes in the clear cell histotype may also provide insights into their disproportionately poor prognosis relative to other types of ovarian cancer. Two of these genes have intriguing associations with chemotherapy response: ANXA4 has been associated with paclitaxel resistance, whereas UGT1A1 detoxifies the active metabolite of irinotecan [52, 53]. GPX3, GLRX, and SOD2 have all been implicated in oxidative stress response and particularly high levels of these and other antioxidant proteins in clear cell histotypes may render these tumors more resistant to chemotherapy [49]. The finding that FXYD2, GLRX, ANXA4, UGT1A1, and MAP3K5 also dominated the list of genes that distinguish the histosubtypes in both ovarian and endometrial organs reinforces the premise that a set of genes exists that defines the clear cell histotype [46]. The sum total of clinical and biological effects of these genes is to increase apoptotic signals (ASK1/GLRX), inhibit cellular proliferation (TFP12) and increase resistance to chemotherapeutic agents (ANXA4 and UGT1A1), which is consistent with the slow growth and relative chemoresistance of clear cell tumors.
Mucinous ovarian cancer could be clearly distinguished from the other subtypes of ovarian cancer by its expression profile [49-51]. Using the Affymetrix Human genome U133 Plus 2.0 genechip oligonucleotide array, Wamunyokoli et al. [50] performed an extensive study of ovarian mucinous cancer of varying grade. Global gene expression profiling of 25 microdissected mucinous tumors, 6 cystadenomas, 10 mucinous LMP tumors, and 9 adenocarcinoma mucinous ovarian tumors identified 1 599 differentially expressed genes in the cystadenomas, 2 916 differentially expressed genes in LMP tumors, and 1 765 differentially expressed genes in adenocarcinomas, compared to normal ovarian epithelial cells [50]. Heirarchical clustering showed that all mucinous tumors clustered closely together, distinct from NOSE and serous histotypes [50]. Detailed analysis of deregulated genes in mucinous ovarian cancer highlighted specific activated pathways involved in drug resistance and ones involving cell adhesion, signaling, proliferation, and apoptosis. Specifically, genes comprising the pathways implicated in the development of multidrug resistance (ABCC3 and ABCC6), signal transduction (SPRY1 and CAV-1), cytoskeleton rearrangement/signal transduction (RAC1, CDC42, RALA, IQGAP2, Cortactin), cell cycle regulation and proliferation (CCND1, ERBB3, transforming growth factor-α), and transformation (c-JUN, K-ras2, ECT2, YES1) were found to be differentially regulated [50]. Genes involved in cytoskeletal regulation were also specifically up-regulated in the mucinous adenocarcinoma [50]. Another smaller study evaluating the genetic basis of the mucinous histology among 49 primary ovarian cancers was performed using a customized oligonucleotide microarray containing >59 000 probe sets [51]. Seven (14%) of the ovarian cancers were of mucinous histotype: three invasive carcinomas, all stage I, and four mucinous borderline tumors. Mucinous ovarian cancer expressed genes characteristic of mucinous carcinomas of varying epithelial origin, including intestinal carcinomas [51]. In particular, galectin 4 (LGALS4) was highly and specifically expressed in mucinous cancers, but expressed at lower levels in benign mucinous cysts and borderline tumors, supporting a malignant progression model of mucinous cancers [50, 51]. Hence LGALS4 may have application as an early and differential diagnostic marker of mucinous ovarian cancers.
To identify potential genes involved in the carcinogenesis of individual histologic types of ovarian cancers, Zorn et al. [46] performed separate comparisons of each ovarian histologic subtype to NOSE brushings. These comparisons yielded lists of 94 genes for clear cell cancer, 422 genes for endometrioid cancer, and 467 genes for serous cancer [46], Forty-three genes were common to all three lists and therefore displayed consistent differential expression between NOSE and ovarian cancer regardless of histologic subtype. Twenty-nine genes have increased expression in ovarian cancer compared with NOSE, whereas 14 have decreased expression in ovarian cancer compared to normal. Among the genes with increased expression in cancer are homogentisate oxidase (HGD), peroxisome proliferative activated receptor gamma (PPARγ), v-rel reticuloendotheliosis viral oncogene homologue B (RELB), and p21-activated kinase 1 (PAK1) [46]. Decreased expression was documented for tenascin XB (TNXB), galectin 8 (LGALS8), post-meiotic segregation increased 2-like 8 and 2-like 9 (PMS2L8 and PMS2L9), deafness autosomal dominant 5/inversely correlated with estrogen receptor expression 1 (DFNA5/ICERE1), disabled homologue 2/differentially expressed in ovarian cancer 2 (DAB2/DOC2), and retinoic acid receptor responder 1 (RARRES1/TIG1) [46].
In conclusion, serous, endometrioid and mucinous histotypes appear to have unique gene expression signatures. These differences in gene expression could be exploited in the treatment of these individual tumors. By recognizing and exploiting these differences, prolonged survival from epithelial ovarian cancer might be achieved.
Genomic analysis of ovarian tumors: different grade
As noted earlier, epithelial ovarian cancers are divided into several grades according to degree of tumor differentiation. The spectrum of disease ranges from benign tumors to LMP to invasive grade I, II, and III tumors. There is substantial debate on whether LMP tumors are precursors of high-grade invasive tumors or represent a separate disease. Since microarray technology allows for the identification and subclassification of tumors based on their distinct molecular signatures, this technology is very appropriate to address the molecular differences of tumors of varying grades. Gene expression profiling from several groups shows that LMP and grade I serous tumors share a similar molecular fingerprint and may lie on the same developmental continuum, and that low-grade and high-grade tumors develop along two different pathways [48, 54-59].
Two large expression profile studies showed that LMP tumors were distinct from high-grade serous tumors, and the molecular profile of low-grade tumors was more similar to LMP tumors than to the high-grade serous tumors [48, 57]. The larger gene expression profiling study also used microdissected tumor samples including 10 NOSE and 80 ovarian tumors (20 LMP tumors, 6 grade I serous tumors, and 54 grade III tumors) [48]. The other gene expression profiling study analyzed 57 tumors representing 8 LMP and 49 serous tumors from 44 patients of varying grades (7 grade I, 17 grade II, 20 grade III) [57].
Bonome et al. demonstrated LMP tumors were distinct from high-grade tumors by unsupervised hierarchical clustering, binary tree prediction, and global gene expression analyses. In total, 14 119 informative probe sets were used for unsupervised hierarchical clustering of all samples and the resulting dendogram structure had two distinct arms (Figure 5). In the first arm, NOSE specimens grouped separately from LMP tumors and grade I tumors, and the second arm contained the high-grade tumors. Alignment of grade I tumors with LMP tumors further adds to the argument that LMP tumors and low-grade serous tumors are similar to one another, and distinct from the high-grade serous tumors. Binary tree prediction correctly classified NOSE and tumor samples, and therefore substantiated the dendogram structure. Misclassification rate between LMP tumors and high-grade invasive tumors was negligible (3.7%), indicating a clear discrimination between LMP and high-grade tumors. A 30.8% misclassification rate between the LMP and grade I tumors indicates a similar gene expression profile. Class prediction models were used to develop a gene predictive classifier for LMP, low-grade, and high-grade tumors. When applied to the expression data from an independent set of LMP and low-grade microarrays, the predictive LMP or grade I tumor classifiers could discriminate between high-grade tumors, but not between grade I or LMP tumors [48].
Figure 5.
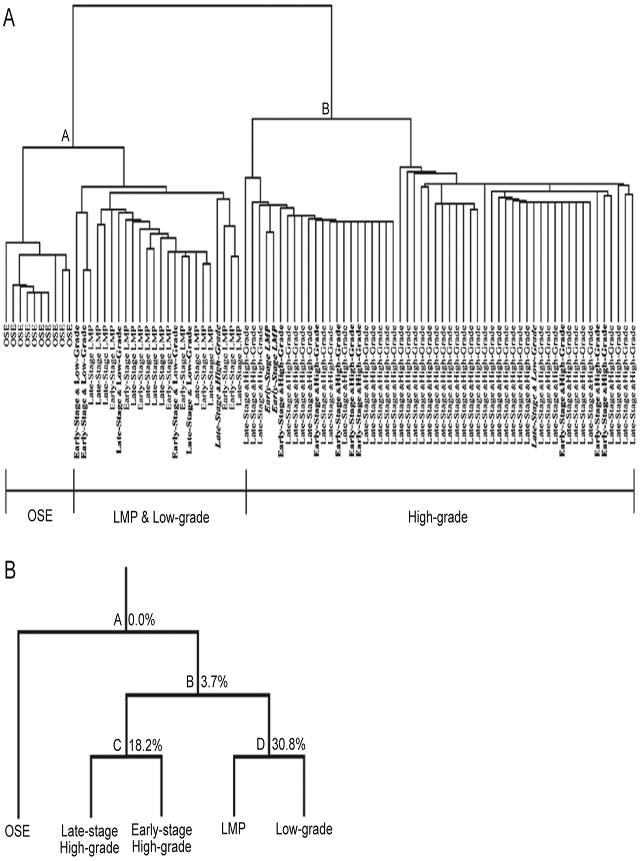
(A) Unsupervised hierarchical clustering analysis of LMP, low-grade, high-grade, and OSE specimens. OSE, LMP, and low-grade tumors grouped along node A and early-stage and late-stage high-grade lesions grouped along node B. OSE clustered separately from LMP and low-grade tumors. LMP and low-grade tumors were indistinguishable from one another. Low-grade and early-stage high-grade samples are indicated in bold. Misclassified specimens are bold italicized. (B) Binary tree prediction followed by leave-one-out cross-validation to estimate the error associated with the tree-building process. LMP tumors and low-grade cancers were more closely aligned to each other, indicated by the high misclassification rate (30.8%), but are distinct from the early-stage and late-stage high-grade tumors with a low misclassification rate (3.7%). Percentages indicate the misclassification error associated with each node.
PathwayAssist signaling pathway analysis and functional GO analysis of differentially expressed genes associated with high-grade tumors identified genes linked to cell proliferation, S and G2-M checkpoint regulation (CCNE1, CDC2, CCNB1, CCNB2), DNA replication (CDC7, MCM helicases), chromosomal instability, motility, and metastasis. Low-grade and high-grade tumors showed differential expression of genes involved in neoplastic transformation (eg PDCD4, EIF4G1). Pathways involved in cell cycle progression, cellular proliferation, and chromosomal instability are clearly absent from the analysis results of LMP and low-grade invasive tumors. LMP tumors, however, were characterized by the p53 growth control pathway and associated genes including UBE2D1, ADNP, PPM1A, FN1, CDKN1A, and RHOA. Polycomb group gene members were down-regulated in LMP and upregulated in high-grade tumors, suggesting that deregulated transcriptional repression may play a role in the development of aggressive tumors. There were also significant signaling pathway differences between the LMP tumors and low-grade tumors. The enhanced p53 signaling activity seen in LMP was not seen in low-grade invasive tumors. Unique to low-grade tumors was the down-regulation of MSN, whose decreased protein levels are linked to loss of epithelial characteristics, allowing the adoption of invasive migratory phenotype. The absence of activated p53 in low-grade tumors may allow for the progression to high-grade tumors, but this is not an obligatory outcome [48].
In the study by Meinhold-Heerlein el al., unsupervised clustering grouped LMP and grade I serous tumors away from grade II/grade III tumors using 5 825 probe sets with the most variable expression. The genes separating the group were predominately ribosomal and are consistent with previous observations segregating LMP or well-differentiated tumors based on genomic expression patterns. A co-cluster of tumors of varying differentiation included one LMP and two grade I lesions. Predictive modeling algorithms were most accurate by grouping LMP and grade I tumors together and by grouping grade and grade III tumors together. A 156-gene group with a FDR of <0.5% in the LMP/grade I versus grade II/grade comparison was found and supports the molecular division between this grouping of tumors. Genes with higher expression in the LMP/grade I group were associated with decreased cellular growth functions, whereas genes with higher expression in the grade II/grade III group were associated with cell cycle regulation, markers of cell proliferation, and mediating JAK/STAT signaling. The gene expression profiles of LMP and grade I tumors were similar, as compared to grade II and grade III tumors, and the grade II and grade III tumor gene expression profiles were similar to one another. The molecular similarities between LMP/grade I and grade II/grade III tumors were reflected in the overall survival of patients in this cohort.
In summary, these gene expression profile studies, and other smaller studies, show that the molecular signatures of LMP tumors are distinct from those of high-grade invasive tumors, but are very similar to those of low-grade tumors [48, 54-59]. Unsupervised hierarchical clustering analysis separates LMPs from high-grade tumors [48, 55, 57, 59], and also grade I from grade III tumors [48, 55-57, 59]. LMP and grade I tumors have similar global gene expression profiles, cluster together, and predictive modeling algorithms fail to correctly distinguish between LMP and grade I tumors [48, 57]. LMP and grade I tumors are characterized by overexpressed genes involved in growth suppression and terminal differentiation [48, 55, 57, 59], and high-grade tumors by overexpressed genes involved in cell proliferation, motility, and metastasis [48, 55, 57, 59]. These data support the hypothesis that LMP tumors and low-grade tumors lie on a similar developmental continuum and develop along a different path from high-grade tumors.
Conclusion
In conclusion, whole genome expression profiling has become a vital tool for identifying mutually reinforcing differentially expressed genes in epithelial ovarian cancers. The global gene expression profiling of epithelial ovarian cancer has identified pathways implicated in cell proliferation, invasion, motility, chromosomal instability, and gene silencing that may contain therapeutic targets relevant to the specific tumor histotype and grade. A molecular mechanistic explanation into the observed clinical phenotypes of the different histotypes and grades is emerging, as well as insights into the origin and progression of ovarian cancer. With this added knowledge of ovarian epithelial tumors provided by global gene expression profiling, individualized ovarian cancer treatment is closer to being realized by integrating the uniform and standard treatment of epithelial ovarian cancer, with additional modifications targeting specific genes and/or pathways to potentially prolong the survival and improve the quality of life of women diagnosed with this disease.
The views expressed herein are those of the authors and do not reflect the official policy or opinion of the Department of Defense or of the United States Army or Navy.
References
- 1.Jemal A, Siegel R, Ward E, et al. Cancer statistics, 2008. CA Cancer J Clin 2008; 58:71–96. [DOI] [PubMed] [Google Scholar]
- 2.Cannistra SA. Cancer of the ovary. N Engl J Med 2004; 351:2519–2529. [DOI] [PubMed] [Google Scholar]
- 3.Bhoola S, Hoskins WJ. Diagnosis and management of epithelial ovarian cancer. Obstet Gynecol 2006; 107:1399–1410. [DOI] [PubMed] [Google Scholar]
- 4.Ozols RF, Rubin SC, Thomas GM, Robboy SJ. Epithelial ovarian cancer In: Hoskins WJ, Young RC, Markman M, Perez CA, Barakat R, Randall M, eds. Principles and Practice of Gynecologic Oncology. Philadelphia, PA: Lippincott Williams & Wilkins, 2005:895–988. [Google Scholar]
- 5.Yawn BP, Barrette BA, Wollan PC. Ovarian cancer: the neglected diagnosis. Mayo Clin Proc 2004; 79:1277–1282. [DOI] [PubMed] [Google Scholar]
- 6.Tummala MK, McGuire WP. Recurrent ovarian cancer. Clin Adv Hematol Oncol 2005; 3:723–736. [PubMed] [Google Scholar]
- 7.Piccart MJ, Bertelsen K, Stuart G, et al. Long-term follow-up confirms a survival advantage of the paclitaxel-cisplatin regimen over the cyclophosphamide-cisplatin combination in advanced ovarian cancer. Int J Gynecol Cancer 2003; 13(Suppl 2): 144–148. [DOI] [PubMed] [Google Scholar]
- 8.Feeley KM, Wells M. Precursor lesions of ovarian epithelial malignancy. Histopathology 2001; 38:87–95. [DOI] [PubMed] [Google Scholar]
- 9.Seidman JD, Kurman RJ. Pathology of ovarian carcinoma. Hematol Oncol Clin North Am 2003; 17:909–925, vii. [DOI] [PubMed] [Google Scholar]
- 10.Kikkawa F, Nawa A, Kajiyama H, et al. Clinical characteristics and prognosis of mucinous tumors of the ovary. Gynecol Oncol 2006; 103:171–175. [DOI] [PubMed] [Google Scholar]
- 11.Tan DS, Kaye S. Ovarian clear cell adenocarcinoma: a continuing enigma. J Clin Pathol 2007; 60:355–360. [DOI] [PMC free article] [PubMed] [Google Scholar]
- 12.Ho CM, Huang YJ, Chen TC, et al. Pure-type clear cell carcinoma of the ovary as a distinct histological type and improved survival in patients treated with paclitaxel-platinum-based chemotherapy in pure-type advanced disease. Gynecol Oncol 2004; 94:197–203. [DOI] [PubMed] [Google Scholar]
- 13.Cloven NG, Kyshtoobayeva A, Burger RA, Yu IR, Fruehauf JP. In vitro chemoresistance and biomarker profiles are unique for histologic subtypes of epithelial ovarian cancer. Gynecol Oncol 2004; 92:160–166. [DOI] [PubMed] [Google Scholar]
- 14.Winter WE III, Maxwell GL, Tian C, et al. Prognostic factors for stage III epithelial ovarian cancer: a Gynecologic Oncology Group Study. J Clin Oncol 2007; 25:3621–3627. [DOI] [PubMed] [Google Scholar]
- 15.Fukumoto M, Nakayama K. Ovarian epithelial tumors of low malignant potential: are they precursors of ovarian carcinoma? Pathol Int 2006; 56:233–239. [DOI] [PubMed] [Google Scholar]
- 16.Berman JJ. Borderline Ovarian Tumor Workshop, Bethesda, Maryland, August 27-28, 2003. Hum Pathol 2004; 35:907–909. [DOI] [PubMed] [Google Scholar]
- 17.Bell DA, Longacre TA, Prat J, et al. Serous borderline (low malignant potential, atypical proliferative) ovarian tumors: workshop perspectives. Hum Pathol 2004; 35:934–948. [DOI] [PubMed] [Google Scholar]
- 18.Mok SC, Kwong J, Welch WR, et al. Etiology and pathogenesis of epithelial ovarian cancer. Dis Markers 2007; 23:367–376. [DOI] [PMC free article] [PubMed] [Google Scholar]
- 19.Barakat RR, Federici MG, Saigo PE, et al. Absence of premalignant histologic, molecular, or cell biologic alterations in prophylactic oophorectomy specimens from BRCA1 heterozygotes. Cancer 2000; 89:383–390. [DOI] [PubMed] [Google Scholar]
- 20.Salazar El, Godwin AK, Daly MB, et al. Microscopic benign and invasive malignant neoplasms and a cancer-prone phenoltype in prophylactic oophorectomies. J Natl Cancer Inst 1996; 88:1810–1820. [DOI] [PubMed] [Google Scholar]
- 21.Crum CP, Drapkin R, Miron A, et al. Die distal fallopian tube: a new model for pelvic serous carcinogenesis. Curr Opin Obstet Gynecol 2007; 19:3–9. [DOI] [PubMed] [Google Scholar]
- 22.Lee Y, Miron A, Drapkin R, et al. A candidate precursor to serous carcinoma that originates in the distal fallopian tube. J Pathol 2007; 211:26–35. [DOI] [PubMed] [Google Scholar]
- 23.Fathalla MF. Incessant ovulation—a factor in ovarian neoplasia? Lancet 1971; 2:163. [DOI] [PubMed] [Google Scholar]
- 24.Casagrande JT, Louie EW, Pike MC, et al. “Incessant ovulation” and ovarian cancer. Lancet 1979; 2:170–173. [DOI] [PubMed] [Google Scholar]
- 25.Pelucchi C, Galeone C, Talamini R, et al. Lifetime ovulatory cycles and ovarian cancer risk in 2 Italian case-control studies. Am J Obstet Gynecol 2007; 196:83 e81–e87. [DOI] [PubMed] [Google Scholar]
- 26.Godwin AK, Testa JR, Handel LM, et al. Spontaneous transformation of rat ovarian surface epithelial cells: association with cytogenetic changes and implications of repeated ovulation in the etiology of ovarian cancer. J Natl Cancer Inst 1992; 84:592–601. [DOI] [PubMed] [Google Scholar]
- 27.Murdoch WJ, Townsend RS, McDonnelAC. Ovulation-induced DNA damage in ovarian surface epithelial cells of ewes: prospective regulatory mechanisms of repair/survival and apoptosis. Biol Reprod 2001; 65:1417–1424. [DOI] [PubMed] [Google Scholar]
- 28.Testa JR, Getts LA, Salazar H, et al. Spontaneous transformation of rat ovarian surface epithelial cells results in well to poorly differentiated tumors with a parallel range of cytogenetic complexity. Cancer Res 1994; 54:2778–2784. [PubMed] [Google Scholar]
- 29.Velicescu M, Yu J, Herbert BS, et al. Aneuploidy and telomere attrition are independent determinants of crisis in SV40-transformed epithelial cells. Cancer Res 2003; 63:5813–5820. [PubMed] [Google Scholar]
- 30.Godwin AK, Testa JR, Hamilton TC. The biology of ovarian cancer development. Cancer 1993; 71(2 Suppl):530–536. [DOI] [PubMed] [Google Scholar]
- 31.Blaustein A Surface cells and inclusion cysts in fetal ovaries. Gynecol Oncol 1981; 12(2 Pt l):222–233. ‘ [DOI] [PubMed] [Google Scholar]
- 32.Cramer DW, Welch WR. Determinants of ovarian cancer risk. II. Inferences regarding pathogenesis. J Natl Cancer Inst 1983; 71:717–721. [PubMed] [Google Scholar]
- 33.Zheng J, Benedict WF, Xu HJ, et al. Genetic disparity between morphologically benign cysts contiguous to ovarian carcinomas and solitary cystadenomas. J Natl Cancer Inst 1995; 87:1146–1153. [DOI] [PubMed] [Google Scholar]
- 34.Steinkampf MP, Dharia SP, Hammond K. Assisted reproducetion in patients with early-stage ovarian malignancies. Fertil Steril 2003; 80:1510–1512. [DOI] [PubMed] [Google Scholar]
- 35.Ho SM, Lau KM, Mok SC, Syed V. Profiling follicle stimulating hormone-induced gene expression changes in normal and malignant human ovarian surface epithelial cells. Oncogene 2003; 22:4243–4256. [DOI] [PubMed] [Google Scholar]
- 36.Lukanova A, Kaaks R. Endogenous hormones and ovarian cancer: epidemiology and current hypotheses. Cancer Epidemiol Biomarkers Prev 2005; 14:98–107. [PubMed] [Google Scholar]
- 37.Risch HA. Hormonal etiology of epithelial ovarian cancer, with a hypothesis concerning the role of androgens and progesterone. J Natl Cancer Inst 1998; 90:1774–1786. [DOI] [PubMed] [Google Scholar]
- 38.Wang PH, Chang C. Androgens and ovarian cancers. Enr J Gynaecol Oncol 2004; 25:157–163. [PubMed] [Google Scholar]
- 39.Zorn KK, Gardner GT, Birrer MJ. The biology of gynecologic cancer In: Hoskins WJ, Young RC, Markman M, Perez CA, Barakat R, Randall M, eds. Principles and Practice of Gynecologic Oncology. Philadelphia, PA: Lippincott Williams & Wilkins, 2005:39–72. [Google Scholar]
- 40.Golub TR. Genomic approaches to the pathogenesis of hematologic malignancy. Cnrr Opin Hematol 2001; 8:252–261. [DOI] [PubMed] [Google Scholar]
- 41.Golub TR, Slonim DK, Tamayo P, et al. Molecular classification of cancer: class discovery and class prediction by gene expression monitoring. Science 1999; 286:531–537. [DOI] [PubMed] [Google Scholar]
- 42.Iyer VR, Eisen MB, Ross DT, et al. The transcriptional program in the response of human fibroblasts to serum. Science 1999; 283:83–87. [DOI] [PubMed] [Google Scholar]
- 43.Carr KM, Rosenblatt K, Petricoin EF, Liotta LA. Genomic and proteomic approaches for studying human cancer: prospects for true patient-tailored therapy. Hum Genomics 2004; 1:134–140. [DOI] [PMC free article] [PubMed] [Google Scholar]
- 44.Chung CH, Levy S, Chaurand P, Carbone DP. Genomics and proteomics: emerging technologies in clinical cancer research. Crit Rev Oncol Hematol 2007; 61:1–25. [DOI] [PubMed] [Google Scholar]
- 45.Zorn KK, Jazaeri AA, Awtrey CS, et al. Choice of normal ovarian control influences determination of differentially expressed genes in ovarian cancer expression profiling studies. Clin Cancer Res 2003; 9:4811–4818. [PubMed] [Google Scholar]
- 46.Zorn KK, Bonome T, Gangi L, et al. Gene expression profiles of serous, endometrioid, and clear cell subtypes of ovarian and endometrial cancer. Clin Cancer Res 2005; 11:6422–6430. [DOI] [PubMed] [Google Scholar]
- 47.Shedden KA, Kshirsagar MP, Schwartz DR, et al. Histologic type, organ of origin, and Wnt pathway status: effect on gene expression in ovarian and uterine carcinomas. Clin Cancer Res 2005; 11:2123–2131. [DOI] [PubMed] [Google Scholar]
- 48.Bonome T, Lee JY, Park DC, et al. Expression profiling of serous low malignant potential, low-grade, and high-grade tumors of file ovary. Cancer Res 2005; 65:10602–10612. [DOI] [PubMed] [Google Scholar]
- 49.Schwartz DR, Kardia SL, Shedden KA, et al. Gene expression in ovarian cancer reflects both morphology and biological behavior, distinguishing clear cell from other poor-prognosis ovarian carcinomas. Cancer Res 2002; 62:4722–4729. [PubMed] [Google Scholar]
- 50.Wamunyokoli FW, Bonome T, Lee JY, et al. Expression profiling of mucinous tumors of the ovary identifies genes of clinicopathologic importance. Clin Cancer Res 2006; 12(3 Pt 1):690–700. [DOI] [PubMed] [Google Scholar]
- 51.Heinzelmann-Schwarz VA, Gardiner-Garden M, Henshall SM, et al. A distinct molecular profile associated with mucinous epithelial ovarian cancer. Br J Cancer 2006; 94:904–913. [DOI] [PMC free article] [PubMed] [Google Scholar]
- 52.Han EK, Tahir SK, Cherian SP, Collins N, Ng SC. Modulation of paclitaxel resistance by annexin IV in human cancer cell lines. Br J Cancer 2000; 83:83–88. [DOI] [PMC free article] [PubMed] [Google Scholar]
- 53.Gagne IF, Montminy V, Belanger P, et al. Common human UGT1A polymorphisms and the altered metabolism of irinotecan active metabolite 7-ethy1-10-hydroxycamptothecin (SN-38). Mol Pharmacol 2002; 62:608–617. [DOI] [PubMed] [Google Scholar]
- 54.Biade S, Marinucci M, Schick J, et al. Gene expression profiling of human ovarian tumours. Br J Cancer 2006; 95:1092–1100. [DOI] [PMC free article] [PubMed] [Google Scholar]
- 55.Gilks CB, Vanderhyden BC, Zhu S, van de Rijn M, Longacre TA. Distinction between serous tumors of low malignant potential and serous carcinomas based on global mRNA expression profiling. Gynecol Oncol 2005; 96:684–694. [DOI] [PubMed] [Google Scholar]
- 56.Jazaeri AA, Lu K, Schmandt R, et al. Molecular determinants of tumor differentiation in papillary serous ovarian carcinoma. Mol Carcinog 2003; 36:53–59. [DOI] [PubMed] [Google Scholar]
- 57.Meinhold-Heerlein I, Bauerschlag D, Hilpert F, et al. Molecular and prognostic distinction between serous ovarian carcinomas of varying grade and malignant potential. Oncogene 2005; 24:1053–1065. [DOI] [PubMed] [Google Scholar]
- 58.Ouellet V, Provencher DM, Maugard CM, et al. Discrimination between serous low malignant potential and invasive epithelial ovarian tumors using molecular profiling. Oncogene 2005; 24:4672–4687. [DOI] [PubMed] [Google Scholar]
- 59.Warrenfeltz S, Pavlik S, Datta S, et al. Gene expression profiling of epithelial ovarian tumours correlated with malignant potential. Mol Cancer 2004; 3:27. [DOI] [PMC free article] [PubMed] [Google Scholar]