

Abstract
Synovial fluid is a potential source of novel biomarkers for many arthritic disorders involving joint inflammation, including juvenile idiopathic arthritis. We first compared the distinctive protein ‘fingerprints’ of local inflammation in synovial fluid with systemic profiles within matched plasma samples. The synovial fluid proteome at the time of joint inflammation was then evaluated across clinical subgroups to identify early disease associated proteins. We measured the synovial fluid and plasma proteomes using the two-dimensional fluorescence difference gel electrophoresis approach. Image analysis software was used to highlight the expression levels of joint and subgroup associated proteins across the study cohort (n = 32). A defined subset of 30 proteins had statistically significant differences (p < 0.05) between sample types such that synovial fluid could be differentiated from plasma. Furthermore distinctive synovial proteome expression patterns segregate patient subgroups. Protein expression patterns localized in the chronically inflamed joint therefore have the potential to identify patients more likely to suffer disease which will spread from a single joint to multiple joints. The proteins identified could act as criteria to prevent disease extension by more aggressive therapeutic intervention directed at an earlier stage than is currently possible.
Keywords: Synovial fluid, Proteomics, Inflammation, Juvenile arthritis
1. Introduction
Around one in every thousand children in the UK suffers from juvenile idiopathic arthritis (JIA) [1]. The worldwide reported incidence varies on a geographical basis, from 0.7 per 1000 in USA to 4.0 per 1000 in Australia [2]. JIA is a heterogeneous group of inflammatory disorders primarily affecting the musculoskeletal system. The most common symptoms of JIA are persistent joint swelling, pain and stiffness. JIA normally affects the load bearing joints of the knee and foot, with movement limited by pain [3]. Adverse outcomes can present to varying degrees regardless of disease subtype, but persistently inflamed joints are a major risk factor [4]. The main outcomes include limitation of joint function, joint structural damage due to erosions and in severe cases disability or death. JIA subtypes vary considerably in the pattern and severity of joint inflammation, disease progression and outcome.
Typically, the course of all subtypes of JIA is one of exacerbations and remissions. However, some may have one or two “flare ups” and never have symptoms again, while others experience repeated “flare ups” or disease that is persistently active into adulthood.
JIA targets the lining of the joint, the synovial membrane, causing inflammation or synovitis [5]. When synovitis persists joint damage may occur. Tissue destruction results from a dysregulation at the molecular level between synthesis and breakdown of the matrix components of joint cartilage [6].
In oligoarticular disease, children are managed with NSAIDs and intra-articular steroid injections to relieve pain and inflammation, slow down or prevent the joint destruction and restore joint function. To effectively manage and minimize the effects of recurrent synovitis however, an early and accurate diagnosis is essential [7]. Successful clinical management can be induced in most (54%) JIA patients with polyarticular disease, using combined anti-inflammatory treatment (NSAID and Methotrexate MTX) [8]. Even so, nearly half the patients will have relapses after treatment is discontinued. The rate of relapses may be influenced by residual synovial inflammation at the time when immunosuppressive treatment is withdrawn. Once the disease is in clinical remission, it is important to know when it is possible to withdraw immunosuppressive drugs, without inducing a flare because of their potentially serious side effects [9]. For a clinician there are three main concerns: maintaining disease remission, prevention and pre-empting disease spread and ultimately averting permanent joint damage and disability. If there was a predictive test that would allow disease progression to be forecast and therefore modify treatment accordingly, significant benefit could be provided to patients.
Although the main clinical manifestation of arthritis is destructive joint inflammation, many other organs may be targeted by the inflammatory process. A holistic view inclusive of local and systemic aspects of the disease is more likely to achieve satisfactory disease resolution. We postulate that biomarkers may exist, which can make a distinction between local and systemic protein expression patterns across the disease subtypes.
To date, there are no means of identifying those apparently clinically inactive patients at special risk of relapse. The current definition of disease activity in JIA is exclusively based on clinical or routine laboratory measures. Consequently, a large proportion of patients may be diagnosed at a relatively advanced stage of the disease, restricting the clinician's ability to modify disease outcome and reducing the efficacy of therapeutic intervention [10].
Traditional acute phase response markers such as C-reactive protein (CRP) and erythrocyte sedimentation rate (ESR) show no significant difference between responders and non-responders to steroids [11]. Even in early disease histopathological study of JIA synovial membranes indicate that patients diagnosed with JIA, exhibit increased vascularity, B and T cell infiltrates and hyperplasia [12]. All these features are evidence of an advanced stage in the inflammatory process. Since samples within the current study are from newly diagnosed patients (< 6 months), we have the potential opportunity to characterize early stage disease.
Work on the proteome of arthritic biological fluids and tissue is in its infancy, with little information available on juvenile disease. It was therefore essential that we undertook preliminary work to demonstrate the power and sensitivity of proteomics to study differentially expressed proteins in fluids from JIA. Our pilot study uncovered fragments of extracellular matrix and T-cell receptor proteins, products of the degradative proteolytic environs of the recurrently inflamed knee [13]. These peptides were observed as indicators of two processes which are likely to be partly interlinked-hypertrophic cartilage breakdown and T-cell infiltration [14].
The predictors and mechanisms of arthritic disease have focused on areas such as T cells, cytokines, fibroblasts, proteases or osteoclasts. What is clear though, is that no single agent or process is wholly responsible, but rather the interaction of these processes resulting in a characteristic protein expression pattern with a particular inflammatory nature. Proteomics is therefore an ideal systems biology approach to examine the multifaceted processes at work in arthritis [15]. In addition multiplex diagnostics are more likely to reflect the true complexity of the arthritis disease process. Fluorescence difference gel electrophoresis (DIGE) was applied in this study as the spectrally distinct Cy dye fluorophores permit multiplexing of corresponding synovial fluid and plasma from an individual patient. The inclusion of an internal pooled standard (composed of all experiment samples), on each gel allows proteome comparisons to be made between patients and biological variation between body fluids to be reliably quantified.
It is reasonable to propose that the most efficient biomarkers for diagnosing or classifying inflammation will be localized within the affected joints. On the other hand it is equally important to assess the systemic molecular foundations of the disease, which may not be clinically apparent. From a practicality viewpoint it is also preferable to be able to quantify biomarkers in plasma as it is more easily accessed with less trauma to children in particular, who may suffer repeated bouts of joint inflammation. The plasma proteome is not only composed of haemostatic proteins confined to the vascular system but also transient secretions of proteins from tissues as a part of normal developmental/aging processes or disease. The proteomic profile of plasma therefore encodes the physiological state of the tissues it is circulated around. However many authors caution that the most meaningful diagnostic plasma proteins are also likely to be found at the lowest abundance, since they are released from tissue into the blood with temporal and spatial restrictions [16]. Moving further upstream of plasma to a biofluid proximal to the disease site is therefore likely to be more fruitful in the initial phases of biomarker candidate discovery.
This study is concerned with revealing protein markers to allow us to not only track the process of inflammation in detail, but more importantly to dissecting out synovial protein expression patterns which may identify more reliable predictors of JIA outcome. We initially performed a study of the proteins expressed within synovial fluid and plasma in early JIA in order to discover novel biomarkers which distinguish between local and systemic components of joint inflammation in arthritis. A subsequent comparison of the synovial proteome across patient subgroups provided evidence that such analysis could be of potential use in patient stratification or even prognosis.
2. Methods
2.1. Patients
Thirty two patients with juvenile idiopathic arthritis (JIA) according to ILAR criteria entered this study. At the time of initial sampling there were 18 children with oligo-articular arthritis and 11 with RF-ve poly-articular arthritis. After a year, 8 oligo-articular had extended disease, with more affected joints than originally assessed, and were therefore reclassified as extended oligo-articular patients. This patient cohort was split into two study groups for proteome comparisons of: (A) synovial fluid versus plasma (n = 10), and (B) JIA subgroups (n = 22). See Table 1 for patient demographics of each study group.
Table 1.
Clinical and demographic characteristics of the study subjects.
| Experiment / comparison |
(A) Body fluid (synovial fluid vs plasma) |
(B) Patient subgroup (oligo vs extended oligo vs poly) |
||||||
|---|---|---|---|---|---|---|---|---|
| Patient subgroup | Oligo | Extended oligo | Poly | Total | Oligo | Extended oligo | Poly | Total |
| Number | 3 | 3 | 4 | 10 | 10 | 5 | 7 | 22 |
| Age (years) | 7.2 ± 0.56 | 7.1 ± 4.75 | 6.1 ± 2.78 | 6.7 ± 2.83 | 7.8 ± 4.15 | 6.0 ± 3.69 | 5.1 ± 2.31 | 6.6 ± 3.60 |
| Male / female (n) | 2/1 | 0/3 | 1/3 | 3/7 | 5/5 | 0/5 | 1/6 | 6/16 |
| Duration of JIA (weeks) | 9.6 ± 7.43 | 12.0 ± 9.00 | 5.6 ± 2.70 | 8.7 ± 6.38 | 7.0 ± 6.50 | 11.8 ± 7.6 | 8.7 ± 6.06 | 8.7 ± 6.57 |
| No. Of swollen joints (n) | 1.3 ± 0.58 | 3.7 ± 0.58 | 4.5 ± 0.58 | 3.3 ± 1.49 | 1.7 ± 0.82 | 4.0 ± 0.71 | 4.0 ± 1.63 | 3.0 ± 1.59 |
| Serum CRP (mg/l) | 8.1 ± 2.76 | 6.3 ± 1.84 | 17.8 ± 16.79 | 11.5 ± 11.27 | 7.5 ± 1.60 | 7.1 ± 2.11 | 13.6 ± 13.14 | 9.4 ± 7.75 |
| ESR (mm/h) | 10.0 ± 10.39 | 7.3 ± 3.06 | 60.3 ± 32.27 | 29.3 ± 32.92 | 10.7 ± 7.15 | 9.8 ± 4.02 | 50.3 ± 31.63 | 23.1 ± 25.93 |
| NSAID (yes/no) | 3/0 | 2/1 | 3/1 | 8/2 | 8/2 | 4/1 | 6/11 | 8/4 |
| DMARD (yes/no) | 0/3 | 0/3 | 0/4 | 0/10 | 0/10 | 2/3 | 0/7 | 2/20 |
| Biologic (yes/no) | 0/3 | 0/3 | 1/3 | 1/9 | 0/10 | 0/5 | 1/6 | 1/21 |
Values are the mean ± standard deviation or the number of subjects. Subgroups descriptors: Oligo = oligoarticular 4 joints or less involved at diagnosis; Poly = polyarticular, 5 joints or more involved at diagnosis; Extended Oligo = patients who become polyarticular 6 months after diagnosis. CRP = C-reactive protein; ESR = erythrocyte sedimentation rate. All study patients were rheumatoid factor negative.
All patients were examined by a consultant rheumatologist, (MR), who confirmed their diagnosis. For the purposes of this study, only initial synovial fluids from children with a disease duration of less than six months were studied.
Intra-articular steroid (Triamcinolone acetonide) injections of the knee were performed with ultrasound guidance, under general anesthetic, with the dose determined by the size of the joint. (Triamcinolone hexacetonide was not available during the time of this study). Clinical details recorded included subtype of JIA, age, sex, disease duration, local and general disease activity and where appropriate -time to local recurrence, ESR and CRP. Local inflammation was defined as both joint swelling and pain on physical examination.
All synovial fluids (SF) were aspirated using an aseptic technique and plasma obtained at the same procedure. The SF and plasma samples were immediately centrifuged at 5000 g for 15 min at 4 °C to remove any particulate or cellular material, aliquoted and stored at − 80 °C until analyzed. Medical Ethics Committee approval was obtained for this study at Green Park Healthcare Trust and patient assent and parent informed consent given.
2.2. Sample preparation
Proteins within patient fluids were extracted and stabilized for 1 h at 4 °C by addition of M-PER® protein extraction reagent (Pierce Biotechnology Inc., Rockford, USA) and a protease inhibitor cocktail (Roche Diagnostics GmbH, Mannheim, Germany). Samples were subsequently dialyzed overnight at 4 °C in distilled water to remove salts, with 3.5 KDa cut-off membrane Slide-A-Lyzer® cassettes (Pierce Biotechnology Inc., Rockford, USA). Each purified patient fluid was snap frozen in liquid nitrogen and lyophilized over night under vacuum on a Christ freeze dryer (Martin Christ GmbH, Osterode am Harz, Germany). Matched synovial fluid and plasma samples were re-hydrated in sample re-hydration buffer (8 M Urea, 2% CHAPS and 0.002% bromophenol blue) (Invitrogen Ltd., Paisley, UK), with gentle agitation to prevent foaming. Protein concentrations were measured using the PlusOne™ 2-D Quant kit according to manufacturer's guidelines (GE Healthcare, Bucks, UK).
2.3. Difference in gel electrophoresis
Electrophoresis was performed with a Ettan™ IPGphor II IEF System, an Ettan™ DALTtwelve Large Vertical System and associated power supply, strips, gels and reagents according to the manufacturer's guidelines (GE Healthcare, Bucks, UK). 50 µg of each synovial fluid and plasma sample were minimally labeled with Cy5 and Cy3 fluorescent dyes according to the manufacturer's recommendations of cross-labelling. An internal pooled standard was generated by combining equal amounts of all matched synovial fluid and plasma samples, followed by Cy2 dye labelling. Equal amounts (50 µg) of Cy5 and Cy3 samples and Cy2 standard were combined and resuspended in an equal volume of 2× sample buffer (8 M Urea, 130 mM DTT, 4% (w/v) CHAPS, 2% (v/v) Pharmalyte™ 4–7). Rehydration buffer (8 M Urea, 13 mM DTT, 4% (w/v) CHAPS, 1% (v/v) Pharmalyte™ 4–7) was added to make up the volume to 450 ml prior to IEF. Each sample was applied to a 24 cm Immobiline DryStrip pH 4–7 linear immobilized pH gradient (IPG) strip and re-hydrated overnight. Previous runs with pH 3–10 carrier ampholytes and IPG strips revealed most of the proteins focused within the pH 4–7 range [15]. The first dimension separation of proteins by isoelectric focusing (IEF) was performed for a total of 75,000 Vh (2 mA/5 W limit per strip) including a final 8000 V step for 1 h to obtain high quality resolution.
After IEF, the strips were equilibrated in equilibration for two 15 minute steps with gentle rocking in 6 M urea, 50 mM Tris pH8.8, 30% (v/v) Glycerol, 2% (w/v) SDS. In the first equilibration step 1% (w/v) dithiotreitol was added as a reducing agent and in the second 2.5% (w/v) iodoacetamide included to reduce protein streaking by alkylation. Post-equilibration, IPG strips were laid into single well 12% PAGE gels (26 × 20 cm; 1 mm thick) and sealed in with 1% agarose (w/v) in running buffer (25 mM Tris, 192 mM Glycine, 0.1% (w/v) SDS and bromophenol blue). The second dimension separation was run at 0.75 W/gel, with temperature control for 19 h, until the bromophenol blue dye front had reached the end of the gel. Two preparative pick gels (to isolate proteins for identification) were loaded with 500 mg of unlabelled protein consisting of an equal amount of each sample. These preparative gels were stained with silver and colloidal Coomassie blue for MALDI-TOF and nESI-MS/MS, respectively.
2.4. Image analysis
Prelabeled proteins were visualized using a Typhoon™ 9410 imager (GE Healthcare, Bucks, UK). The Cy5 images were scanned using a 633 nm laser and a 670 nm band pass (bp) filter; Cy3 images were scanned using a 532 nm laser and a 580 nm bp filter; Cy2 images were scanned using a 488 nm laser and an emission filter of 520 nm. All gels were scanned at 100 nm pixel resolution. The photomultiplier tube was set so pixel intensity remained between 35,000 and 65,000 for any given Cy dye.
Gel analysis was performed with Progenesis Samespots version 2.0 build 2644.18003 (Nonlinear Dynamics Ltd. Newcastle upon Tyne, UK.), software comprising gel warping, DIGE normalization and comparison modules. Briefly a single reference gel was assigned to the gel image with the most spots detected and all remaining gel images were aligned to this reference. The same spot outlines were overlayed onto all images ensuring no data was omitted at this early stage. Landmark spots were used to confirm spot matching across all gels and manual verification of characteristic three-dimensional ‘peaks’ was used to screen out any dust artifacts or incorrectly identified spots. The protein spots in each image were automatically linked between the three Cy dye images per gel. The Cy2 spot intensities (volume) were used to normalize the Cy3 and Cy5 spot volumes. The normalized volume (NV) for each spot on each gel was calculated by the software from the ratio of the volume of the Cy3 (or Cy5) labeled sample to that of the Cy2 labelled internal standard. The progenesis software performs log transformation of the spot volume ratios to generate normally distributed data. Log normalized volume (LNV) was used in quantifying differential expression.
Spots were matched across replicate sample sets and normalized spot volumes were used to create master gels for experimental comparison. For example in study group A ten gel images were combined to create one SF and one plasma ‘master’ gel. Subsequent qualitative subtraction of plasma from matched synovial fluid ‘master’ gels revealed a population of proteins uniquely over-expressed in the joint. Quantitative differential spot analysis was performed on ‘master’ gels from both of the experimental groups. Pairwise comparisons were made to establish synovial fluid-to-plasma, inter-subgroup, inter-patient and Cy3-to-Cy5 dye variations. Within the Samespots review module each comparison was filtered to find the spots (a) with a p value ≤ 0.05 for the paired t-test, (b) having a greater than two-fold change in expression between the groups, and (c) being correctly matched in at least six of the patients. Fold change was calculated as the ratio of the average LNV between study groups.
2.5. Cluster analysis
Quantitative data sets were exported to Excel spread sheet and analysed using Epclust (http://www.bioinf.ebc.ee/EP/EP/EPCLUST/), a generic data clustering, visualization, and analysis tool for genomic or proteomic expression data. Hierarchical analysis allows samples with inter-individual protein expression patterns that are highly similar to be reordered in an agglomerative fashion, using the unweighted pair-group average (UPGMA) clustering procedure. In this method, the distance between two clusters is calculated as the average distance between all pairs of objects in the two different clusters. Euclidean distance was the similarity measure used to group or separate the expression data. The grouping of protein expression levels is presented in the form of heatmap accompanied by dendrograms with trees and branches depicting the extent of similarity between the different groups in the samples.
2.6. Mass spectrometry identification and verification
Protein spots were excised from silver-stained 2D gels and digested by use of the protocol described by [17]. Briefly, the gel spots were washed with 50 mmol/L NH4HCO3/acetonitrile (1:1), followed by dehydration with acetonitrile. The proteins were reduced in 10 mmol/L dithiothreitol/50 mmol/L NH4HCO3 for 1 h at 56 °C and alkylated in 55 mmol/L iodoacetamide/50 mmol/L NH4HCO3 for 2 h at room temperature. The gel pieces were washed several times in 50 mmol/L NH4HCO3, followed by dehydration with acetonitrile. The proteins were digested overnight with trypsin (Promega, modified trypsin) at 37 °C, and the resulting peptide mixtures were analyzed by MALDI-TOF mass fingerprint and/or MALDI-TOF/TOF peptide sequencing at Alphalyse A/S (Odense, Denmark). The instrument used was a MALDI-TOF/TOF Autoflex III from Bruker Daltonics (Bremen, Germany). Mass spectra were acquired in the 500–3000 m/z scan range. The mass accuracy was calibrated to within 50 ppm using calibration standards (standard peptide calibration mix from Bruker Daltonics) before each run. The peaklist was generated with Bruker Daltronics Flexanalysis 3.0 software using the Sophisticated Numerical Annotation Procedure (SNAP) algorithm, a signal to noise ratio of > 3, a quality factor of 20 and median baseline subtraction. The peptide masses obtained were used to query the non-redundant sequence database (NRDB-NCBI 2007.07.06) for protein identification using the Mascot database search program version 2.10.03. A list of excluded contaminant ions and species restriction was not used. The NRDB database contains 4,655,816 entries and is maintained and updated by the European Molecular Biology Laboratory. Database search parameters considered: (i) that the trypsin enzyme cleaves on the C-terminal side of KR unless next residue is P, (ii) no fixed modifications, (iii) carbamidomethyl cysteine and oxidation methionine variable modifications, (iv) up to 1 missed cleavage permitted with no fixed modifications (v) peptide tolerance set at 60 ppm for the precursor ions and (vi) 0.7 Da mass tolerance for the fragment ions. The acceptance criteria for PMF based identifications was a minimum Mascot score of 50, using a 95% confidence interval threshold (p < 0.05). The peptide ions identified in this study by MALDI-TOF and further CID MS/MS analysis independently matched to single protein entries in the database.
Protein identifications were independently verified at Queen's University Belfast by nanoelectrospray-ionization (nESI-MS/MS) from a similar Coommassie colloidal blue stained gel. Digested peptides were extracted in 5% trifluoroacetic acid, 50% acetonitrile in ultrapure water with sonication for 6 min. After a gel pellet was formed by brief centrifugation, the supernatant was desalted using a C18 ZipTip (Pierce Biotechnology Inc., Rockford, USA) and dehydrated in SC 210A Speed Vac vacuum evaporator (Savant Instruments Inc., Hicksville, USA). Desalted peptide digests were subjected to nESI-MS/MS with a LCQ Deca ion trap-mass spectrometer (ThermoFinnigan, San Jose, USA), operated with dynamic exclusion via LCQ Tune software (version 1.1). MS/MS data was recorded over a 400–2000 m/z scan range, with positive polarity and 35 kV collision energy. MS/MS data was collected by Xcalibur (version 1.1) and integrated using the Interactive Chemical Information System (ICIS) peak detection algorithm software provided by Finnigan as default. MS/MS ion search was performed by Mascot search engine (version 2.10.03) (Matrix Science Inc., Boston, USA), using the database NCBInr (2007.05.12) containing 4,914,404 sequences. The following are the standard search parameters: (i) trypsin cleavage, (ii) no fixed modifications, (iii) no constraints on protein mass or mass value, (iv) peptide and MS/MS tolerances set at 1.2 and 0.6 Da, respectively and (v) peptide charge was set at 2+ and up to 1 missed cleavage permitted. Mascot used the Mowse scoring algorithm [18]. A threshold score of > 49 indicates that the identity is significant if it would be expected to occur at random with a frequency of less than 5%.
3. Results
3.1. Universal proteome expression patterns across sample types
The simultaneous analysis of individual paired plasma and synovial fluids from ten patients (Table 1, study group A) was used to initially isolate joint-specific protein expression profiles, without introducing bias from inter-individual differences. Pilot 2-DE gels revealed that the majority of proteins from the sampled fluids migrated to within the pH 4–7 range (results not shown). A characteristic pattern of protein migration is apparent in the 2-DE gel scans of both synovial fluid and plasma samples (see Fig. 1 ). A number of high abundance proteins form a series of typical charge trains. This spread of proteins is consistent with previous work by other laboratories and our own [13], [19]. Interesting distinctions are revealed between the local (synovial fluid, SF) and systemic (plasma) molecular signatures of juvenile arthritis subgroups. On initial visual inspection it is apparent that as one of the predominant sets of high molecular weight proteins present in blood, fibrinogen is principally retained within blood.
Fig. 1.
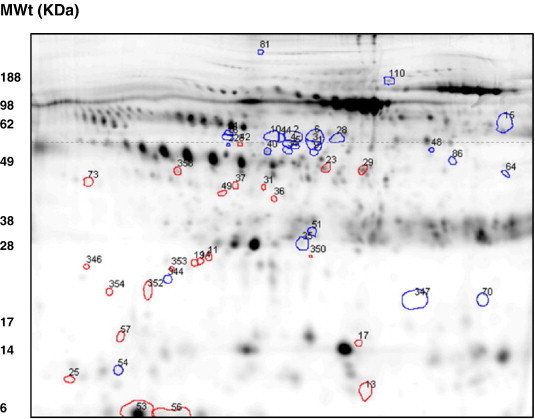
DIGE reveals ~ 900 spots per gel within the pH 4–7 range for synovial fluid. Spot filtering on ‘master gels’ reveals 143 protein spots which predominate in synovial fluid or plasma. Attention was focussed on a series of 26 synovial fluid proteins (circled in red) and 26 plasma proteins (circled in blue) as these spots remained unmatched or were expressed at a two-fold or higher level than could be detected in the corresponding fluid. Interestingly, the synovial fluid ‘specific’ proteins were all under ~ 60 KDa, whereas the plasma ‘specific’ had a wider molecular weight range from ~ 10 to 200 KDa. All 30 proteins spots were cut from replicate preparative gels and MALDI-TOF and nESI-MS/MS was used to ascertain their identity. (For interpretation of the references to colour in this figure legend, the reader is referred to the web version of this article.)
Approximately 900 spots per synovial fluid gel image and 800 spots per plasma gel image were automatically detected and matched across patients by Samespots software analysis. The upper and lower limits of detection for the Cy dye stained body fluids spanned 5 orders of magnitude. Protein spots were uniquely numbered by synchronization to those in a reference gel. Intensity differences in spots matched between synovial and plasma master gels were quantified and normalized to the internal standard allowing real comparisons of individual protein spots from both sample types across the patient cohort. A master gel was constructed for each sample type with the gel analysis software and spot filtering performed to highlight spots which predominate in synovial fluid and those which predominate in plasma. Spots which predominate in the SF/PL could be presumed to originate in either fluid and were described as SF/PL ‘specific’.
3.2. Differential protein expression between synovial fluid and plasma
A number of proteins with consistent synovial and plasma ‘specific’ expression patterns are highlighted and quantified to demonstrate the ability to reliably differentiate molecular fingerprints of local and systemic disease across patient groups by this gel based approach. A spot filtering rationale to narrow our focus on the most prevalent and most consistent patterns was applied across the ten patients expression data set. Images of areas from master gels (see Fig. 2 ) demonstrate the inter-sample variation in the expression of ‘synovial specific’ proteins (spots 23, 29, 36, 25) in synovial fluids and absence in plasma samples. A series of 26 synovial fluid proteins and 26 plasma proteins were selected on the basis that they were expressed at a two-fold or higher levels than could be detected within the corresponding fluid. The inter-individual and inter-sample type variation in these 52 proteins is represented in heatmap form in Fig. 4.
Fig. 2.
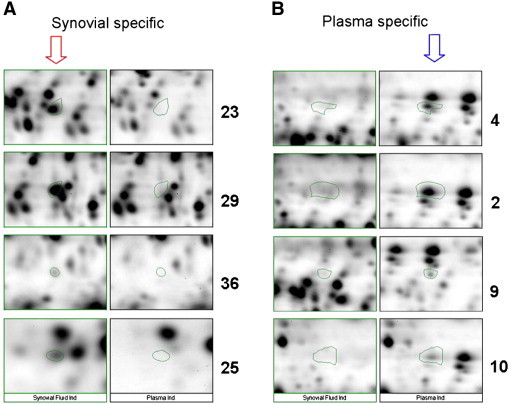
Images of areas from master gels demonstrate the expression of ‘synovial specific’ proteins (A- spots 23, 25, 29, 36) in synovial fluids and ‘plasma specific’ expression (B- spots 2, 4, 9, 10). Subsequent qualitative subtraction of plasma from matched synovial fluid ‘master’ gels revealed a population of proteins uniquely expressed in the joint in JIA patients.
Fig. 4.
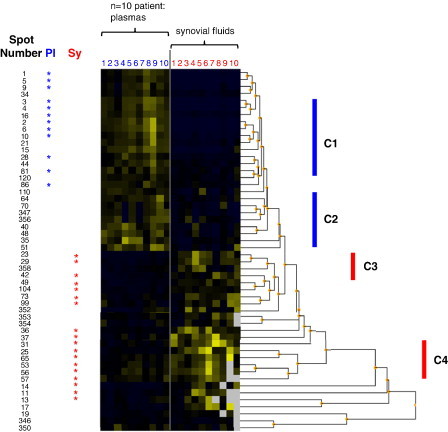
The inter-individual and inter-sample type variation in 52 pre-selected proteins is represented in heatmap form and reordered by hierarchical cluster analysis revealing distinguishing expression patterns. Each patient sample is represented by a single numbered column; plasma (Pl, blue) and synovial fluid (Sy, red). 30 of the proteins consistently overexpressed at twofold higher levels than in the corresponding fluid are highlighted (by *). The location of spots from the comparative heatmap is shown in Fig. 1. Observed arbitrary clusters of co-regulated proteins (C1 and C2) fluid ‘specific’ expression patterns (C3 and C4) are indicated. (For interpretation of the references to colour in this figure legend, the reader is referred to the web version of this article.)
Even though many of the protein constituents of synovial fluid are derived from plasma, some appear to be enriched in synovial fluid borne out by the higher synovial fluid to plasma ratios (listed in Table 2 ). Though an approximate 200 fold dynamic range is apparent between the highest and lowest SF/PL ratios listed, we found the top and bottom detection range was over 5 orders of magnitude. Interestingly, the synovial fluid ‘specific’ proteins were all under ~ 55 KDa, whereas the plasma ‘specific’ had a wider molecular weight range from ~ 10 to 200 KDa (as indicated in Fig. 1). The statistical significance of a protein differing in abundance between the two sample types in one or more individuals is indicated by the p values listed in Table 2.
Table 2.
Protein name, mass spectrometry data, fold differences between fluids and variation across patients are compiled for the 31 plasma and synovial fluid associated proteins.
| Spot no. | SF/ PL ratio | % CV SF | % CV PL | Paired t-test (p) | Protein name | Accession number | MW (KDa) | Mascot score | Sequence coverage (%) | Matched peptide | Verification CID ions |
|---|---|---|---|---|---|---|---|---|---|---|---|
| 1 | 0.034 | 115.99% | 34.88% | 9.49E− 12 | Transthyretin, Chain B | 55669576 | 12.8 | 434 | 92 | 10 | 4 |
| 2 | 0.035 | 66.60% | 44.35% | 1.71E− 12 | Serum albumin | 23307793 | 69.3 | 298 | 22 | 15 | 5 |
| 3 | 0.036 | 66.12% | 32.90% | 9.63E− 13 | Serum albumin | 23307793 | 69.3 | 409 | 42 | 23 | 6 |
| 4 | 0.039 | 68.88% | 33.37% | 2.11E− 12 | Serum albumin | 62113341 | 69.0 | 148 | 26 | 6 | 2 |
| 5 | 0.041 | 76.91% | 36.07% | 8.45E− 12 | Serum albumin | 28592 | 69.3 | 253 | 30 | 24 | 4 |
| 6 | 0.046 | 46.28% | 42.52% | 2.00E− 13 | Serum albumin | 62113341 | 69.0 | 337 | 37 | 28 | 5 |
| 9 | 0.101 | 91.01% | 43.33% | 3.56E− 08 | ALB protein | 27692693 | 47.3 | 309 | 40 | 19 | 4 |
| 10 | 0.107 | 41.59% | 47.05% | 1.59E− 10 | Serum albumin | 62113341 | 69.0 | 205 | 32 | 25 | 4 |
| 16 | 0.150 | 29.82% | 23.59% | 2.50E− 12 | Albumin precursor PRO2619 | 11493459 | 56.7 | 199 | 14 | 7 | 3 |
| 28 | 0.264 | 23.72% | 41.29% | 5.26E− 08 | ALB protein | 27692693 | 47.3 | 342 | 46 | 20 | 4 |
| 81 | 0.440 | 54.20% | 34.66% | 6.74E− 04 | No ID | – | – | – | – | – | – |
| 86 | 0.445 | 31.90% | 31.59% | 2.05E− 05 | Transferrin chain A | 49258810 | 36.1 | 68 | 23 | 9 | 2 |
| 11 | 7.451 | 122.81% | 41.81% | 6.58E−04 | Apolipoprotein A-I, Chain C, | 90108666 | 28.0 | 277 | 51 | 16 | 3 |
| 13 | 7.072 | 125.23% | 59.58% | 5.08E− 04 | Serum Albumin | 62113341 | 69.0 | 93 | 12 | 22 | 3 |
| 14 | 7.071 | 172.69% | 46.96% | 1.74E− 03 | No ID | – | – | – | – | – | – |
| 23 | 4.745 | 57.71% | 34.73% | 6.33E− 06 | Albumin precursor PRO2619 | 11493459 | 56.7 | 200 | 29 | 16 | 4 |
| 25 | 4.359 | 58.40% | 29.20% | 6.78E− 06 | Apolipoprotein C-III precursor | 4557323 | 10.8 | 99 | 19 | 2 | 1 |
| 29 | 3.714 | 51.16% | 37.14% | 1.37E− 05 | Albumin precursor PRO2619 | 11493459 | 56.7 | 185 | 31 | 16 | 5 |
| 31 | 3.621 | 53.77% | 38.91% | 1.97E− 05 | Albumin precursor PRO1851 | 7770149 | 70.9 | 163 | 17 | 12 | 3 |
| 36 | 3.291 | 52.65% | 17.68% | 3.95E− 06 | ALB Protein | 27692693 | 47.3 | 177 | 33 | 16 | 2 |
| 37 | 3.274 | 51.10% | 51.41% | 2.15E− 05 | No ID | – | – | – | – | – | – |
| 42 | 3.005 | 57.12% | 33.04% | 1.16E− 04 | Alpha-1 antitrypsin | 28637 | 22.8 | 162 | 50 | 14 | 4 |
| 49 | 2.884 | 33.28% | 31.85% | 2.06E− 06 | Properdin, B-factor | 257209925 | 85.4 | 165 | 17 | 12 | 3 |
| 53 | 2.763 | 92.05% | 33.54% | 4.51E− 03 | Apolipoprotein A-II | 119573006 | 9.0 | 69 | 27 | 3 | 1 |
| 56 | 2.647 | 82.35% | 31.78% | 1.00E− 03 | No ID | – | – | – | – | – | – |
| 57 | 2.631 | 89.56% | 32.31% | 1.12E− 02 | Apolipoprotein A-I, Chain A | 90108664 | 28.1 | 100 | 30 | 9 | 1 |
| 65 | 2.393 | 62.69% | 30.35% | 8.72E− 04 | Albumin | 119626069 | 13.8 | 44 | 23 | 3 | 1 |
| 73 | 2.341 | 59.48% | 39.11% | 7.84E− 03 | Alpha-1 antitrypsin, Chain | 1942629 | 44.2 | 217 | 22 | 9 | 2 |
| 99 | 2.115 | 67.65% | 59.09% | 2.76E− 02 | Alpha-1 antitrypsin, Chain | 1942953 | 44.3 | 56 | 17 | 6 | 1 |
| 104 | 2.077 | 18.06% | 32.48% | 8.90E− 06 | Serum albumin | 62113341 | 69.0 | 136 | 26 | 19 | 3 |
Spot trypsin digests were initially identified using matrix assisted laser desorption ionisation (MALDI-TOF) and confirmed with nano-electrospray mass spectra (nESI-MS/MS), correlated to compiled peptide data (Matrixscience). The number of matching peptide and collision induced dissociation (CID) ions used to verify protein identity are listed alongside sequence coverage and Mascot score. Mascot used the Mowse scoring algorithm [17]. This indicates that the identity is significant if it would be expected to occur at random with a frequency of less than 5%. A positive control spot picked from the 2-DE gel molecular weight markers was correctly identified as myoglobin. Peptide ion sequence and peak lists can be found in Table 3.
3.3. Variation in protein expression across individuals
We found that there is a degree of proteome variability across individual patient body fluid samples. To date, no results have been published on the variability of the synovial fluid proteome analysed by the DIGE method. Statistical analysis of inter-patient variance revealed that 18 synovial ‘specific’ and 12 plasma ‘specific’ spots within the previously described subgroup of 52 proteins were consistently expressed in all patients studied. Representative images of areas from individual gels (see Fig. 3 ) demonstrate the inter-individual variation in the expression of a representative ‘synovial specific’ protein (spot 49) in synovial fluids and its absence in corresponding plasma samples.
Fig. 3.
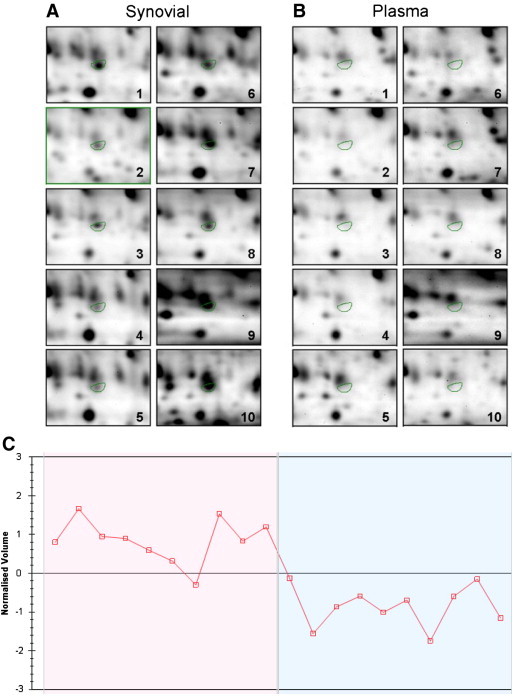
Pairwise comparisons were made to establish patient-to-patient, synovial fluid-to-plasma and Cy3-to-Cy5 dye variations. Statistical analysis of inter-patient variance revealed that 19 synovial ‘specific’ and 12 plasma ‘specific’ spots within this subgroup of proteins were consistently expressed in all patients studied (p < 0.05). The expression levels of properdin (spot 49) are visible in a section of gel images from individual patient (1–10) synovial fluid (A) and plasma (B) samples. The log normalized peak volume of properdin is plotted for each patient sample shown (C), such that the first ten points represent synovial fluid levels and the latter ten points represent plasma levels.
We calculated the expression variance of a selected group of 30 proteins (standard deviation / mean, expressed in percent) and observed that standard deviations can be high across the synovial samples in particular (e.g. proteins 11, 14, 53). A disparity is evident between synovial fluid and plasma in the degree of variation for given protein (e.g. proteins 56, 57). Generally speaking, for a given protein, detected levels in synovial fluid vary on a wider scale (~ 30–70% on average) than those in plasma (~ 30–50% on average). Exceptions to this rule are evident, where the standard deviation for certain proteins (6,16, 37 and 49) across the 10 patients is closely matched for both sample types.
3.4. Cluster analysis and protein identification of a defined synovial fluid proteome (study group A)
The normalised expression data from the pool of 52 proteins, previously selected due their two fold abundance in one fluid type, were subjected to hierarchical cluster analysis to visualize their expression characteristics across each patient fluid (see Fig. 4 ). The clustering algorithm applied distinguishes plasma and synovial fluid, forming two clear blocks of plasma and synovial fluid abundant proteins in the top and bottom halves, respectively. Groups of co-regulated proteins can be rapidly identified by their absence or presence pattern as demonstrated by clusters labeled C1 and C2. Certain groups of patients seem to form smaller clusters, whereby a fluid ‘specific’ expression pattern is apparent, synovial fluid clusters are apparent in regions labeled C3 and C4. The agglomerative nature of clustering reorders the data such that the degree of similarity between patients is strongest for proteins listed at the top and weakest at the bottom. This is represented by the constructed dendrogram, whereby the shortest arms signify the expression levels are closest. It is interesting therefore to note that the selected plasma proteome produces the most consistent expression patterns.
30 proteins selected on their ability to distinguish one fluid from another, were cut from replicate silver stained preparative gels and mass spectrometry was used to ascertain their identity. Protein name, mass spectrometry data, fold differences between fluids and variation across patients are compiled for these proteins in Table 2. Detailed information on each identification including peptide ion sequence identified is included in Table 3 .
Table 3.
Peptide ion validation data from CID MS/MS mass spectrometry which corresponds with Table 2.
| Spot no. | Protein name | Accession number | Verification CID ions | Peptide position in protein sequence: start–end | m/z | Ions score | Amino acid sequence | Variable modification: carbymidomethyl cysteine (C), oxidation methionine (M) |
|---|---|---|---|---|---|---|---|---|
| 1 | Transthyretin, Chain B | 55669576 | 4 | 12–24 | 1366.74 | 89 | R.GSPAINVAVHVFR.K | |
| 12–25 | 1494.84 | 75 | R.GSPAINVAVHVFRK.A | |||||
| 25–38 | 1522.70 | 88 | R.KAADDTWEPFASGK.T | |||||
| 26–38 | 1394.60 | 47 | K.AADDTWEPFASGK.T | |||||
| 2 | Serum albumin | 23307793 | 5 | 299–310 | 1546.80 | 25 | K.LKECCEKPLLEK.S | 2C |
| 361–372 | 1467.85 | 51 | R.RHPDYSVVLLLR.L | |||||
| 362–372 | 1311.76 | 18 | R.HPDYSVVLLLR.L | |||||
| 438–452 | 1639.94 | 97 | K.KVPQVSTPTLVEVSR.N | |||||
| 439–452 | 1511.85 | 62 | K.VPQVSTPTLVEVSR.N | |||||
| 3 | Serum albumin | 23307793 | 6 | 35–44 | 1226.60 | 57 | R.FKDLGEENFK.A | |
| 123–138 | 1996.92 | 57 | R.NECFLQHKDDNPNLPR.L | C | ||||
| 162–168 | 927.49 | 47 | K.YLYEIAR.R | |||||
| 361–372 | 1467.83 | 57 | R.RHPDYSVVLLLR.L | |||||
| 427–434 | 960.56 | 44 | K.FQNALLVR.Y | |||||
| 438–452 | 1639.92 | 13 | K.KVPQVSTPTLVEVSR.N | |||||
| 4 | Serum albumin | 62113341 | 2 | 570–581 | 1342.63 | 79 | K.AVMDDFAAFVEK.C | |
| 570–581 | 1358.62 | 79 | K.AVMDDFAAFVEK.C | M | ||||
| 5 | Serum albumin | 28592 | 4 | 162–168 | 927.51 | 19 | K.YLYEIAR.R | |
| 361–372 | 1467.84 | 19 | R.RHPDYSVVLLLR.L | |||||
| 427–434 | 960.58 | 33 | K.FQNALLVR.Y | |||||
| 438–452 | 1639.94 | 54 | K.KVPQVSTPTLVEVSR.N | |||||
| 6 | Serum albumin | 62113341 | 5 | 162–168 | 927.49 | 39 | K.YLYEIAR.R | |
| 162–169 | 1083.59 | 19 | K.YLYEIARR.H | |||||
| 234–242 | 1019.58 | 37 | R.AFKAWAVAR.L | |||||
| 427–434 | 960.56 | 45 | K.FQNALLVR.Y | |||||
| 438–452 | 1639.93 | 76 | K.KVPQVSTPTLVEVSR.N | |||||
| 9 | ALB protein | 27692693 | 4 | 107–118 | 1546.79 | 37 | K.LKECCEKPLLEK.S | 2C |
| 169–180 | 1467.84 | 32 | R.RHPDYSVVLLLR.L | |||||
| 235–242 | 960.57 | 39 | K.FQNALLVR.Y | |||||
| 246–260 | 1639.95 | 82 | K.KVPQVSTPTLVEVSR.N | |||||
| 10 | Serum albumin | 62113341 | 4 | 162–168 | 927.51 | 42 | K.YLYEIAR.R | |
| 162–169 | 1083.61 | 18 | K.YLYEIARR.H | |||||
| 234–242 | 1019.6 | 14 | R.AFKAWAVAR.L | |||||
| 427–434 | 960.58 | 26 | K.FQNALLVR.Y | |||||
| 16 | Albumin precursor PRO2619 | 11493459 | 3 | 399–414 | 1910.94 | 41 | R.RPCFSALEVDETYVPK.E | C |
| 440–448 | 1000.60 | 41 | K.QTALVELVK.H | |||||
| 460–471 | 1358.62 | 90 | K.AVMDDFAAFVEK.C | M | ||||
| 28 | ALB protein | 27692693 | 4 | 169–180 | 1467.82 | 54 | R.RHPDYSVVLLLR.L | |
| 235–242 | 960.55 | 49 | K.FQNALLVR.Y | |||||
| 246–260 | 1639.92 | 93 | K.KVPQVSTPTLVEVSR.N | |||||
| 247–260 | 1511.83 | 53 | K.VPQVSTPTLVEVSR.N | |||||
| 81 | No ID | – | – | |||||
| 86 | Transferrin chain A | 49258810 | 2 | 42–50 | 1125.61 | 4 | K.KASYLDCIR.A | C |
| 43–50 | 997.52 | 23 | K.ASYLDCIR.A | C | ||||
| 11 | Apolipoprotein A-I, Chain C, | 90108666 | 3 | 24–40 | 1815.86 | 48 | K.DSGRDYVSQFEGSALGK.Q | |
| 119–131 | 1467.81 | 22 | K.VEPLRAELQEGAR.Q | |||||
| 161–171 | 1301.66 | 28 | R.THLAPYSDELR.Q | |||||
| 13 | Serum albumin | 62113341 | 3 | 162–168 | 927.51 | 25 | K.YLYEIAR.R | |
| 162–169 | 1083.61 | 9 | K.YLYEIARR.H | |||||
| 427–434 | 960.58 | 22 | K.FQNALLVR.Y | |||||
| 14 | No ID | – | – | |||||
| 23 | Albumin precursor PRO2619 | 11493459 | 4 | 251–262 | 1467.85 | 23 | R.RHPDYSVVLLLR.L | |
| 317–324 | 960.58 | 30 | K.FQNALLVR.Y | |||||
| 328–342 | 1639.94 | 69 | K.KVPQVSTPTLVEVSR.N | |||||
| 399–414 | 1910.94 | 7 | R.RPCFSALEVDETYVPK.E | C | ||||
| 25 | Apolipoprotein C-III precursor | 4557323 | 1 | 45–60 | 1716.84 | 79 | K.DALSSVQESQVAQQAR.G | |
| 29 | Albumin precursor PRO2619 | 11493459 | 5 | 251–262 | 1467.84 | 20 | R.RHPDYSVVLLLR.L | |
| 317–324 | 960.57 | 26 | K.FQNALLVR.Y | |||||
| 328–342 | 1639.94 | 64 | K.KVPQVSTPTLVEVSR.N | |||||
| 329–342 | 1511.85 | 7 | K.VPQVSTPTLVEVSR.N | |||||
| 399–414 | 1910.94 | 3 | R.RPCFSALEVDETYVPK.E | C | ||||
| 31 | Albumin precursor PRO1851 | 7770149 | 3 | 468–489 | 2415.14 | 73 | R.QGPVNLLSDPEQGVEVTGQYER.E | |
| 468–491 | 2672.28 | 50 | R.QGPVNLLSDPEQGVEVTGQYEREK.A | |||||
| 610–622 | 1454.73 | 5 | R.TLRVQGNDHSATR.E | |||||
| 36 | ALB Protein | 27692693 | 2 | 235–242 | 960.58 | 28 | K.FQNALLVR.Y | |
| 246–260 | 1639.97 | 67 | K.KVPQVSTPTLVEVSR.N | |||||
| 37 | No ID | – | – | |||||
| 42 | Alpha-1 antitrypsin | 28637 | 4 | 75–84 | 1275.71 | 7 | K.GKWERPFEVK.D | |
| 106–116 | 1403.72 | 12 | K.RLGMFNIQHCK.K | C | ||||
| 107–116 | 1247.61 | 41 | R.LGMFNIQHCK.K | C | ||||
| 158–165 | 1078.55 | 26 | K.FLENEDRR.S | |||||
| 49 | Properdin, B-factor | 57209925 | 3 | 51–74 | 2815.37 | 33 | R.LLQEGQALEYVCPSGFYPYPVQTR.T | C |
| 177–193 | 2056.94 | 28 | K.VGSQYRLEDSVTYHCSR.G | C | ||||
| 183–193 | 1366.61 | 66 | R.LEDSVTYHCSR.G | C | ||||
| 53 | Apolipoprotein A-II | 119573006 | 1 | 48–57 | 1156.68 | 38 | K.SKEQLTPLIK.K | |
| 56 | No ID | – | – | |||||
| 57 | Apolipoprotein A-I, Chain A | 90108664 | 1 | 1–10 | 1226.56 | 27 | DEPPQSPWDR.V | |
| 65 | Albumin | 119626069 | 1 | 66–75 | 1149.65 | 20 | K.LVNEVTEFAK.T | |
| 73 | Alpha-1 antitrypsin, chain | 1942629 | 2 | 11–25 | 1779.75 | 60 | K.TDTSHHDQDHPTFNK.I | |
| 156–168 | 1479.73 | 95 | K.QINDYVEKGTQGK.I | |||||
| 99 | Alpha-1 antitrypsin, Chain | 1942953 | 1 | 11–25 | 1779.77 | 24 | K.TDTSHHDQDHPTFNK.I | |
| 104 | Serum albumin | 62113341 | 3 | 66–75 | 1149.63 | 33 | K.LVNEVTEFAK.T | |
| 162–169 | 1083.61 | 8 | K.YLYEIARR.H | |||||
| 438–452 | 1639.97 | 23 | K.KVPQVSTPTLVEVSR.N | |||||
| 344 | No ID | – | – |
Peptide position in the matched protein, observed mass (m/z) and amino acid sequence are listed for each protein match found.
Albumin isoforms were common to both fluids, but even so, some unique expression traits were evident in this class of ubiquitous blood proteins. Certain isoforms were detected exclusively in plasma (gi23307793 and gi28592) or synovial fluid (gi119626069). Other albumin species detected in both plasma and synovial fluid could be distinguished by their molecular weights (ascertained from 2-DE gel images), such that isoforms (gi62113341, gi11493459, gi27692693) of the same albumin species above 55 KDa were predominant in plasma and those below 55 KDa were more abundant in synovial fluid. For example the albumin gi11493459 (PRO2619) was identified from the three separate gel cores of spots 16, 23 and 29, positioned at approximate molecular weights of 60, 48 and 47 KDa respectively (Fig. 1. The two lower molecular weight forms are more abundant in synovial fluid, with 4.7 and 3.7 fold more, respectively. Conversely, transthyretin and transferrin chain fragments were identified at 29.4 and 2.2 fold higher levels in plasma, respectively.
Several apolipoprotein species were amongst those proteins commonly over expressed in synovial fluid. A disproportionate synovial abundance of chain C from apoliprotein A-1 compared to chain A from the same molecule is evident from the SF/Pl ratios. Apolipoproteins A-II and C-III precursor were also detected at significantly higher levels in synovial fluid. Two isoforms of alpha-1 antitrypsin (gi28637 and gi1942629) were detected with molecular weight estimates ranging from 45–54 KDa (spots 42, 73 and 99) according to gel markers. Furthermore, inter alpha trypsin inhibitor and properdin were identified among those proteins enriched within synovial fluid. A number of proteins remained unidentified, probably attributable to a low protein yield from gel cores.
3.5. Cluster analysis differentiates proteins which segregate patient subgroups (study group B)
A ‘master’ gel was constructed for each patient subgroup with the image analysis software and spot filtering performed to highlight spots which predominate in a particular subgroup. Attention was focussed on a series of 40 synovial fluid proteins (circled and labelled in Fig. 5A) as these spots were expressed at a two-fold or higher level in pairwise comparisons of the other patient subgroups with statistical significance by ANOVA (p < 0.05). The group of selected synovial fluid proteins fell within ~ 10 to 100 KDa molecular weight range. Certain proteins predominate in two patient subgroups e.g. proteins 37 and 892 abundant in both the polyarticular and extended oligoarticular patient subgroups, whereas others apparently predominate in a single subgroup e.g. proteins 5 and 907 in polyarticular or protein 865 in oligoarticular patients (highlighted in Fig. 5B). Multivariate analysis was subsequently used to visualize inter-patient and inter-subgroup expression patterns of the 40 selected protein spots.
Fig. 5.
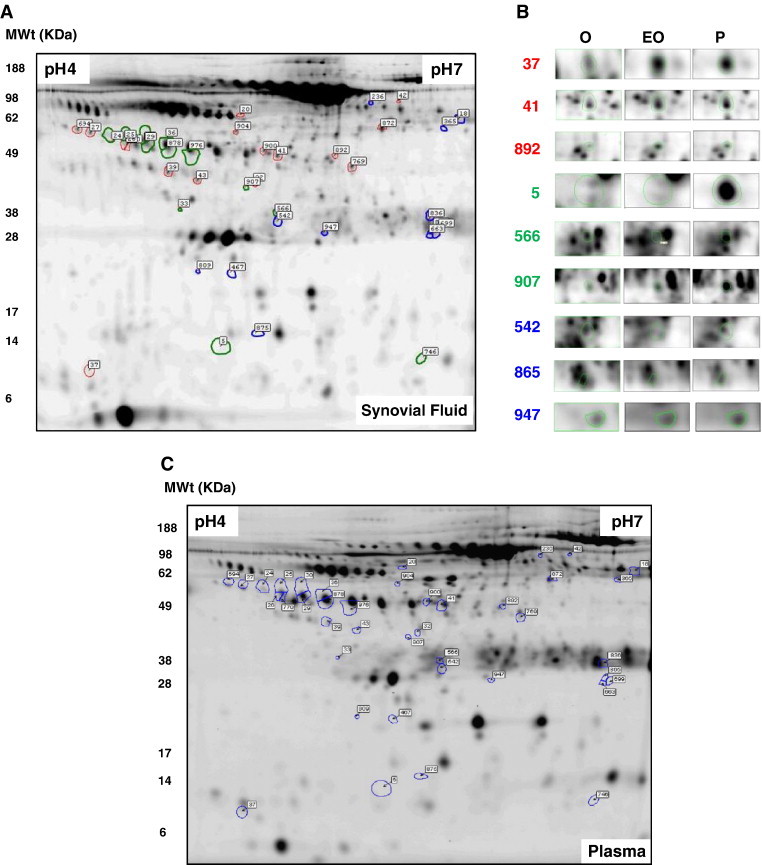
Fluorescence difference in gel electrophoresis (DIGE) of synovial fluid (A). A series of 40 synovial fluid proteins, encircled and numbered above, were expressed at a two-fold or higher level than could be detected in the other two patient subgroups with statistical significance by ANOVA (p < 0.05). Representative protein expression patterns in synovial fluid are shown in selected areas of ‘master’ gels (B) (37, 41, 892, 5, 566, 907, 542, 865, 947). The colours (red, green, blue) used to encircle spots and spot numbers correlate to the clusters observed in the data after hierarchical cluster analysis, shown in Fig. 5. 40 proteins spots were cut from replicate preparative gels and MALDI-TOF and nESI-MS/MS was used to ascertain their identity. Representative DIGE separation of plasma is also highlighted (C). (For interpretation of the references to colour in this figure legend, the reader is referred to the web version of this article.)
The highlighted proteome was further explored by hierarchical cluster analysis of the 40 selected proteins and visualization in heat map form (Fig. 6 ). Pearson ranked correlation revealed three distinctive clusters. Cluster 1 contains proteins which are consistently over expressed in both extended oligoarticular and polyarticular patients, whereas proteins in cluster 2 predominate only in the polyarticular subgroup. Intriguingly, proteins in cluster 3 are consistently overexpressed in the oligoarticular and polyarticular subgroups relative to those patients with disease extension. It seems conceivable that used in combination these three distinct clusters within the synovial fluid proteome could be used to differentiate disease subgroups. The unpaired t-test revealed proteins with significant fluctuations between combinations of any two patient subgroups. The p values are summarized in Table 4 . Having established the significance of protein expression patterns it was pertinent to assign identities using mass spectrometry.
Fig. 6.
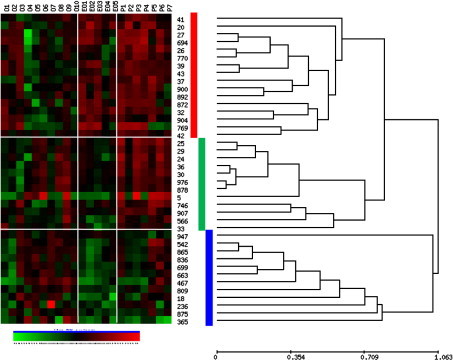
Hierarchical cluster analysis of proteins expressed with statistically significant differences between patient subgroups. The inter-individual and inter-group variation in 40 pre-selected proteins is represented in heatmap form. The protein expression data was reordered by hierarchical cluster analysis (HCA) using Pearson centred correlation (UPGMA), revealing distinguishing expression patterns. 3 main clusters of the proteins are highlighted by the coloured bars (red, green blue). Each patient sample is represented by a single numbered column (oligoarticular O1–O9, extended oligoarticular EO1–EO5 and polyarticular P1–P7). (For interpretation of the references to colour in this figure legend, the reader is referred to the web version of this article.)
Table 4.
Protein name, mass spectrometry data, fold differences between subgroups and their statistical significance are compiled for 40 synovial fluid associated proteins.
| Normalised spot volume – mean (SD) |
Inter-group comparison – fold difference, unpaired t-test (p < 0.05) |
Mass Spectrometry spectrometry data – MALDI-TOF/TOF |
|||||||||||||||
|---|---|---|---|---|---|---|---|---|---|---|---|---|---|---|---|---|---|
| Spot ID | Oligo | Ext oligo | Poly | O vs EO | p | O vs P | p | EO vs P | p | Protein name | Accesion number | pI | MW (KDa) | Mascot score | Sequence coverage | Matched peptides | Verification CID ions |
| 20 | 41.89 (36.27) | 201.65 (148.45) | 151.27 (151.74) | 4.8 | 0.049 | 3.6 | 0.086 | − 1.3 | 0.547 | Albumin, isoform CRA-t | 119626083 | 6.66 | 58614 | 53 | 5 | 3 | 2 |
| 26 | 260.05 (236.07) | 266.79 (190.06) | 1001.18 (668.96) | 1.0 | 0.953 | 3.8 | 0.017 | 3.8 | 0.018 | Leucine -rich alpha-2-glycoprotein 1 | 16418467 | 6.45 | 38154 | 189 | 23 | 7 | 2 |
| 27 | 193.16 (118.20) | 492.74 (375.05) | 725.81 (430.15) | 2.6 | 0.115 | 3.8 | 0.011 | 1.5 | 0.311 | HP protein | 47124562 | 8.48 | 31362 | 80 | 28 | 8 | 3 |
| 32 | 26.56 (31.24) | 76.19 (45.75) | 55.12 (37.80) | 2.9 | 0.018 | 2.1 | 0.089 | − 1.4 | 0.364 | Albumin, isoform CRA-k | 119626074 | 5.97 | 47257 | 130 | 24 | 11 | 3 |
| 37 | 329.60 (379.47) | 566.12 (290.03) | 841.30 (654.40) | 1.7 | 0.206 | 2.6 | 0.046 | 1.5 | 0.359 | Apolipoprotein A-II isoform CRA_c | 119573006 | 6.15 | 8958 | 108 | 32 | 4 | 1 |
| 39 | 179.67 (179.91) | 429.56 (301.20) | 381.20 (193.98) | 2.4 | 0.047 | 2.1 | 0.032 | − 1.1 | 0.721 | No identification | ~ | ~ | ~ | ~ | ~ | ~ | ~ |
| 41 | 722.35 (584.88) | 1700.28(614.83) | 1641.77 (1240.87) | 2.4 | 0.006 | 2.3 | 0.084 | − 1.0 | 0.918 | Serum Albumin with S-Naproxen, Chain A | 168988718 | 5.63 | 65778 | 322 | 32 | 25 | 8 |
| 42 | 17.59 (8.62) | 34.368 (16.56) | 39.75 (24.79) | 2.0 | 0.014 | 2.3 | 0.042 | 1.2 | 0.655 | Apo-serum transferrin (non-glycosylated), Chain A | 110590597 | 6.58 | 74643 | 377 | 38 | 26 | 8 |
| 43 | 69.84 (70.74) | 96.93 (47.48) | 153.98 (68.75) | 1.4 | 0.417 | 2.2 | 0.019 | 1.6 | 0.108 | Vitamin D-binding protein/ group specific component | 455970 | 5.34 | 52916 | 205 | 9 | 7 | 5 |
| 694 | 141.51 (107.45) | 459.84 (408.33) | 512.87 (396.27) | 3.2 | 0.120 | 3.6 | 0.036 | 1.1 | 0.811 | Albumin, isoform CRA_h | 119626071 | 5.92 | 68568 | 75 | 17 | 9 | 3 |
| 769 | 179.08 (237.44) | 540.87 (424.53) | 521.11 (518.79) | 3.0 | 0.038 | 2.9 | 0.116 | − 1.0 | 0.941 | Albumin, isoform CRA_k | 119626074 | 5.97 | 47257 | 255 | 32 | 15 | 4 |
| 770 | 292.30 (262.61) | 218.54 (112.10) | 658.83 (464.93) | − 1.3 | 0.526 | 2.3 | 0.043 | 3.0 | 0.033 | No Identification | ~ | ~ | ~ | ~ | ~ | ~ | ~ |
| 872 | 263.68 (207.60) | 635.23 (386.92) | 645.72 (414.37) | 2.4 | 0.020 | 2.4 | 0.040 | 1.0 | 0.962 | HP Protein | 47124562 | 8.48 | 31362 | 218 | 40 | 13 | 3 |
| 892 | 66.05 (57.56) | 152.32 (114.73) | 154.37 (109.81) | 2.3 | 0.054 | 2.3 | 0.035 | 1.0 | 0.974 | Albumin, isoform CRA_h | 119626071 | 5.92 | 68568 | 225 | 19 | 12 | 5 |
| 900 | 279.14 (251.24) | 509.13 (407.48) | 640.99 (462.64) | 1.8 | 0.167 | 2.3 | 0.042 | 1.3 | 0.590 | Haptoglobin | 3337390 | 6.14 | 38209 | 232 | 31 | 14 | 3 |
| 904 | 43.29 (40.48) | 98.89 (65.47) | 59.66 (54.74) | 2.3 | 0.045 | 1.4 | 0.463 | − 1.7 | 0.245 | Serum Albumin with S-Naproxen, Chain A | 168988718 | 5.63 | 65778 | 340 | 23 | 16 | 7 |
| 5 | 2618.22 (4761.74) | 349.76 (558.22) | 6111.70 (6599.47) | − 7.5 | 0.150 | 2.3 | 0.196 | 17.5 | 0.044 | Albumin, isoform CRA_h | 119626071 | 5.92 | 68568 | 168 | 22 | 17 | 4 |
| 24 | 498.13 (550.89) | 407.73 (366.73) | 1743.37 (1484.23) | − 1.2 | 0.725 | 3.5 | 0.054 | 4.3 | 0.040 | Haptoglobin | 3337390 | 6.14 | 38209 | 191 | 33 | 14 | 3 |
| 25 | 1015.31 (912.91) | 1130.96 (645.34) | 4293.33 (3251.87) | 1.1 | 0.788 | 4.2 | 0.028 | 3.8 | 0.031 | Leucine -rich alpha-2-glycoprotein 1 | 16418467 | 6.45 | 38154 | 124 | 16 | 5 | 3 |
| 29 | 1822.15 (1227.14) | 1659.83 (905.35) | 5152.16 (3376.72) | − 1.1 | 0.781 | 2.8 | 0.029 | 3.1 | 0.023 | Zinc-Alpha-2 Glycoprotein, Chain B | 4699583 | 5.7 | 31626 | 266 | 51 | 17 | 4 |
| 30 | 2921.00 (2723.47) | 2431.06 (956.73) | 7297.04 (5067.90) | − 1.2 | 0.599 | 2.5 | 0.026 | 3.0 | 0.033 | Complement Component C3c, Chain C | 78101271 | 4.79 | 39463 | 310 | 36 | 13 | 4 |
| 33 | 4.59 (4.69) | 1.93 (1.70) | 5.50 (2.28) | − 2.4 | 0.116 | 1.2 | 0.620 | 2.9 | 0.008 | Lipid-free Apolipoprotein A-I | 90108664 | 5.27 | 28061 | 91 | 26 | 6 | 3 |
| 36 | 6000.68 (5893.61) | 5767.56 (2843.52) | 15,013.18 (10385.59) | − 1.0 | 0.929 | 2.5 | 0.028 | 2.6 | 0.043 | Hemopexin | 11321561 | 6.55 | 51643 | 159 | 22 | 12 | 4 |
| 566 | 159.09 (245.58) | 32.79 (18.65) | 160.39 (136.42) | − 4.9 | 0.121 | 1.0 | 0.989 | 4.9 | 0.035 | Albumin, isoform CRA_k | 119626074 | 5.97 | 47257 | 326 | 23 | 11 | 5 |
| 746 | 186.38 (238.51) | 130.30 (67.38) | 414.46 (319.46) | − 1.4 | 0.480 | 2.2 | 0.092 | 3.2 | 0.044 | Albumin, isoform CRA_p | 119626064 | 8.42 | 25276 | 169 | 13 | 4 | 3 |
| 878 | 3545.92 (3336.53) | 2008.83 (776.53) | 4846.47 (2674.46) | − 1.8 | 0.173 | 1.4 | 0.376 | 2.4 | 0.022 | No Haptoglobin, isoform CRA_d | 119579601 | 6.31 | 39944 | 301 | 38 | 17 | 5 |
| 907 | 15.51 (13.98) | 15.43 (4.67) | 35.12 (24.09) | − 1.0 | 0.988 | 2.3 | 0.038 | 2.3 | 0.059 | Leucine -rich alpha-2glycoprotein 1 | 16418467 | 6.45 | 38154 | 90 | 21 | 7 | 2 |
| 976 | 6907.62 (8543.54) | 4224.08 (1702.29) | 8598.26 (4362.93) | − 1.6 | 0.336 | 1.2 | 0.616 | 2.0 | 0.040 | Albumin, isoform CRA_g | 119626070 | 5.66 | 22001 | 160 | 35 | 8 | 3 |
| 18 | 886.47 (935.84) | 162.80 (123.00) | 537.50 (382.84) | − 5.4 | 0.030 | − 1.6 | 0.284 | 3.3 | 0.032 | Immunoglobulin heavy chain variable region | 39937967 | 5.13 | 16841 | 86 | 38 | 7 | 1 |
| 236 | 582.96 (1659.82) | 36.57 (19.60) | 93.55 (61.25) | − 15.9 | 0.301 | − 6.2 | 0.352 | 2.6 | 0.039 | No Identification | ~ | ~ | ~ | ~ | ~ | ~ | ~ |
| 365 | 201.24 (265.85) | 48.39 (53.68) | 19.83 (15.50) | − 4.2 | 0.093 | − 10.1 | 0.048 | − 2.4 | 0.262 | Leucine -rich alpha-2-glycoprotein 1 | 16418467 | 6.45 | 38154 | 280 | 21 | 6 | 3 |
| 467 | 233.54 (236.91) | 33.72 (38.09) | 125.60 (199.55) | − 6.9 | 0.021 | − 1.9 | 0.311 | 3.7 | 0.244 | Albumin, isoform CRA_g | 119626070 | 5.66 | 22001 | 376 | 35 | 9 | 6 |
| 542 | 399.12 (305.67) | 134.22 (111.20) | 707.90 (946.32) | − 3.0 | 0.023 | 1.8 | 0.400 | 5.3 | 0.133 | Immunoglobulin kappa 1 light chain | 170684606 | 5.72 | 23238 | 177 | 40 | 6 | 3 |
| 663 | 312.00 (257.93) | 79.96 (28.35) | 220.35 (189.80) | − 3.9 | 0.015 | − 1.4 | 0.408 | 2.8 | 0.078 | No Identification | ~ | ~ | ~ | ~ | ~ | ~ | ~ |
| 699 | 644.84 (497.06) | 222.29 (72.19) | 795.35 (983.82) | − 2.9 | 0.020 | 1.2 | 0.666 | 3.6 | 0.145 | Immunoglobulin light chain | 149673887 | 6.97 | 233380 | 237 | 54 | 8 | 4 |
| 809 | 6.09 (4.56) | 2.24 (0.63) | 5.42 (4.21) | − 2.7 | 0.021 | − 1.1 | 0.750 | 2.4 | 0.074 | Albumin, isoform CRA_a | 119626064 | 6.45 | 25276 | 57 | 13 | 4 | 1 |
| 836 | 1133.55 (937.82) | 434.26 (340.27) | 998.09 (882.61) | − 2.6 | 0.045 | − 1.1 | 0.754 | 2.3 | 0.167 | Chain A, Human Serum Transferrin, N-lobe | 29726565 | 6.79 | 36533 | 649 | 41 | 16 | 9 |
| 865 | 1181.24 (706.11) | 482.13 (350.29) | 1189.55 (972.22) | − 2.5 | 0.040 | 1.0 | 0.983 | 2.5 | 0.090 | No Identification | ~ | ~ | ~ | ~ | ~ | ~ | ~ |
| 875 | 89.29 (63.09) | 36.63 (14.81) | 68.50 (70.85) | − 2.4 | 0.023 | − 1.3 | 0.510 | 1.9 | 0.256 | No identification | ~ | ~ | ~ | ~ | ~ | ~ | ~ |
| 947 | 137.42 (92.37) | 158.18 (45.03) | 74.58 (28.01) | 1.2 | 0.616 | − 1.8 | 0.055 | − 2.1 | 0.001 | Chain A, Human Vitamin D Binding Protein | 18655424 | 5.66 | 51183 | 363 | 20 | 8 | 4 |
Spot trypsin digests were initially identified using matrix assisted laser desorption ionisation (MALDI-TOF) and confirmed with nano-electrospray mass spectra (nESI-MS/MS), correlated to compiled peptide data (Matrixscience). The number of matching peptide (MP) and collision induced dissociation (CID) ions used to verify protein identity are listed alongside sequence coverage and Mascot score. Mascot used the Mowse scoring algorithm [17] This indicates that the identity is significant if it would be expected to occur at random with a frequency of less than 5%. p values in bold highlight inter-subgroup comparisons which reached statistical significance (p < 0.05) by unpaired t-test. Peptide ion sequence and peak lists can be found in Table 5.
3.6. Discriminatory SF proteome identification and inter-subgroup variation (study group B)
The mass spectrometry derived identification and inter-subgroup variation of the 40 selected proteins are listed in Table 4. Detailed information on each identification including peptide ion sequence identified is included in Table 5 . In order to highlight proteins which may discriminate disease extension, emphasis was placed on statistically significant correlations to extended oligoarticular patients. As the most ubiquitous protein, six albumin isoforms (a, g, h, k, p and t) were identified as 11 distinct protein spots from picking gels and were distributed throughout the 3 identified protein clusters, predominating in cluster 1. Within cluster 3, albumin isoforms t and k were over expressed 4.8 (p = 0.049), 2.9 (p = 0.018) and 3.0 (p = 0.038) fold in extended oligoarticular patients when compared to the oligoarticular subgroup, whereas albumin isoforms a and g are conversely underexpressed 2.7 (p = 0.021) and 6.9 (p = 0.021) fold, respectively, in patients with disease extension. Intriguingly, albumin complexed with the non-steroidal anti-inflammatory drug (NSAID) S-naproxen (spot numbers 41 and 904) was detected at significantly raised levels in extended oligoarticular contrasted with oligoarticular patients with similar 2.4 (p = 0.006) and 2.3 fold (p = 0.045) differences recorded for isoforms isolated from two distinct protein spots.
Table 5.
Peptide ion validation data from CID MS/MS mass spectrometry which corresponds with Table 4.
| Spot no. | Protein name | Accession number | Verification CID ions | Peptide position in protein sequence: start–end | m/z | Ions score | Amino acid sequence | Variable modification: carbymidomethyl cysteine (C), oxidation methionine (M) |
|---|---|---|---|---|---|---|---|---|
| 20 | Albumin, isoform CRA-t | 119626083 | 2 | 162–168 | 927.5 | 21 | K.YLYEIAR.R | |
| 398–405 | 960.57 | 23 | K.FQNALLVR.Y | |||||
| 26 | Leucine -rich alpha-2-glycoprotein 1 | 16418467 | 2 | 165 –175 | 1152.62 | 79 | K.ALGHLDLSGNR.L | |
| 251–260 | 989.56 | 83 | R.VAAGAFQGLR.Q | |||||
| 27 | HP protein | 47124562 | 3 | 153–161 | 980.51 | 7 | R.VGYVSGWGR.N | |
| 173–186 | 1707.82 | 30 | K.YVMLPVADQDQCIR.H | C | ||||
| 173–186 | 1723.81 | 41 | K.YVMLPVADQDQCIR.H | C, M | ||||
| 32 | Albumin, isoform CRA-k | 119626074 | 3 | 169–180 | 1467.87 | 16 | R.RHPDYSVVLLLR.L | |
| 170–180 | 1311.76 | 12 | R.HPDYSVVLLLR.L | |||||
| 235–242 | 960.59 | 56 | K.FQNALLVR.Y | |||||
| 37 | Apolipoprotein A-II isoform CRA_c | 119573006 | 1 | 48–57 | 1156.69 | 75 | K.SKEQLTPLIK.K | |
| 39 | No identification | – | – | |||||
| 41 | Serum Albumin with S-Naproxen, Chain A | 168988718 | 8 | 60–68 | 1017.55 | 39 | K.SLHTLFGDK.L | |
| 89–101 | 1714.83 | 27 | K.QEPERNECFLQHK.D | C | ||||
| 133–139 | 927.52 | 36 | K.YLYEIAR.R | |||||
| 332–343 | 1467.87 | 26 | R.RHPDYSVVLLLR.L | |||||
| 333–343 | 1311.77 | 19 | R.HPDYSVVLLLR.L | |||||
| 398–405 | 960.59 | 41 | K.FQNALLVR.Y | |||||
| 409–423 | 1639.97 | 27 | K.KVPQVSTPTLVEVSR.N | |||||
| 410–423 | 1511.87 | 7 | K.VPQVSTPTLVEVSR.N | |||||
| 42 | Apo-serum transferrin (non-glycosylated), Chain A | 110590597 | 8 | 310–321 | 1478.72 | 44 | K.MYLGYEYVTAIR.N | |
| 310–321 | 1494.71 | 30 | K.MYLGYEYVTAIR.N | M | ||||
| 341–349 | 1195.54 | 19 | K.WCALSHHER.L | C | ||||
| 509–519 | 1283.56 | 72 | K.EGYYGYTGAFR.C | |||||
| 555–565 | 1354.62 | 33 | K.DYELLCLDGTR.K | C | ||||
| 566–578 | 1586.76 | 41 | R.KPVEEYANCHLAR.A | C | ||||
| 625–637 | 1565.78 | 18 | K.DLLFRDDTVCLAK.L | C | ||||
| 662–674 | 1531.67 | 14 | K.CSTSSLLEACTFR.R | C | ||||
| 43 | Vitamin D-binding protein/ group specific component | 455970 | 5 | 342–352 | 1388.69 | 50 | K.VMDKYTFELSR.R | |
| 342–352 | 1404.68 | 36 | K.VMDKYTFELSR.R | M | ||||
| 346–352 | 915.47 | 22 | K.YTFELSR.R | |||||
| 353–363 | 1326.76 | 38 | R.RTHLPEVFLSK.V | |||||
| 354–363 | 1170.64 | 78 | R.THLPEVFLSK.V | |||||
| 694 | Albumin, isoform CRA_h | 119626071 | 3 | 427–434 | 960.57 | 8 | K.FQNALLVR.Y | |
| 438–452 | 1639.94 | 27 | K.KVPQVSTPTLVEVSR.N | |||||
| 502–517 | 1910.93 | 17 | R.RPCFSALEVDETYVPK.E | C | ||||
| 769 | Albumin, isoform CRA_k | 119626074 | 4 | 235–242 | 960.6 | 48 | K.FQNALLVR.Y | |
| 246–260 | 1639.99 | 72 | K.KVPQVSTPTLVEVSR.N | |||||
| 247–260 | 1511.89 | 48 | K.VPQVSTPTLVEVSR.N | |||||
| 317–332 | 1910.98 | 19 | R.RPCFSALEVDETYVPK.E | C | ||||
| 770 | No Identification | – | – | |||||
| 872 | HP Protein | 47124562 | 3 | 153–161 | 980.5 | 65 | R.VGYVSGWGR.N | |
| 173–186 | 1707.82 | 95 | K.YVMLPVADQDQCIR.H | C | ||||
| 173–186 | 1723.81 | 50 | K.YVMLPVADQDQCIR.H | C, M | ||||
| 892 | Albumin, isoform CRA_h | 119626071 | 5 | 162–168 | 927.49 | 9 | K.YLYEIAR.R | |
| 427–434 | 960.56 | 35 | K.FQNALLVR.Y | |||||
| 438–452 | 1639.95 | 87 | K.KVPQVSTPTLVEVSR.N | |||||
| 439–452 | 1511.85 | 40 | K.VPQVSTPTLVEVSR.N | |||||
| 502–517 | 1910.94 | 14 | R.RPCFSALEVDETYVPK.E | C | ||||
| 900 | Haptoglobin | 3337390 | 3 | 162–168 | 927.5 | 28 | K.YLYEIAR.R | |
| 427–434 | 960.56 | 41 | K.FQNALLVR.Y | |||||
| 438–452 | 1639.93 | 33 | K.KVPQVSTPTLVEVSR.N | |||||
| 904 | Serum Albumin with S-Naproxen, Chain A | 168988718 | 7 | 6–15 | 1226.61 | 65 | R.FKDLGEENFK.A | |
| 60–68 | 1017.54 | 47 | K.SLHTLFGDK.L | |||||
| 89–101 | 1714.8 | 20 | K.QEPERNECFLQHK.D | |||||
| 132–139 | 1055.59 | 14 | K.KYLYEIAR.R | |||||
| 133–139 | 927.51 | 57 | K.YLYEIAR.R | |||||
| 333–343 | 1311.75 | 21 | R.HPDYSVVLLLR.L | |||||
| 398–405 | 960.57 | 33 | K.FQNALLVR.Y | |||||
| 5 | Albumin, isoform CRA_h | 119626071 | 4 | 162–168 | 927.5 | 28 | K.YLYEIAR.R | |
| 427–434 | 960.56 | 41 | K.FQNALLVR.Y | |||||
| 438–452 | 1639.93 | 33 | K.KVPQVSTPTLVEVSR.N | |||||
| 502–517 | 1910.93 | 18 | R.RPCFSALEVDETYVPK.E | C | ||||
| 24 | Haptoglobin | 3337390 | 3 | 217–225 | 980.52 | 61 | R.VGYVSGWGR.N | |
| 237–250 | 1707.85 | 85 | K.YVMLPVADQDQCIR.H | C | ||||
| 237–250 | 1723.83 | 55 | K.YVMLPVADQDQCIR.H | C, M | ||||
| 25 | Leucine -rich alpha-2-glycoprotein 1 | 16418467 | 3 | 165–175 | 1152.64 | 50 | K.ALGHLDLSGNR.L | |
| 210–216 | 812.48 | 18 | R.GPLQLER.L | |||||
| 251–260 | 989.58 | 45 | R.VAAGAFQGLR.Q | |||||
| 29 | Zinc-Alpha-2 Glycoprotein, Chain B | 4699583 | 4 | 44–51 | 974.49 | 5 | K.SQPMGLWR.Q | |
| 142–153 | 1532.79 | 82 | K.QKWEAEPVYVQR.A | |||||
| 156–167 | 1451.68 | 56 | K.AYLEEECPATLR.K | C | ||||
| 211–217 | 926.49 | 24 | K.IDVHWTR.A | |||||
| 30 | Complement Component C3c, Chain C | 78101271 | 4 | 62–71 | 1250.63 | 41 | K.NTMILEICTR.Y | C |
| 62–71 | 1266.61 | 11 | K.NTMILEICTR.Y | C, M | ||||
| 143–158 | 1841.98 | 120 | K.VHQYFNVELIQPGAVK.V | |||||
| 159 –171 | 1667.74 | 93 | K.VYAYYNLEESCTR.F | C | ||||
| 33 | Lipid-free Apolipoprotein A-I | 90108664 | 3 | 1–10 | 1226.57 | 34 | DEPPQSPWDR.V | |
| 161–171 | 1301.66 | 22 | R.THLAPYSDELR.Q | |||||
| 207–215 | 1012.59 | 3 | K.AKPALEDLR.Q | |||||
| 36 | Hemopexin | 11321561 | 4 | 92 –102 | 1220.61 | 64 | K.NFPSPVDAAFR.Q | |
| 198–208 | 1495.68 | 20 | R.YYCFQGNQFLR.F | |||||
| 209–219 | 1268.68 | 22 | R.FDPVRGEVPPR.Y | |||||
| 226–234 | 1142.49 | 21 | R.DYFMPCPGR.G | |||||
| 566 | Albumin, isoform CRA_k | 119626074 | 5 | 169–180 | 1467.84 | 54 | R.RHPDYSVVLLLR.L | |
| 170–180 | 1311.75 | 24 | R.HPDYSVVLLLR.L | |||||
| 235–242 | 960.57 | 43 | K.FQNALLVR.Y | |||||
| 246–260 | 1639.94 | 103 | K.KVPQVSTPTLVEVSR.N | |||||
| 247–260 | 1511.85 | 67 | K.VPQVSTPTLVEVSR.N | |||||
| 746 | Albumin, isoform CRA_p | 119626064 | 3 | 100–115 | 1910.93 | 93 | R.RPCFSALEVDETYVPK.E | C |
| 161–172 | 1342.62 | 45 | K.AVMDDFAAFVEK.C | |||||
| 161–172 | 1358.62 | 64 | K.AVMDDFAAFVEK.C | M | ||||
| 878 | No Haptoglobin, isoform CRA_d | 119579601 | 5 | 126–133 | 920.46 | 51 | K.GSFPWQAK.M | |
| 233–241 | 980.5 | 77 | R.VGYVSGWGR.N | |||||
| 253–266 | 1707.82 | 94 | K.YVMLPVADQDQCIR.H | C | ||||
| 253–266 | 1723.81 | 63 | K.YVMLPVADQDQCIR.H | C, M | ||||
| 347–356 | 1203.62 | 17 | K.VTSIQDWVQK.T | |||||
| 907 | Leucine -rich alpha-2glycoprotein 1 | 16418467 | 2 | 165–175 | 1152.63 | 30 | K.ALGHLDLSGNR.L | |
| 251–260 | 989.57 | 30 | R.VAAGAFQGLR.Q | |||||
| 976 | Albumin, isoform CRA_g | 119626070 | 3 | 35–44 | 1226.59 | 47 | R.FKDLGEENFK.A | |
| 118–130 | 1714.79 | 14 | K.QEPERNECFLQHK.D | C | ||||
| 162–168 | 927.5 | 29 | K.YLYEIAR.R | |||||
| 18 | Immunoglobulin heavy chain variable region | 39937967 | 1 | 126–137 | 1287.67 | 55 | K.GPSVFPLAPCSR.S | C |
| 236 | No Identification | – | – | |||||
| 365 | Leucine -rich alpha-2-glycoprotein 1 | 16418467 | 3 | 165–175 | 1152.62 | 57 | K.ALGHLDLSGNR.L | |
| 192–209 | 2037.08 | 125 | R.TLDLGENQLETLPPDLLR.G | |||||
| 251–260 | 989.56 | 70 | R.VAAGAFQGLR.Q | |||||
| 467 | Albumin, isoform CRA_g | 119626070 | 6 | 35–44 | 1226.62 | 81 | R.FKDLGEENFK.A | |
| 66–75 | 1149.62 | 59 | K.LVNEVTEFAK.T | |||||
| 89–97 | 1017.54 | 57 | K.SLHTLFGDK.L | |||||
| 118–130 | 1714.81 | 26 | K.QEPERNECFLQHK.D | C | ||||
| 161–168 | 1055.6 | 23 | K.KYLYEIAR.R | |||||
| 162–168 | 927.51 | 42 | K.YLYEIAR.R | |||||
| 542 | Immunoglobulin kappa 1 light chain | 170684606 | 3 | 46–61 | 1747.95 | 23 | K.LLIYDASNLETGVPSR.F | |
| 109–126 | 1946.04 | 57 | R.TVAAPSVFIFPPSDEQLK.S | |||||
| 191–207 | 1875.94 | 57 | K.VYACEVTHQGLSSPVTK.S | C | ||||
| 663 | No Identification | – | – | |||||
| 699 | Immunoglobulin light chain | 149673887 | 4 | 1–18 | 1884.05 | 63 | EIVLTQSPGTLSLSPGER.A | |
| 47–55 | 979.59 | 11 | R.LLIYGASSR.A | |||||
| 63–78 | 1632.82 | 39 | R.FSGSGSGTDFTLTISR.L | |||||
| 128–143 | 1797.92 | 73 | K.SGTASVVCLLNNFYPR.E | C | ||||
| 809 | Albumin, isoform CRA_a | 119626064 | 1 | 162–168 | 927.51 | 24 | K.YLYEIAR.R | |
| 836 | Chain A, Human Serum Transferrin, N-lobe | 29726565 | 9 | 42–50 | 1125.59 | 27 | K.KASYLDCIR.A | C |
| 43 –50 | 997.49 | 30 | K.ASYLDCIR.A | C | ||||
| 89–102 | 1629.82 | 93 | K.EDPQTFYYAVAVVK.K | |||||
| 103–113 | 1323.66 | 3 | K.KDSGFQMNQLR.G | |||||
| 104–113 | 1195.57 | 53 | K.DSGFQMNQLR.G | |||||
| 207–217 | 1273.65 | 98 | K.HSTIFENLANK.A | |||||
| 218–232 | 1881.89 | 113 | K.ADRDQYELLCLDNTR.K | C | ||||
| 221–232 | 1539.73 | 70 | R.DQYELLCLDNTR.K | C | ||||
| 240–254 | 1689.87 | 60 | K.DCHLAQVPSHTVVAR.S | C | ||||
| 865 | No Identification | – | – | |||||
| 875 | No identification | – | – | |||||
| 947 | Chain A, Human Vitamin D Binding Protein | 18655424 | 4 | 35–49 | 1694.9 | 70 | R.KFPSGTFEQVSQLVK.E | |
| 50–71 | 2518.03 | 106 | K.EVVSLTEACCAEGADPDCYDTR.T | 3C | ||||
| 79–98 | 2264.94 | 47 | K.SCESNSPFPVHPGTAECCTK.E | 3C | ||||
| 112–133 | 2707.22 | 111 | K.HQPQEFPTYVEPTNDEICEAFR.K | C |
Peptide position in the matched protein, observed mass (m/z) and amino acid sequence are listed for each protein match found.
Apolipoproteins AI and AII were significantly overexpressed 2.9 (p = 0.008) and 2.6 (p = 0.046) fold, respectively, in polyarticular patients when contrasted against oligoarticular and extended oligoarticular subgroups. In clusters 1 and 3, transferrin was identified as two independent protein spots (42,33) representing non-glycosylated and N-lobe forms of chain A. Levels of the non-glycosylated transferrin were raised 2.0 (p = 0.014) fold in patients who showed disease extension, whereas the transferrin N-lobe displayed the inverse with 2.6 (p = 0.045) fold less, relative to oligoarticular patients. Complement component C3c and hemopexin display analogous overexpression in polyarticular patients when balanced alongside oligoarticular and extended oligoarticular subgroups. Interestingly, from the point of view of JIA pathology vitamin D binding protein was detected in polyarticular patients at significantly overexpressed levels, 2.2 (p = 0.019) fold, when compared to oligoarticular patients in cluster 1.
In addition, several spots (18, 542 and 699) were identified as Immunoglobulin (Ig) fragments within cluster 3 at significantly reduced levels in the patients with disease extension to oligoarticular patients. Ig heavy chain variable region, IgK1 and Ig light chains were under expressed 5.4 (p = 0.030), 3.0 (p = 0.023) and 2.9 (p = 0.020) fold in the extended oligoarticular subgroup relative to the oligoarticular subgroup. Ig heavy chain variable region was concomitantly overexpressed 3.3 (p = 0.032) fold in the polyarticular patients when compared to the extended subgroup. A number of protein spots remained unidentified, attributable to low protein yield from the gel core extraction process.
4. Discussion
Proteins and peptides actively or passively secreted and shed from the synovial membrane accumulate in synovial fluid. Potential biomarkers could therefore be enriched within this fluid relative to plasma. In the first study (group A) we have shown that local and systemic disease can be differentiated by the clustering pattern of 52 proteins with consistent synovial or plasma ‘specific’ expression patterns. This discriminating group of proteins is expressed with at least twofold differences between the two sample types, but how relevant are these findings to the pathology of inflammatory arthritis in children. Fragments or precursors of anti-inflammatory proteins, endogenous protease inhibitors, albumin and complement factors have been identified among these.
A number of inhibitory acute phase proteins were associated with significant differences in local and systemic expression patterns. The levels of transthyretin, transferrin were raised in plasma whereas apolipoproteins (A-I, A-II and C-III) were conversely higher in synovial fluid. In rheumatoid arthritis patients, apolipoprotein A-I plasma levels are lower than normal controls [20], [21], whereas in agreement with our findings the levels are increased in synovial fluid [22], [23]. Apo A-I immunohistological staining is confined to perivascular areas within the synovium of RA patients [24]. It has been suggested that Apo A-I could inhibit the production of proinflammatory cytokine production [25] and may limit disease recurrence by inhibition of interactions between T lymphocytes and monocytes [26].
Investigation of the plasma from patients in the progressive stages of severe acute respiratory syndrome (SARS) revealed that apolipoprotein A-I, transthyretin and transferring were at significantly lower levels than in normal controls and convalescent patients [27]. These proteins belong to the negative acute phase proteins (APPs) and previous studies suggest that plasma concentrations decrease in response to inflammation because of increased rates of transcapillary escape degradation [28].
These proteins have also been identified at increased levels the in cerebrospinal fluid of Alzheimer disease patients where they are thought to function in plaque clearance [29]. It has been suggested that transient infiltration of negative APP plasma proteins may partially explain the relapse-remission cycles characteristic of JIA and other forms of inflammatory arthritis [24].
Raised levels of properdin, a component of the alternative complement activation pathway, were detected in synovial fluid. Properdin activates compliment in the absence of immune complexes by stabilizing the C3 or C5 convertase complexes [30]. It is associated with the engulfing of foreign particles and invading cells by phagocytes and with tissue inflammation. As macrophages and T cells are able to secrete properdin into the synovial fluid, therefore these infiltrated cells are a likely source of the raised levels observed [31], [32].
The increase in blood proteins may be a function of their metabolism within the joint, such that certain isoforms or fragments of a given protein may be detected at higher than anticipated levels. A concentration gradient may also contribute to raised amounts of select proteins due to the fluid pressure differential that exists between blood supplied to the joint and the joint fluid itself [33]. A certain amount of ‘leakiness’ between the two fluids could be anticipated due to a breakdown in the integrity of the synovial capillary network, commonly observed in a range of rheumatic disorders as joint inflammation progresses [34]. The signal from a particular biomarker is likely to diminish with distance from the disease and in particular with dilution into the plasma.
The interpatient differences observed may be indicative of the dilution of a protein into the larger volume of plasma thus generating a narrower concentration interval and as previously eluded to, the heterogenous degrees of joint inflammation which may result in a differential rates of protein turnover across the study patients.
Studies of capillary ultrafiltration and trans-synovial flow rates imply that macromolecular selectivity is a feature of the fenestrated membrane that separates synovial fluid and plasma. Synovial fluid formation is driven by a net imbalance in the pressures between capillary plasma and intra-articular fluid. Continuous drainage from and replenishment into the intra-articular space ensures the synovial fluid proteome remains in flux [33]. Although capillary ultrafiltrate is the base solution for synovial fluid, secretions are made by the local synovial lining cells. Size selectivity has been proposed on the theory that the hyaluronan lining the synovial space is able to filter proteins such as albumin by steric exclusion [35]. The rate of trans-synovial fluid loss and molecular sieving effects are determined by the chain length of hyaluronan concentrated at the synovial membrane surface [36]. Our observation of albumin isoforms at variable stages of degradation across synovial fluid and plasma may reflect molecular sieving between the synovial endothelium and the joint fluid or a differential rate of degradation between the two fluids.
Our study also showed a number of variable MWt / PI isoforms of the same albumin species with variable ratios between synovial fluid and plasma. This also suggests that same protein was subjected to variable post translational modifications, which may direct proportions of a single gene product to select locations relevant to disease pathology [37].
Inter alpha trypsin inhibitor and alpha 1 anti-trypsin were identified at higher synovial levels, compared to plasma which may represent the inherent anti-proteolytic character of normal synovial fluid. It is possible that these proteins are part of a homeostatic negative feedback system which protects the joint during inflammation.. Inter alpha trypsin inhibitor and alpha 1 anti-trypsin were also detected alongside apolipoprotein, transferrin and transthyretin species in a recent 1DE-MS study of normal and osteoarthritic synovial fluids [38]. Support for our findings has been provided in a recent study of 500 peptide fragments from OA synovial fluid, which identified similar acute phase components apolipoprotein F precursor, inter-α inhibitor H4 and serum amyloid A [39]. Untargeted analysis of peptides was performed on synovial fluid from osteoarthritis patients in the liquid phase by reversed-phase nanoLC-MS. and it was suggested that peptide degradation products could reveal clinically relevant information on the activity of peptidases and proteases within the inflamed joint.
In the second study (group B) JIA patient subgroups, classified according to ILAR criteria, can be segregated in early disease based on the clustering patterns of 40 synovial fluid proteins. By extension of this finding, it may be possible to differentiate JIA patients who suffer disease extension within the first year of diagnosis from the other disease subgroups tested. The discriminatory group of proteins is expressed with at least twofold differences between JIA patient subgroups, but how relevant are these findings to the pathology of inflammatory arthritis in children. Several acute-phase proteins, albumins, glycoproteins and immunoglobulins comprise this discriminatory subproteome. Substantial evidence suggests these molecules may govern a wide range of inflammatory pathways with relevance to the pathology of JIA.
A number of inhibitory acute phase proteins were associated with significant differences in JIA subgroup expression patterns. When compared to the synovial fluid proteome levels of the oligoarticular patient subgroup, apolipoprotein A-I was reduced in patients with extended oligoarticular disease, whereas apolipoprotein A-II was higher in the latter. Both apolipoprotein species were significantly higher in the polyarticular patients. In rheumatoid arthritis patients, apolipoprotein A-I levels are increased in synovial fluid [22], [23]. It has been suggested that Apo A-I could inhibit the production of proinflammatory cytokine production [25] and may limit disease recurrence by inhibition of interactions between T lymphocytes and monocytes [26].
In line with apolipoprotein A-I levels, extended oligoarticular patients display a general trend towards reduced transferrin, haptoglobin and complement C3c relative to the other two patient subgroups. In support of the assertion that these relatively abundant host-response proteins could be involved in the spread of inflammation to previously unaffected joints, raised sera levels of these proteins have been recorded in breast cancer patients with metastatic relapse [40]. Furthermore, leucine rich alpha-2-glycoprotein identified in this study has been observed at elevated levels along with other acute phase protein in patients with severe acute respiratory syndrome [41]. Vitamin D binding proteins (VDBP) have been identified in synovial fluid at reduced levels to those found in plasma, reflecting its limited dialysis into the joint space [42]. Our synovial fluid analysis revealed significantly raised levels of VDBP in extended oligoarticular and polyarticular patient subgroups.
The samples used in this study were only taken at the time of initial knee inflammation, therefore are most relevant to the disease pathology in early disease. The data provided indicates that synovial fluid proteome profiles could be used to classify patients based on existing clinical definitions. By virtue of the definition of the extended oligoarticular patient subgroup (become polyarticular after 6 months of initial diagnosis) we consider that both prediction of disease evolution and subgroup discrimination are possible by the proposed protein biomarker panel. The ability to predict disease course would be a powerful tool in the limitation of adverse outcome such as disease extension, as it may flag such patients for more effective/aggressive treatment strategies at an earlier stage in the disease process than is currently possible. The authors consider the collection of samples at the earliest stage in the disease course an important feature of the current study and vital in the discovery of biomarkers which not only ‘describe’ the initial disease processes, but may also act as sentinels to predict subsequent disease outcome. By cataloguing the protein profiles and identities which best describe the joint status as disease progresses, it may also be possible to monitor therapeutic response over time. Furthermore joint proteome records could help predict disease spread and joint damage. Considering the heterogeneity of patient outcome in JIA, therapeutic suppression of synovial joint inflammation, while neglecting the systemic components of chronic disease, may not represent the best possible way to manage non-responsive disease. Longer lasting remission could be possible by taking systemic sentinels into account.
The DIGE technique coupled with MALDI-TOF mass spectrometry limits biomarker detection to within an approximate dynamic range of 5 orders of magnitude. Alternate strategies will be used in future investigations to enrich less abundant proteins in body fluid samples (affinity depletion). Synovial fluid as a partial eluent of plasma is likely to mimic its protein concentration range over 10 orders of magnitude [15]. To reduce the dynamic range of the synovial fluid and enrich for lower abundance proteins, serum albumin and immunoglobulins could be removed by affinity depletion columns in future investigations [43]. Intact and partially degraded proteins or peptide fragments are more likely to leach into the circulating plasma [44]. Low molecular weight components could be enriched by size exclusion or reverse phase chromatography [45].
Protein expression patterns localized in the chronically inflamed joint may have the potential to identify patients more likely to suffer disease which spread to multiple joints. The differences noted are currently being validated with a larger independent patient cohort, where alternate methods of expression and functional analysis will be used to further corroborate the proteomic findings. The proteins identified could act as criteria to prevent disease extension to allow earlier, more aggressive therapeutic intervention.
Acknowledgements
We thank Janne Skaarup Crawford (Alphalyse A/S) for careful compilation of the supplemental MS data. This work has been supported by the Research and Development Office Northern Ireland Grant RRG 8.42 (to D.G. and M.R.)
References
- 1.Symmons D.P., Jones M., Osborne J., Sills J., Southwood T.R., Woo P. Pediatric rheumatology in the united kingdom: data from the British pediatric rheumatology group national diagnostic register. J Rheumatol. 1996;23:1975–1980. [PubMed] [Google Scholar]
- 2.Manners P.J., Bower C. Worldwide prevalence of juvenile arthritis: why does it vary so much? J Rheumatol. 2002;29:1520–1530. [PubMed] [Google Scholar]
- 3.Flato B., Sorskaar D., Vinje O., Lien G., Aasland A., Moum T. Measuring disability in early juvenile rheumatoid arthritis: evaluation of a Norwegian version of the childhood health assessment questionnaire. J Rheumatol. 1998;25:1851–1858. [PubMed] [Google Scholar]
- 4.Flato B., Lien G., Smerdel A., Vinje O., Dale K., Johnston V. Prognostic factors in juvenile rheumatoid arthritis: a case-control study revealing early predictors and outcome after 14.9 years. J Rheumatol. 2003;30:386–393. [PubMed] [Google Scholar]
- 5.Huemer C., Malleson P.N., Cabral D.A., Huemer M., Falger J., Zidek T. Patterns of joint involvement at onset differentiate oligoarticular juvenile psoriatic arthritis from pauciarticular juvenile rheumatoid arthritis. J Rheumatol. 2002;29:1531–1535. [PubMed] [Google Scholar]
- 6.Hii C.S., Marin L.A., Halliday D., Roberton D.M., Murray A.W., Ferrante A. Regulation of human neutrophil-mediated cartilage proteoglycan degradation by phosphatidylinositol-3-kinase. Immunology. 2001;102:59–66. doi: 10.1046/j.1365-2567.2001.01156.x. [DOI] [PMC free article] [PubMed] [Google Scholar]
- 7.de Kleer I.M., Wedderburn L.R., Taams L.S., Patel A., Varsani H., Klein M. CD4+CD25bright regulatory T cells actively regulate inflammation in the joints of patients with the remitting form of juvenile idiopathic arthritis. J Immunol. 2004;172:6435–6443. doi: 10.4049/jimmunol.172.10.6435. [DOI] [PubMed] [Google Scholar]
- 8.Khalkhali-Ellis Z., Seftor E.A., Nieva D.R., Seftor R.E., Samaha H.A., Bultman L. Induction of invasive and degradative phenotype in normal synovial fibroblasts exposed to synovial fluid from patients with juvenile rheumatoid arthritis: role of mononuclear cell population. J Rheumatol. 1997;24:2451–2460. [PubMed] [Google Scholar]
- 9.Foell D., Frosch M., Schulze zur Wiesch A., Vogl T., Sorg C., Roth J. Methotrexate treatment in juvenile idiopathic arthritis: when is the right time to stop? Ann Rheum Dis. 2004;63:206–208. doi: 10.1136/ard.2003.005686. [DOI] [PMC free article] [PubMed] [Google Scholar]
- 10.Uhl M., Krauss M., Kern S., Herget G., Hauer M.P., Altehoefer C. The knee joint in early juvenile idiopathic arthritis. Acta Radiol. 2001;42:6–9. [PubMed] [Google Scholar]
- 11.Honkanen V.E., Rautonen J.K., Pelkonen P.M. Intra-articular glucocorticoids in early juvenile chronic arthritis. Acta Paediatr. 1993;82:1072–1074. doi: 10.1111/j.1651-2227.1993.tb12815.x. [DOI] [PubMed] [Google Scholar]
- 12.Blelock S., McAllister C., Gibson D., Clarke S., Rooney M. Juvenile idiopathic arthritis: joint destruction vs joint repair. clinical and histological findings in early untreated disease. Arthritis Rheum. 2006;54:S692. [Google Scholar]
- 13.Gibson D.S., Blelock S., Brockbank S., Curry J., Healy A., McAllister C. Proteomic analysis of recurrent joint inflammation in juvenile idiopathic arthritis. J Proteome Res. 2006;5:1988–1995. doi: 10.1021/pr060129t. [DOI] [PubMed] [Google Scholar]
- 14.Frosch M., Vogl T., Seeliger S., Wulffraat N., Kuis W., Viemann D. Expression of myeloid-related proteins 8 and 14 in systemic-onset juvenile rheumatoid arthritis. Arthritis Rheum. 2003;48:2622–2626. doi: 10.1002/art.11177. [DOI] [PubMed] [Google Scholar]
- 15.Gibson D.S., Rooney M. The human synovial fluid proteome: a key factor in the pathology of joint disease. Proteomics Clin Appl. 2007;1:889–899. doi: 10.1002/prca.200700044. [DOI] [PubMed] [Google Scholar]
- 16.Rifai N., Gillette M.A., Carr S.A. Protein biomarker discovery and validation: the long and uncertain path to clinical utility. Nat Biotechnol. 2006;24:971–983. doi: 10.1038/nbt1235. [DOI] [PubMed] [Google Scholar]
- 17.Shevchenko A., Tomas H., Havlis J., Olsen J.V., Mann M. In-gel digestion for mass spectrometric characterization of proteins and proteomes. Nat Protoc. 2006;1:2856–2860. doi: 10.1038/nprot.2006.468. [DOI] [PubMed] [Google Scholar]
- 18.Pappin D.J., Hojrup P., Bleasby A.J. Rapid identification of proteins by peptide-mass fingerprinting. Curr Biol. 1993;3:327–332. doi: 10.1016/0960-9822(93)90195-t. [DOI] [PubMed] [Google Scholar]
- 19.Sinz A., Bantscheff M., Mikkat S., Ringel B., Drynda S., Kekow J. Mass spectrometric proteome analyses of synovial fluids and plasmas from patients suffering from rheumatoid arthritis and comparison to reactive arthritis or osteoarthritis. Electrophoresis. 2002;23:3445–3456. doi: 10.1002/1522-2683(200210)23:19<3445::AID-ELPS3445>3.0.CO;2-J. [DOI] [PubMed] [Google Scholar]
- 20.Park Y.B., Lee S.K., Lee W.K., Suh C.H., Lee C.W., Lee C.H. Lipid profiles in untreated patients with rheumatoid arthritis. J Rheumatol. 1999;26:1701–1704. [PubMed] [Google Scholar]
- 21.Doherty N.S., Littman B.H., Reilly K., Swindell A.C., Buss J.M., Anderson N.L. Analysis of changes in acute-phase plasma proteins in an acute inflammatory response and in rheumatoid arthritis using two-dimensional gel electrophoresis. Electrophoresis. 1998;19:355–363. doi: 10.1002/elps.1150190234. [DOI] [PubMed] [Google Scholar]
- 22.Ananth L., Prete P.E., Kashyap M.L. Apolipoproteins A-I and B and cholesterol in synovial fluid of patients with rheumatoid arthritis. Metabolism. 1993;42:803–806. doi: 10.1016/0026-0495(93)90050-x. [DOI] [PubMed] [Google Scholar]
- 23.Busso N., Dudler J., Salvi R., Peclat V., Lenain V., Marcovina S. Plasma apolipoprotein(a) co-deposits with fibrin in inflammatory arthritic joints. Am J Pathol. 2001;159:1445–1453. doi: 10.1016/S0002-9440(10)62531-X. [DOI] [PMC free article] [PubMed] [Google Scholar]
- 24.Bresnihan B., Gogarty M., FitzGerald O., Dayer J.M., Burger D. Apolipoprotein A-I infiltration in rheumatoid arthritis synovial tissue: a control mechanism of cytokine production? Arthritis Res Ther. 2004;6:R563–R566. doi: 10.1186/ar1443. [DOI] [PMC free article] [PubMed] [Google Scholar]
- 25.Hyka N., Dayer J.M., Modoux C., Kohno T., Edwards C.K., III, Roux-Lombard P. Apolipoprotein A-I inhibits the production of interleukin-1beta and tumor necrosis factor-alpha by blocking contact-mediated activation of monocytes by T lymphocytes. Blood. 2001;97:2381–2389. doi: 10.1182/blood.v97.8.2381. [DOI] [PubMed] [Google Scholar]
- 26.Burger D., Dayer J.M. The role of human T-lymphocyte–monocyte contact in inflammation and tissue destruction. Arthritis Res. 2002;4(Suppl 3):S169–S176. doi: 10.1186/ar558. [DOI] [PMC free article] [PubMed] [Google Scholar]
- 27.Wan J., Sun W., Li X., Ying W., Dai J., Kuai X. Inflammation inhibitors were remarkably up-regulated in plasma of severe acute respiratory syndrome patients at progressive phase. Proteomics. 2006;6:2886–2894. doi: 10.1002/pmic.200500638. [DOI] [PMC free article] [PubMed] [Google Scholar]
- 28.Mikkat S., Koy C., Ulbrich M., Ringel B., Glocker M.O. Mass spectrometric protein structure characterization reveals cause of migration differences of haptoglobin alpha chains in two-dimensional gel electrophoresis. Proteomics. 2004;4:3921–3932. doi: 10.1002/pmic.200400825. [DOI] [PubMed] [Google Scholar]
- 29.Hu Y., Malone J.P., Fagan A.M., Townsend R.R., Holtzman D.M. Comparative proteomic analysis of intra- and interindividual variation in human cerebrospinal fluid. Mol Cell Proteomics. 2005;4:2000–2009. doi: 10.1074/mcp.M500207-MCP200. [DOI] [PubMed] [Google Scholar]
- 30.Muller-Eberhard H.J., Schreiber R.D. Molecular biology and chemistry of the alternative pathway of complement. Adv Immunol. 1980;29:1–53. doi: 10.1016/s0065-2776(08)60042-5. [DOI] [PubMed] [Google Scholar]
- 31.Schwaeble W., Huemer H.P., Most J., Dierich M.P., Strobel M., Claus C. Expression of properdin in human monocytes. Eur J Biochem. 1994;219:759–764. doi: 10.1111/j.1432-1033.1994.tb18555.x. [DOI] [PubMed] [Google Scholar]
- 32.Wirthmuller U., Dewald B., Thelen M., Stover C., Schafer M.K., Whaley K. Properdin, a positive regulator of complement activation, is released from secondary granules of stimulated peripheral blood neutrophils. J Immunol. 1997;158:4444–4451. [PubMed] [Google Scholar]
- 33.Levick J.R. A method for estimating macromolecular reflection by human synovium, using measurements of intra-articular half lives. Ann Rheum Dis. 1998;57:339–344. doi: 10.1136/ard.57.6.339. [DOI] [PMC free article] [PubMed] [Google Scholar]
- 34.Gaffney K., Cookson J., Blades S., Coumbe A., Blake D. Quantitative assessment of the rheumatoid synovial microvascular bed by gadolinium-DTPA enhanced magnetic resonance imaging. Ann Rheum Dis. 1998;57:152–157. doi: 10.1136/ard.57.3.152. [DOI] [PMC free article] [PubMed] [Google Scholar]
- 35.Levick J.R., McDonald J.N. Fluid movement across synovium in healthy joints: role of synovial fluid macromolecules. Ann Rheum Dis. 1995;54:417–423. doi: 10.1136/ard.54.5.417. [DOI] [PMC free article] [PubMed] [Google Scholar]
- 36.Sabaratnam S., Arunan V., Coleman P.J., Mason R.M., Levick J.R. Size selectivity of hyaluronan molecular sieving by extracellular matrix in rabbit synovial joints. J Physiol. 2005;567:569–581. doi: 10.1113/jphysiol.2005.088906. [DOI] [PMC free article] [PubMed] [Google Scholar]
- 37.Oettl K., Stauber R.E. Physiological and pathological changes in the redox state of human serum albumin critically influence its binding properties. Br J Pharmacol. 2007;151:580–590. doi: 10.1038/sj.bjp.0707251. [DOI] [PMC free article] [PubMed] [Google Scholar]
- 38.Gobezie R., Kho A., Krastins B., Sarracino D.A., Thornhill T.S., Chase M. High abundance synovial fluid proteome: distinct profiles in health and osteoarthritis. Arthritis Res Ther. 2007;9:R36. doi: 10.1186/ar2172. [DOI] [PMC free article] [PubMed] [Google Scholar]
- 39.Kamphorst J.J., Heijden R.V., Degroot J., Lafeber F.P., Reijmers T.H., El B.V. Profiling of endogenous peptides in human synovial fluid by NanoLC-MS: Method validation and peptide identification. J Proteome Res. 2007;6:4388–4396. doi: 10.1021/pr0704534. [DOI] [PubMed] [Google Scholar]
- 40.Goncalves A., Esterni B., Bertucci F., Sauvan R., Chabannon C., Cubizolles M. Postoperative serum proteomic profiles may predict metastatic relapse in high-risk primary breast cancer patients receiving adjuvant chemotherapy. Oncogene. 2006;25:981–989. doi: 10.1038/sj.onc.1209131. [DOI] [PubMed] [Google Scholar]
- 41.Chen J.H., Chang Y.W., Yao C.W., Chiueh T.S., Huang S.C., Chien K.Y. Plasma proteome of severe acute respiratory syndrome analyzed by two-dimensional gel electrophoresis and mass spectrometry. Proc Natl Acad Sci U S A. 2004;101:17039–17044. doi: 10.1073/pnas.0407992101. [DOI] [PMC free article] [PubMed] [Google Scholar]
- 42.Fairney A., Straffen A.M., May C., Seifert M.H. Vitamin D metabolites in synovial fluid. Ann Rheum Dis. 1987;46:370–374. doi: 10.1136/ard.46.5.370. [DOI] [PMC free article] [PubMed] [Google Scholar]
- 43.Liao H., Wu J., Kuhn E., Chin W., Chang B., Jones M.D. Use of mass spectrometry to identify protein biomarkers of disease severity in the synovial fluid and serum of patients with rheumatoid arthritis. Arthritis Rheum. 2004;50:3792–3803. doi: 10.1002/art.20720. [DOI] [PubMed] [Google Scholar]
- 44.Thadikkaran L., Siegenthaler M.A., Crettaz D., Queloz P.A., Schneider P., Tissot J.D. Recent advances in blood-related proteomics. Proteomics. 2005;5:3019–3034. doi: 10.1002/pmic.200402053. [DOI] [PubMed] [Google Scholar]
- 45.Glocker M.O., Guthke R., Kekow J., Thiesen H.J. Rheumatoid arthritis, a complex multifactorial disease: on the way toward individualized medicine. Med Res Rev. 2006;26:63–87. doi: 10.1002/med.20045. [DOI] [PubMed] [Google Scholar]