

Abstract
This study focused on the investigation of the effectiveness of negative air ionization (NAI), photocatalytic oxidation (PCO), and the combination of NAI and PCO on the removal of aerosolized Escherichia coli, Candida famata, and vir phage under different relative humidity. The experiments were conducted with a stainless steel reactor equipped with a negative air ion generator, a photocatalytic filter, and two ultraviolet lamps with 365 nm wavelength. The removal efficiency , defined as one minus the ratio of the outlet concentration to the inlet concentration of the appropriate bioaerosol, was used to evaluate the effectiveness of the removal methods. The combination of NAI and PCO was the most efficient removal method for aerosolized E. coli, C. famata, and vir phage . In this removal method, the contributions of NAI were higher than those of PCO for the removal of E. coli and C. famata; for the removal of virus phage the contributions of NAI and PCO were comparable NAI was the least efficient removal method for bioaerosols, and the removal efficiencies are: for E. coli; for C. famata; and for vir phage.
Keywords: Bioaerosols, Photocatalytic oxidation, Negative air ionization, Reactor, Relative humidity
1. Introduction
Owing to the outburst of SARS (severe acute respiratory syndrome), the increasing occurrence of asthma and respiratory tract diseases, and the deterioration of indoor air quality, the need for controlling bioaerosol exposures has increased recently (Agranovski et al., 2004, Douwes et al., 2003, Gustavsson, 1999, Pastuszka et al., 2000). To reduce the health risk from bioaerosols exposures, various controlling technologies for this contaminant, including photocatalytic oxidation (PCO) (Grinshpun et al., 2007, Keller et al., 2005; Lin and Li, 2003a, Lin and Li, 2003b; Vohra et al., 2005, Vohra et al., 2006) and negative air ionization (NAI) (Grinshpun et al., 2007; Mitchell & King, 1994; Noyce & Hughes, 2002), have been investigated.
PCO has been applied for the purification of volatile organic compounds (VOCs) (Luo and Ollis, 1996, Yu and Lee, 2007; Yu, Lee, Huang, Wu, & Yang, 2006) and for the disinfection of microbial contaminations in liquid phase (Cho et al., 2005, Christensen et al., 2003, Lee et al., 1997, Sunada et al., 1998). Moreover, the mechanisms of PCO for the removal of microbial contaminations and VOCs have also been reported (Cho et al., 2005, Maness et al., 1999, Sunada et al., 1998, Yu and Lee, 2007; Yu et al., 2006). Lin and Li (2003a) demonstrated that the effectiveness of a photocatalytic filter on the removal of bioaerosols was insignificant, which might be caused by a lack of enough time (on the order of 1 s) for the microorganisms to contact and react with the and reactive species generated by the PCO reaction. Some studies also showed that the destruction of microorganisms increased significantly with the time exposure to the photocatalyst and the contact surface between the microorganism and photocatalyst (Keller et al., 2005, Vohra et al., 2006). Lin and Li (2003a) recommended that the reaction time of the photocatalyst with the collected microorganisms could be extended by enhancing the filtration efficiency of the photocatalytic filter. NAI seems to be one of the good choices to fulfill this purpose (Lee, Yermakov, & Grinshpun, 2004a). Additionally NAI can be used as a removal method for bioaerosols (Fan et al., 2002, Grinshpun et al., 2007, Mitchell and King, 1994, Noyce and Hughes, 2002) The removal of aerosol contaminants by unipolar air ionization (usually NAI) in indoor environments (Grabarczyk, 2001, Grinshpun et al., 2007; Lee, Yermakov, & Grinshpun, 2004b) or confined indoor spaces (Grinshpun et al., 2005) has been studied. Mayya, Sapra, Khan, and Sunny (2004) developed a model to analyze the physical factors which influenced the aerosol removal in the presence of unipolar air ionization.
The objectives of this work are to investigate the bioaerosols removal efficiency of the combination of NAI and PCO, and to systematically study the factors affecting the removal efficiency.
2. Experimental method
2.1. Test microorganisms
Escherichia coli (Bioresource Collection and Research Center in Taiwan, BCRC 10675), Candida famata (BCRC 22304, a kind of yeast), and vir phage (BCRC 70193) were selected as the model strains of bacteria, fungi, and viruses, respectively. E. coli is a common rod-shaped bacterium with a particle size of about and is often selected as a challenge bioaerosol for germicidal tests (Keller et al., 2005; Lin and Li, 2003a, Lin and Li, 2003b; Maness et al., 1999; Vohra et al., 2005, Vohra et al., 2006). C. famata is a frequently encountered airborne yeast with a particle size of about and has been selected as a challenge bioaerosol for germicidal tests (Lin and Li, 2003a, Lin and Li, 2003b). vir phage is a harmless virus with an isometric head of about in diameter and a thin flexible tail of about in length and about 7 nm in diameter. The host of vir phage is E. coli K12S (BCRC 14894), and this phage has been evaluated as a prospective surrogate for water-borne and food-borne viruses (Chen, Joerger, Hoover, & Kingsley, 2004). The test microorganisms from BCRC were shipped in freeze-dried form and needed to be activated before the experiments. The activation procedures were conducted according to the BCRC product instruction sheets After the activation, the E. coli and C. famata cultures were transferred to the tryptic soy agar (TSA, Difco™) plate (and slant) and the malt extract agar (MEA, Difco™) plate (and slant), respectively. The E. coli culture was incubated at 37 °C for 24 h, and the C. famata culture at 25 °C for 48 h. The E. coli and C. famata cultures and vir phage stock were stored in a 4 °C refrigerator. Before the experiments, the test microorganisms were prepared as stocks for bioaerosols generation. The stock preparation processes are described in Sections 2.1.1.–2.1.3.
2.1.1. E. coli
We transferred three E. coli colonies from the agar plate culture to a conical flask containing 30 mL tryptic soy broth (TSB, Bacto™) with a loop Then, the TSB culture was incubated under a shaking condition of 85 rpm, for 16–24 h at 37 °C. After the incubation, the TSB culture was centrifuged at 2500 rpm for 5 min. Then, we removed the resulting supernatant, added 30 mL PBS solution (phosphate buffered saline, pH 7.2) and re-suspended the E. coli sediment. The PBS buffer solution was used to minimize the osmotic pressure between the microbial cellular fluids and the buffer solution. The above processes (except the incubation) were repeated twice to eliminate the TSB medium The final PBS solution (E. coli stock) was used for the bioaerosol generation. The concentration of the viable E. coli in the PBS solution was determined by counting colony-forming unit (CFU) on agar plates (serial dilution method) (Cappuccuno & Sherman, 1996).
2.1.2. C. famata
Three C. famata colonies were transferred from the agar plate culture to a conical flask containing 30 mL YM (yeast malt extract) broth (Difco™) with a loop. Then, the YM broth was incubated under a shaking condition of 85 rpm, for 16–24 h at 25 °C. The procedure for C. famata stock preparation (in PBS soultion) was the same as that for E. coli stock. The procedure to quantitate the viable cells in the C. famata stock was the same as that for E. coli.
2.1.3. vir phage
Briefly, 1 mL of E. coli K12S (host cell) 16 h TSB culture was put into each TSA plate and laid aside for 2 h (each experimental set required six plates). Then we removed the redundant E. coli K12S TSB culture from the surface of the TSA plates and added of viral stock to each plate. A sterile bent glass rod was used to spread the host culture and the vir phage stock uniformly over the surface of the agar plates. All the plates were incubated for 8–16 h at 37 °C. After the incubation, we put 6 mL of sterilized distilled water into each plate and shook these plates at 50–60 rpm for 5 min. The supernatant was centrifuged at 10,000 rpm for 10 min and filtered with a filter unit (Millipore Corporation, Carrigtwohill, Co. Cork, Ireland) to remove the host cells. The filtered liquid ( vir phage stock) was used for the bioaerosol generation. The infective vir phage concentration in the stock was enumerated by counting plaque-forming unit (PFU) (the doublelayer agar method) (Cappuccuno & Sherman, 1996).
2.2. Experimental schemes
The experimental system included a pure air supply unit, a relative humidity (RH) regulation unit, a bioaerosol generation unit, a reactor, and a bioaerosol sampling unit, as shown in Fig. 1 .
Fig. 1.
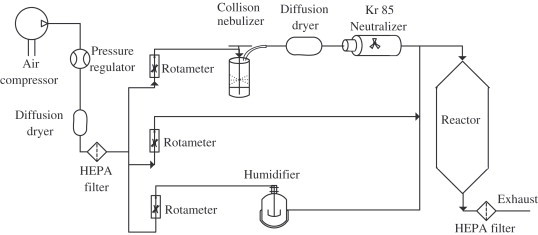
Schematic diagram of experimental system.
2.2.1. Pure air supply unit and RH regulation unit
The supply air for the experimental system was provided by an air compressor and its pressure was regulated by a CKD pressure regulator (R4000, CKD Corporation, Japan). The particulate matter (including both biological and non-biological particles) and the humidity of the supply air were removed by an HEPA filter (HEPA capsule, Lot A10536355, Pall Corporation, USA) and a diffusion dryer (Model 306200, TSI, USA), respectively.
The RH of the experimental system was controlled by the ratio of the flow rate of the saturated air passing through the humidifier (containing sterilized distilled water) to the total air flow rate. The air flow rates of the dry air, the saturated air, and the bioaerosol generation unit were regulated by three rotameters (Aalborg, Orargeburg, NY, USA) and the total air flow rate of the experimental system was 50 LPM (liters per minute).
2.2.2. Bioaerosol generation unit
The bioaerosols used in the experiments were generated by a Collison three-jet nebulizer (BGI Inc., Waltham, MA, USA) with an air flow of 3 LPM. A diffusion dryer (Model 306200, TSI, USA) was used to remove the water of the generated bioaerosols to form droplet nuclei A particle charge neutralizer (Model 3099, TSI, USA) was employed to neutralize the droplet nuclei to Boltzmann charge equilibrium.
2.2.3. Reactor
The experiments were conducted with a stainless steel reactor of a cross-section. Fig. 2 shows the schematic diagram of the reactor. A negative air ion generator (STR-21-R, RAYUAN Company LTD., Taipei, Taiwan) was installed in the reactor and the emission source was 7 cm below the inlet. The negative air ion concentration was as measured by an air ion counter (Model ITC-201A, ANDES, Japan) at a distance of 20 cm from the emission source (where the photocatalytic filter was located) at the air flow rate of 50 LPM. There was no ozone detected when the negative air ion generator was operating.
Fig. 2.
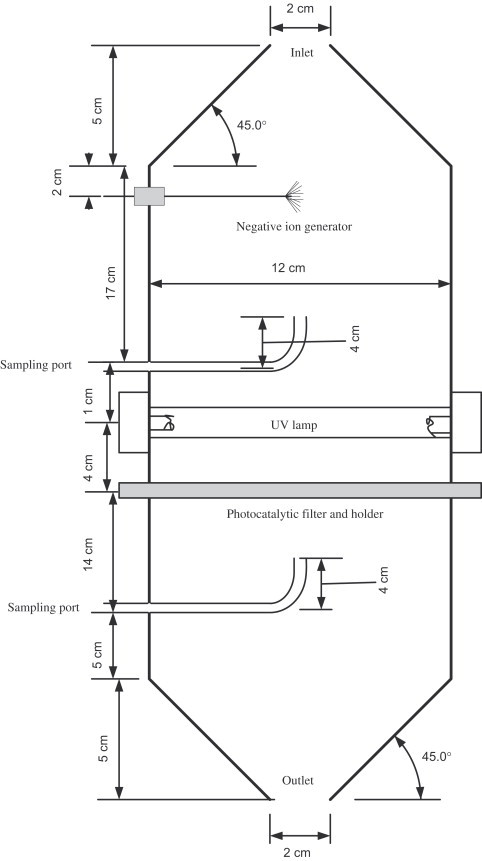
Schematic diagram of reactor.
A mechanical filter (, Klean Filter Ins. Taipei, Taiwan) coated with the Degussa P25 photocatalyst (Degussa Japan Co., Ltd.) was used as the photocatalytic filter. The filter, made of synthetic fibers, has a basis weight of and a porosity of about 0.91. The coating procedure was as follows, which was referred to in our previous study (Yu et al., 2006). Briefly, 25 g of the powder was suspended in 150 mL distilled water in an ultrasonic tank (Branson 5200, Branson Ultrasonic Corp., CT, USA). Then, the filter was immersed in the sludge. After the filter became dry, a coating remained on the surface of the filter fiber . Fig. 3 (a) and (b) shows the scanning electron microscopic images of the filter with and without the photocatalyst coating, respectively. Accordingly, the diameter of the filter fiber is about .
Fig. 3.
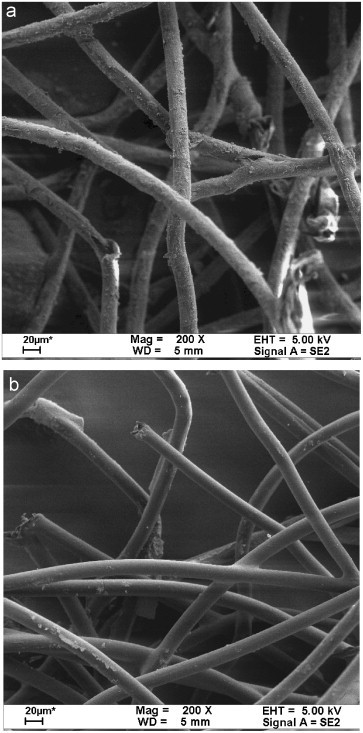
Scanning electron microscopic images of the filters (a) with and (b) without photocatalyst coated.
Fig. 4 shows the setting of the photocatalytic filter and the UV lamps from the top. The UV lamps used in this study were two 8-W, UVA (central wavelength at 365 nm) strip light bulbs (Philips, Netherlands).
Fig. 4.
Photocatalytic filter and UV lamps setting (top view).
2.2.4. Bioaerosol sampling unit
An AGI-30 sampler (Model 7540, ACE GLASS Inc., NJ, USA) and a sampling pump (All Field Tech, Taiwan) were used for the bioaerosols sampling. This sampler was recommended by the American Conference of Governmental Industrial Hygienists and the International Aerobiology Symposium for sampling viable microorganisms (Jensen, Todd, Davis, & Scarpino, 1992), and its collection efficiency for aerosolized viruses was comparable to those of other samplers (Tseng & Li, 2005). The collection efficiency of the sampler is a function of the particle diameter and the sampling flow rate (Hogan et al., 2005).
The sampling flow rate was 12.5 LPM and the sampling time was 6–8 min. Sterilized PBS buffer solution (40 mL) was used as the sampling medium for the aerosolized E. coli and C. famata Instead of the commonly used peptone broth, sterilized distilled water was used for sampling the aerosolized vir phage because there was no difference in the collection efficiency between these two media (Tseng & Li, 2005).
2.3. Experimental procedures
Before the experiments began, the experimental system was sterilized with 70% ethanol vapor. In the sterilization process, 30 mL of ethanol was placed in the nebulizer, and the air flow rate through the nebulizer was adjusted to 3 LPM. After the ethanol was totally evaporated, we used filtered dry air to purge the nebulizer and the experimental system for 30 min.
In the experiments, 30 mL of the test microorganism stock was placed in the nebulizer. The air flow rate through the nebulizer was adjusted to 3 LPM and the total air flow was adjusted to 50 LPM (the filtration face ). The experiments were conducted under RH of 30%, 50%, and 70% to represent low, medium, and high humidity conditions, respectively. It took about 30–50 min for the experimental system to achieve a steady state. The air samples for assessing the removal effectiveness of aerosolized microorganisms were taken at the upstream and downstream of the photocatalytic filter with two AGI-30 impingers containing 40 mL of PBS solution (for E. coli and C. famata) or 40 mL of sterilized distilled water (for vir phage), respectively. The removal methods consisted of NAI, the photocatalytic filter without the illumination of UV-A light, NAI and the photocatalytic filter without the illumination of UV-A light, the photocatalytic filter with the illumination of UV-A light and the combination of NAI and the photocatalytic filter with the illumination of UV-A light. The notations of the removal methods above were simplified as follows (NAI as “N”, the UV lamp as “U” and the photocatalytic filter without UV radiation as “PF”):
- Method N
NAI
- Method PF
the photocatalytic filter without the illumination of UV-A light
- Method NPF
NAI and the photocatalytic filter without the illumination of UV-A light
- Method UPF
the photocatalytic filter with the illumination of UV-A light
- Method NUPF
the combination of NAI and the photocatalytic filter with the illumination of UV-A light.
In order to distinguish the effectiveness of 365 nm UV light (without the photocatalyst filter) from that of the photocatalytic filter with the illumination of UV-A light, a separate experiment was conducted with only the UV lamp operating in the absence of photocatalytic filter. The blank experiments were conducted in the absence of the photocatalytic filter without the negative air ion generator and the UV lamps operating. The procedures for the enumeration of viable E. coli, C. famata, and vir phage concentrations in the sampling solutions are described in Sections 2.1.1.–2.1.3. The concentration of the aerosolized microorganism was calculated by the following equation:
| (1) |
where CFU is the colony-forming unit (of E. coli and C. famata); PFU is the plaque-forming unit (of vir phage); DF is the dilution factor; is the sampling flow rate; and (minute) is the sampling time.
2.4. Data interpretation
The aerosolized microorganism removal efficiency is calculated by the following equation:
| (2) |
where is the inlet concentration and is the exit concentration of the appropriate bioaerosol. However, since the negative air ion generator is upstream of the first sampling port, its effect is already seen in the . Therefore, the removal efficiency of NAI measured in this study represented the microbial removal between the first and second sampling ports instead of the whole reactor.
We defined the enhancement removal efficiency of NAI as the removal efficiency of the Method NPF subtracted by the removal efficiency of the Method PF:
| (3) |
where is the removal efficiency of the Method NPF and is the removal efficiency of the Method PF with regard to the experiments of the Method NPF.
The calculation of the enhancement removal efficiency of PCO is similar to :
| (4) |
where is the removal efficiency of the Method UPF and is the removal efficiency of the Method PF with regard to the experiments of the Method PFU.
The enhancement removal efficiency of the combination of NAI and PCO (NAI/PCO) was calculated by the following equation:
| (5) |
where is the NAI/PCO enhancement removal efficiency, is the removal efficiency of the Method NUPF, and is the removal efficiency of the Method PF with regard to the experiments of the Method NUPF.
2.4.1. Statistics
To assess the statistically significant differences, the comparisons of the removal efficiencies between different methodologies (see Fig. 6), RH (see Fig. 7, Fig. 8), and microorganisms (see Fig. 9) were carried out by the ANOVA (analysis of variance, the one-way classification) (Steel, Torrie, & Dickey, 1997).
Fig. 6.
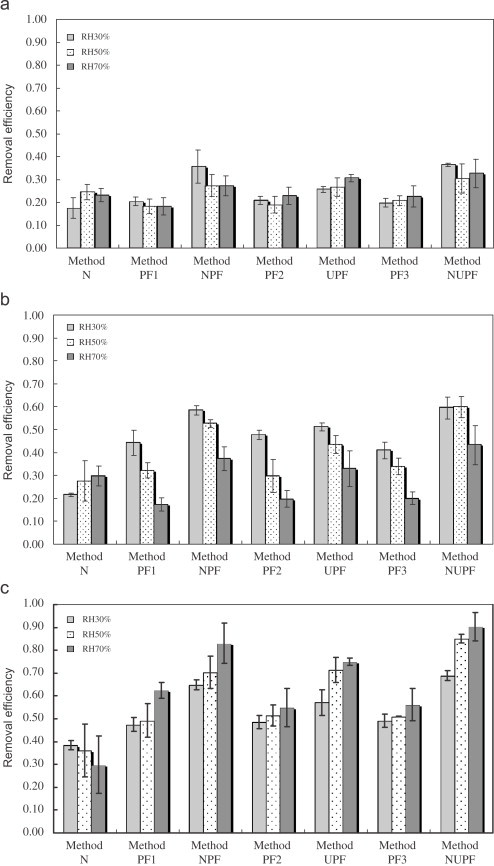
Removal efficiencies of aerosolized (a) E. coli, (b) C. famata, and (c) virus phage of different removal method. PF1, 2, and 3 are the removal efficiency of photocatalytic filter observed when the NPF, UPF, and NUPF experiments were conducted. The error bars represent the standard deviation of at least three repeated experiments (face velocity: 0.058 m/s) (statistics: treatments: removal methods; for E. coli, C. famata, and virus phage under all RH conditions).
Fig. 7.
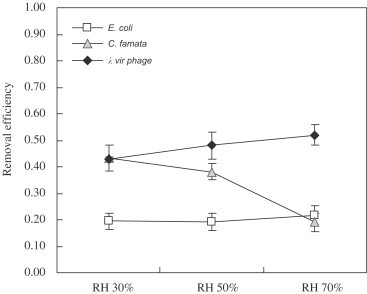
Removal efficiencies of aerosolized E. coli, C. famata, and virus phage of photocatalytic filter (without the illumination of UV-A). The error bars represent the standard deviation of at least three repeated experiments (face velocity: 0.058 m/s) (statistic: treatment: RH; for C. famata and virus phage).
Fig. 8.
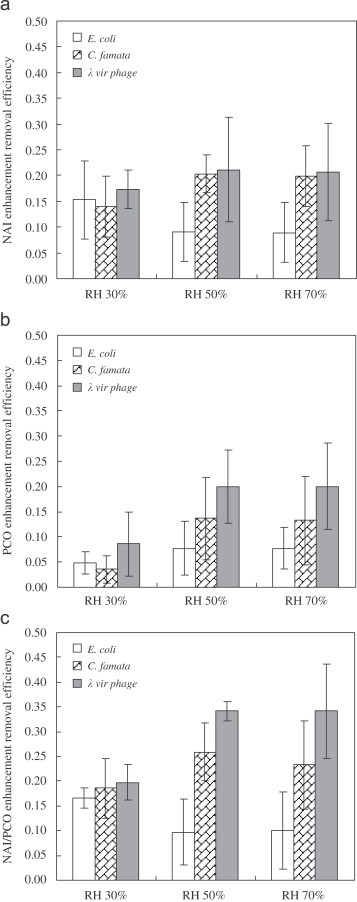
(a) NAI, (b) PCO, and (c) NAI/PCO enhancement removal efficiencies of aerosolized E. coli, C. famata, and virus phage (face velocity: 0.058 m/s) (statistics: treatment: RH, in (a) for E. coli and C. famata, in (b) for C. famata and virus phage, in (c) for E. coli, C. famata, and virus phage).
Fig. 9.
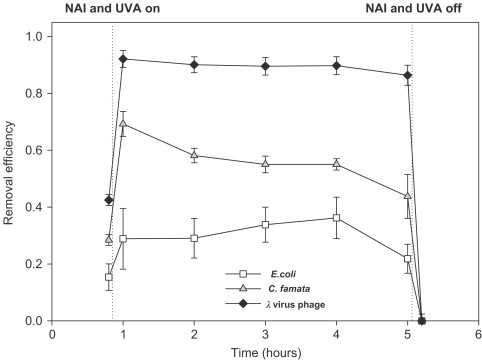
Time profile of test microorganism removal efficiencies of the Method NUPF (face velocity: 0.058 m/s, RH 50%) (statistic: treatment: microorganism; for E. coli, C. famata, and virus phage).
3. Results and discussion
3.1. Nebulization factor
The concentrations of the test microorganisms in the nebulizer and the aerosolized test microorganisms are shown in Table 1 . In order to evaluate the stability of the experimental system, we defined the ratio of the logarithm of to the logarithm of as the nebulization factor, given by the following equation:
| (6) |
where NF is the nebulization factor, ( or ) is the concentration of the aerosolized test microorganism measured at the upstream sampling port, and (CFU/mL or PFU/mL) is the concentration of the test microorganism in the nebulizer.
Table 1.
The concentrations of the test microorganism in the nebulizer and aerosolized
| Microorganism | Microorganism in the nebulizer (CFU/mL or PFU/mL) | Microorganism aerosolized ( or ) |
|---|---|---|
| E. coli | ||
| C. famata | ||
| virus phage |
Fig. 5 shows that when the RH increased from 30% to 70%, the nebulization factors of C. famata and virus phage would increase from to and from to , respectively. It implied that the survival rates of the aerosolized C. famata and virus phage increased with the RH. However, the effect of RH on the nebulization factor of E. coli was insignificant.
Fig. 5.
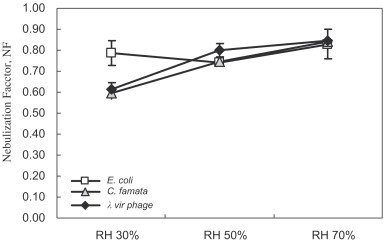
Nebulization factor of the test microorganism in the experimental system. The error bars represent the standard deviation of at least three repeated experiments (flow rate of nebulizer: 3 LPM; flow rate of reactor: 50 LPM).
3.2. Removal efficiency of different removal methods
Fig. 6 (a)–(c) shows the aerosolized E. coli, C. famata, and virus phage removal efficiencies of different methodologies, respectively. The data mentioned above had been subtracted by the removal efficiency of blank experiments, which ranged from 0.002 to 0.009 for E. coli, from 0.0067 to 0.074 for C. famata and from 0.057 to 0.061 for virus phage. According to the results of ANOVA, the differences in removal efficiencies between different removal methods (Method N, PF, NPF, UPF, and NUPF) were significant . Generally, the order of E. coli removal efficiency of different methodologies was the Method , while those of C. famata and vir phage were both the Method .
3.2.1. Filtration (PF)
The order of filtration efficiencies for the aerosolized test microorganisms were virus phage C. famata E. coli, as shown in Fig. 7 . The single-fiber efficiency of filtration could explain this result. According to the relationship between the particle size and the filtration mechanisms, virus phage was collected mainly by the diffusion, while C. famata and E. coli were captured mostly by the inertial impaction and interception. The single-fiber efficiency for diffusion is given as (Hinds, 1999)
| (7) |
where Pe is the Peclet number, is the diameter of filter fiber (about , see Fig. 3), is the filter face velocity, and D is the particle diffusion coefficient, which is given by
| (8) |
where k is the Boltzmann constant, T is the absolute temperature, is the Cunningham correction factor, is the viscosity of air, and is the particle size.
The single-fiber efficiency for interception can be expressed as the following equation:
| (9) |
where is the porosity of the filter , , and Ku is given as follows:
| (10) |
The single-fiber efficiency for inertial impaction can be expressed as the following equation:
| (11) |
where Stk is the Stokes number and J is given as follows:
| (12) |
Table 2 shows the calculation results of the single-fiber efficiencies of E. coli, C. famata, and virus phage for various filtration mechanisms. Accordingly the filtration efficiency of C. famata was higher than that of virus phage which was opposite to our experimental result. This might be due to the reentrainment of C. famata deposited on the filter fiber, since larger particles had higher possibility of reentrainment (Qian, Willeke, Ulevicius, & Grinshpun, 1997).
Table 2.
Single-fiber efficiency of the test microorganism
| Microorganism | Total efficiency | |||
|---|---|---|---|---|
| E. coli | 0.00201 | 0.0024 | 0.00486 | |
| C. famata | 0.00087 | 0.0223 | 0.0247 | 0.0478 |
| virus phage | 0.0332 | 0.0331 |
The effect of RH on the E. coli removal efficiency of the Method PF was insignificant, as shown in Fig. 7. However, the C. famata removal efficiency decreased with the increase of RH, due to the fact that under higher RH C. famata could survive longer and most of the cells were still viable after the reentrainment.
The virus phage removal efficiency of the Method PF increased with RH. This result might be ascribed to the hygroscopy which was relevant to the hydrophilic functional groups, such as carboxylic and amide group in the protein coat of virus phage (Grdadolnik & Maréchal, 2001). The hygroscopy of the protein coat might increase the adhesion of the virus phage particles, and thus enhance the filtration efficiency.
3.2.2. Negative air ionization (NAI)
The virus phage removal efficiency of the Method N was higher than E. coli and C. famata removal efficiencies, as shown in Fig. 6. This might be owing to the particle size of virus phage (about ) being smaller than those of E. coli (about ) and C. famata (about ). In our previous study (Wu, Lee, Cheng, Yang, & Yu, 2006), we found that NAI was more efficient in the removal of small particles than large particles , and this result was attributed to that smaller particles had higher mobility. The findings above were consistent with the results of Grinshpun et al. (2007) and the “ionizer-aided aerosol removal model” proposed by Mayya et al. (2004) in which the aerosol removal efficiency was higher for particle size smaller than . Besides, the lack of self-protection mechanisms, such as synthesis of superoxide dismutase, against the negative air ions (most were superoxide, ) also resulted in the higher removal efficiency for virus phage.
As shown in Fig. 6(a) and (b), the E. coli removal efficiency of the Method N was lower than the C. famata removal efficiency. The higher resistance of E. coli to negative air ions compared to that of C. famata might result from that the bacterial membranes had a net negative charge which was ascribed to the , , and groups (Noyce & Hughes, 2002).
The virus phage removal efficiency of the Method N decreased with RH increasing, as shown in Fig. 6(c). In addition, the error bars under RH 70% and 50% were larger than those under RH 30%. These were reasonable results since the negative air ions possessed a higher decay rate (unstable) and lower mobility under higher RH (Fujioka, Tsunoda, Sugimura, & Arai, 1983; Wu, Lee, Yang, Yu, & Lou, 2006). Moreover, the hygroscopy of the protein coat of virus phage under higher RH might lead to the enlargement of particle size, resulting in the decrease of mobility.
The aerosolized E. coli and C. famata removal efficiencies under RH 50% and 70% were higher than those under RH 30%. This might be relevant to that the production of hydrogen peroxide and hydroxyl radical was higher under higher RH. Luts and Salm (1994) demonstrated that superoxide was the dominant and relatively stable species among primary negative air ions Richardson, Eick, Harwood, Rosén, and Dobbs (2003) and Goldstein, Goldstein, and Merzlyak (1992) reported that would be produced when reacted with in wet air, as shown:
| (13) |
The production of increased with the increase of RH. could react either iron-catalytically (wall of reactor) or directly with to generate :
| (14) |
| (15) |
The hydroxyl radical was a highly reactive species and could cause damage to the cell membranes of E. coli and C. famata (Gaunt, Beggs, & Georghiou, 2006).
3.2.3. Enhancement removal efficiency of NAI
Lin and Li (2003a) showed that the penetration of aerosolized E. coli for an electrical filter under RH 35% was lower than those under RH 55% and 85%. Their finding was consistent with our results that the aerosolized E. coli removal efficiency under RH 30% was higher than those under RH 50% and 70%, as presented in Fig. 8 (a). Fan et al. (2002) demonstrated that E. coli incubated on the potato dextrose agar or nutrient agar was more resistant to the bactericidal effect of NAI under high RH (92–96%). Tanimura, Nakatsugawa, Ota, and Hirotsuji (1997) manifested that the growth of E. coli was completely inhibited when the cells were exposed to , and was not inhibited when exposed to . In our study, the aerosolized E. coli was partially inhibited under the negative air ion concentration of , which lay between the two concentrations ( and ) used in Tanimura's study. Therefore, our results agreed with the results of Tanimura et al. (1997).
The effects of RH on the of C. famata and virus phage were positive, but the latter was not statistically significant . The positive effect of RH on the of C. famata could result from that higher RH brought out higher production of and from the reaction of with , as mentioned in Section 3.2.2. Lin and Li (2003a) showed a similar result that the penetration of aerosolized C. famata for an electrical filter under RH 35% was higher than those under RH 55% and 85%.
3.2.4. Enhancement removal efficiency of PCO
According to the experimental results, we found that the effectiveness of 365 nm UV light (without the photocatalyst filter) on the removal of the test microorganisms was insignificant, which was consistent with Jacoby, Maness, Wolfrum, Blake, and Fennell (1998).
As shown in Fig. 8(b), the of C. famata and virus phage under RH 50% and 70% were higher than those under RH 30% ( for C. famata; for virus phage). This might be due to the positive effect of RH on the performance of PCO reaction (Luo and Ollis, 1996, Yu and Lee, 2007; Yu et al., 2006). When the absorbed a photon with energy higher than the band gap of , an electron–hole pair would be formed. The electron and hole would react with and to generate reactive species, such as and , which could inactivate the microorganisms on the surface of (Cho et al., 2005, Sunada et al., 1998). The production of these reactive species increased on increasing the RH. Consequently, the under RH 50% and 70% were higher than those under RH 30%. Theoretically, the positive effect of RH also worked on the removal of E. coli. However, owing to the lower filtration efficiency, E. coli cells had relatively less chance to contact with photocatalyst. Therefore, the positive effect of RH on the removal of E. coli was not obviously observed.
The higher of virus phage in comparison with those of E. coli and C. famata might result from the smaller particle size and simpler structure of virus phage Smaller particle size made virus phage contact with the photocatalyst more efficiently than E. coli and C. famata, and simpler structure made virus phage less resistant to the reactive species produced by the PCO reaction. E. coli and C. famata possess other self-protection mechanisms against the reactive species, including the synthesis of catalase and superoxide dismutase (Grinshpun et al., 2007). Vohra et al. (2006) also found that the bacteriophage (MS2 phage) destruction rate of photocatalysis was the highest among the test microbes.
Our experimental results showed that the PCO was more efficient in the removal of C. famata than E. coli, which were opposite to the results of Lin and Li (2003a). This might be due to that C. famata cells could contact and react with the photocatalyst on the filter fiber better than E. coli cells, resulting from the fact that the C. famata filtration efficiency was higher than E. coli filtration efficiency. Consequently, the of C. famata was higher than that of E. coli.
3.2.5. Enhancement removal efficiency of NAI/PCO
The order of of the aerosolized test microorganisms was as follows: virus phage , as shown in Fig. 8(c). The virus phage filtration (PF) efficiency was relatively high and the particle size of virus phage was relatively small (about ). Higher filtration efficiency and smaller particle size made virus phage contact with the photocatalyst (about in diameter) more effectively. As a result, the PCO contributions to the of virus phage were comparable to the NAI contributions, while the NAI contributions to the of E. coli and C. famata were higher than the PCO contributions. Additionally, the effect of RH on the was the combination of the effect of RH on and .
3.3. Variations of removal efficiency of the combination of NAI and PCO with time
Fig. 9 depicts the variations of test microorganisms removal efficiencies of the Method NUPF with time. The initial aerosolized E. coli, C. famata, and vir PF efficiencies were , , and , respectively. After the negative air ion generator and UV lamps were turned on, the aerosolized E. coli, C. famata, and vir phage removal efficiencies increased to , , and , respectively. The aerosolized E. coli, C. famata, and vir phage removal efficiencies decreased to , , and , respectively, after operating for 4 h. It was difficult to prolong the operating time since the viability of the test microorganisms in the nebulizer decreased dramatically. According to our results it seemed that the durability of the Method NUPF for vir phage was the highest, and that for C. famata was the lowest. The negative air ion generator and UV lamps were turned off after 4 h operating, and the removal efficiencies decreased dramatically. The dramatic decrease in the removal efficiencies might mainly result from a great quantity of re-suspension of the test microorganisms deposited on the filter fiber and the wall of the reactor after the NAI (electrostatic) and PCO effects were eliminated.
4. Conclusions
The nebulization factors of C. famata and vir phage increased with RH, which resulted from that C. famata and vir phage had higher survival rates under higher RH. The increase of RH had a negative effect on the C. famata filtration efficiency of photocatalytic filter (without UV irradiation), due to the reentrainment and higher survival rate of C. famata under high RH. For the aerosolized E. coli and C. famata, the increase of RH had a positive effect on their removal efficiencies of NAI and PCO, which was relevant to the enhancement effect of humidity on the generation of reactive species ( and ). The increase of RH had a positive effect on the virus phage removal efficiency of photocatalytic filter (filtration), PCO, and the combination of NAI and PCO. The combination of NAI and PCO could enhance the aerosolized microorganisms filtration efficiency of photocatalytic filter by around 0.10–0.35 , and the performance of this removal method for vir phage was more durable than those for E. coli and C. famata. Owing to the smaller particle size (higher mobility), simpler structure, and the lack of self-protection mechanisms, such as synthesis of the catalase and superoxide dismutase, the virus phage removal efficiencies of NAI, PCO, and their combination were the highest among the test microorganisms.
Acknowledgment
The authors would like to thank the National Science Council of ROC for supporting this work. We also acknowledge the Instrumentation Center of National Taiwan University for the FE-SEM measurements and Ms. Jiayu Chen for English editing.
Contributor Information
Kuo-Pin Yu, Email: f89541105@ntu.edu.tw.
Grace Whei-May Lee, Email: gracelee@ntu.edu.tw.
References
- Agranovski I.E., Safatov A.S., Pyankov O.V., Sergeev A.N., Agafonov A.P., Ignatiev G.M. Monitoring of viable airborne SARS virus in ambient air. Atmospheric Environment. 2004;38:3879–3884. doi: 10.1016/j.atmosenv.2004.03.044. [DOI] [PMC free article] [PubMed] [Google Scholar]
- Cappuccuno J.G., Sherman N. (4th ed.) The Benjamin/Cummings Publishing Company; Menlo Park, CA, USA: 1996. Microbiology—a laboratory manual. [Google Scholar]
- Chen H., Joerger R., Hoover D., Kingsley D. Pressure inactivation kinetics of bacteriophage lambda Ci 857. Journal of Food Protection. 2004;67:505–511. doi: 10.4315/0362-028x-67.3.505. [DOI] [PubMed] [Google Scholar]
- Cho M., Chung H., Choi W., Yoon J. Different inactivation behaviors of MS-2 phage and Escherichia coli in photocatalytic disinfection. Applied and Environmental Microbiology. 2005;71:270–275. doi: 10.1128/AEM.71.1.270-275.2005. [DOI] [PMC free article] [PubMed] [Google Scholar]
- Christensen P.A., Curtis T.P., Egerton T.A., Kosa S.A.M., Tinlin J.R. Photoelectrocatalytic and photocatalytic disinfection of E. coli suspensions by titanium dioxide. Applied Catalysis B: Environmental. 2003;41:371–386. [Google Scholar]
- Douwes J., Thorne P., Pearce N., Heederik D. Bioaerosol health effects and exposure assessment: Progress and prospects. Annals of Occupational Hygiene. 2003;47:187–200. doi: 10.1093/annhyg/meg032. [DOI] [PubMed] [Google Scholar]
- Fan L., Song J., Hildebrand P.D., Forney C.F. Interaction of ozone and negative air ions to control micro-organisms. Journal of Applied Microbiology. 2002;93:144–148. doi: 10.1046/j.1365-2672.2002.01683.x. [DOI] [PubMed] [Google Scholar]
- Fujioka N., Tsunoda Y., Sugimura A., Arai K. Influence of humidity on variation of ion mobility with life time in atmospheric air. IEEE Transactions on Power Systems. 1983;102(4):911–917. [Google Scholar]
- Gaunt L.F., Beggs C.B., Georghiou G.E. Bactericidal action of the reactive species produced by gas-discharge nonthermal plasma at atmospheric pressure: A review. IEEE Transactions on Plasma Science. 2006;34:1257–1269. [Google Scholar]
- Goldstein N.I., Goldstein R.N., Merzlyak M.N. Negative air ions as a source of superoxide. International Journal of Biometeorology. 1992;36:118–122. [Google Scholar]
- Grabarczyk Z. Effectiveness of indoor air cleaning with corona ionizers. Journal of Electrostatics. 2001;51–52:278–283. [Google Scholar]
- Grdadolnik J., Maréchal Y. Bovine serum albumin observed by infrared spectrometry. II. Hydration mechanisms and interaction configurations of embedded molecules. Biopolymers (Biospectroscopy) 2001;62:54–67. doi: 10.1002/1097-0282(2001)62:1<54::AID-BIP70>3.0.CO;2-4. [DOI] [PubMed] [Google Scholar]
- Grinshpun S.A., Adhikari A., Honda T., Kim K.Y., Toivola M., Ramchander Rao K.S. Control of aerosol contaminants in indoor air: Combining the particle concentration reduction with microbial inactivation. Environmental Science and Technology. 2007;41:606–612. doi: 10.1021/es061373o. [DOI] [PubMed] [Google Scholar]
- Grinshpun S.A., Mainelis G., Trunov M., Adhikari A., Reponen T., Willeke K. Evaluation of ionic air purifiers for reducing aerosol exposure in confined indoor spaces. Indoor Air. 2005;15:235–245. doi: 10.1111/j.1600-0668.2005.00364.x. [DOI] [PubMed] [Google Scholar]
- Gustavsson J. How can air filters contribute to better IAQ? Filtration and Separation. 1999;36:20–25. [Google Scholar]
- Hinds W.C. (2nd ed.) Wiley; New York: 1999. Aerosol technology properties, behavior, and measurement of airborn particles. [Google Scholar]
- Hogan C.J., Jr., Kettleson E.M., Lee M.-H., Ramaswami B., Angenent L.T., Biswas P. Sampling methodologies and dosage assessment techniques for submicrometre and ultrafine virus aerosol particles. Journal of Applied Microbiology. 2005;99:1422–1434. doi: 10.1111/j.1365-2672.2005.02720.x. [DOI] [PubMed] [Google Scholar]
- Jacoby W.A., Maness P.C., Wolfrum E.J., Blake D.M., Fennell J.A. Mineralization of bacterial cell mass on a photocatalytic surface in air. Environmental Science & Technology. 1998;32:2650–2653. [Google Scholar]
- Jensen P.A., Todd W.F., Davis G.N., Scarpino P.V. Evaluation of eight bioaerosol samplers challenged with aerosols of free bacteria. American Industrial Hygiene Association Journal. 1992;53:660–667. doi: 10.1080/15298669291360319. [DOI] [PubMed] [Google Scholar]
- Keller V., Keller N., Ledoux M.J., Lett M.-C. Biological agent inactivation in a flowing air stream by photocatalysis. Chemical Communications. 2005;23:2918–2920. doi: 10.1039/b503638k. [DOI] [PubMed] [Google Scholar]
- Lee B.U., Yermakov M., Grinshpun S.A. Unipolar ion emission enhances respiratory protection against fine and ultrafine particles. Journal of Aerosol Science. 2004;35:1359–1368. doi: 10.1016/j.jaerosci.2004.05.006. [DOI] [PMC free article] [PubMed] [Google Scholar]
- Lee B.U., Yermakov M., Grinshpun S.A. Removal of fine and ultrafine particles from indoor air environments by the unipolar ion emission. Atmospheric Environment. 2004;38:4815–4823. doi: 10.1016/j.atmosenv.2004.06.010. [DOI] [PMC free article] [PubMed] [Google Scholar]
- Lee S., Nishida M., Otaki M., Ohgaki S. Photocatalytic inactivation of phage by immobilized titanium dioxide mediated photocatalyst. Water Science and Technology. 1997;35:101–106. [Google Scholar]
- Lin C.-Y., Li C.-S. Effectiveness of titanium dioxide photocatalyst filters for controlling bioaerosols. Aerosol Science and Technology. 2003;37:162–170. [Google Scholar]
- Lin C.-Y., Li C.-S. Inactivation of microorganisms on the photocatalytic surfaces in air. Aerosol Science and Technology. 2003;37:939–946. [Google Scholar]
- Luo Y., Ollis D.F. Heterogeneous photocatalytic oxidation of trichloroethylene and toluene mixtures in air: Kinetic promotion and inhibition, time-dependent catalyst activity. Journal of Catalysis. 1996;163:1–11. [Google Scholar]
- Luts A., Salm J. Chemical composition of small atmospheric ions near the ground. Journal of Geophysical Research. 1994;99:10781–10785. [Google Scholar]
- Maness P.-C., Smolinski S., Blake D.M., Huang Z., Wolfrun E.J., Jacoby W.A. Bactericidal activity of photocatalytic reaction: Toward an understanding of it killing mechanism. Applied and Environmental Microbiology. 1999;65:4094–4098. doi: 10.1128/aem.65.9.4094-4098.1999. [DOI] [PMC free article] [PubMed] [Google Scholar]
- Mayya Y.S., Sapra B.K., Khan A., Sunny F. Aerosol removal by unipolar ionization in indoor environments. Journal of Aerosol Science. 2004;35:923–941. [Google Scholar]
- Mitchell B.W., King J.K. Effect of negative air ionization on airborne transmission of Newcastle disease virus. Avian Diseases. 1994;38:725–732. [PubMed] [Google Scholar]
- Noyce J.O., Hughes J.F. Bactericidal effect of negative and positive ions generated in nitrogen on Escherichia coli. Journal of Electrostatics. 2002;54:179–187. [Google Scholar]
- Pastuszka J.S., Paw U.K.T., Lis D.O., Wlazlo A., Ulfig K. Bacterial and fungal aerosol in indoor environment in Upper Silesia, Poland. Atmospheric Environment. 2000;34:3833–3842. [Google Scholar]
- Qian Y., Willeke K., Ulevicius V., Grinshpun S.A. Particle reentrainment from fibrous filters. Aerosol Science and Technology. 1997;27:394–404. [Google Scholar]
- Richardson G., Eick S.A., Harwood D.J., Rosén K.G., Dobbs F. Negative air ionisation and the production of hydrogen peroxide. Atmospheric Environment. 2003;37:3701–3706. [Google Scholar]
- Steel R.G.D., Torrie J.H., Dickey D.A. (3rd ed.) McGraw-Hill; New York: 1997. Principles and procedures of statistics: A biometrical approach. (Chapter 7) [Google Scholar]
- Sunada K., Kikuchi Y., Hashimoto K., Fujishima A. Bactericidal and detoxification effects of thin film photocatalysts. Environmental Science & Technology. 1998;32:726–728. [Google Scholar]
- Tanimura Y., Nakatsugawa N., Ota K., Hirotsuji J. Inhibition of microbial growth using negative air ions. Journal of Antibacterial and Antifungal Agents. 1997;25:625–631. [Google Scholar]
- Tseng C.-C., Li C.-S. Collection efficiencies of aerosol samplers for virus-containing aerosols. Journal of Aerosol Science. 2005;36:593–607. doi: 10.1016/j.jaerosci.2004.12.004. [DOI] [PMC free article] [PubMed] [Google Scholar]
- Vohra A., Goswami D.Y., Deshpande D.A., Block S.S. Enhanced photocatalytic inactivation of bacterial spores on surfaces in air. Journal of Industrial Microbiology & Biotechnology. 2005;32:364–370. doi: 10.1007/s10295-005-0006-y. [DOI] [PMC free article] [PubMed] [Google Scholar]
- Vohra A., Goswami D.Y., Deshpande D.A., Block S.S. Enhanced photocatalytic disinfection of indoor air. Applied Catalysis B: Environmental. 2006;64:57–65. [Google Scholar]
- Wu C.C., Lee G.W.-M., Cheng P., Yang S., Yu K.-P. Effect of wall surface materials on deposition of particles with the aid of negative air ions. Journal of Aerosol Science. 2006;37:616–630. [Google Scholar]
- Wu C.C., Lee G.W.-M., Yang S., Yu K.-P., Lou C.L. Influence of air humidity and the distance from the source on negative air ion concentration in indoor air. Science of the Total Environment. 2006;370:245–253. doi: 10.1016/j.scitotenv.2006.07.020. [DOI] [PubMed] [Google Scholar]
- Yu K.-P., Lee G.W.-M. Decomposition of gas-phase toluene by the combination of ozone and photocatalytic oxidation process (, , and ) Applied Catalysis B: Environmental. 2007;75:29–38. [Google Scholar]
- Yu K.-P., Lee G.W.-M., Huang W.-M., Wu C., Yang S. The correlation between photocatalytic oxidation performance and chemical/physical properties of indoor volatile organic compounds. Atmospheric Environment. 2006;40:375–385. [Google Scholar]
- Yu K.-P., Lee G.W.-M., Huang W.-M., Wu C., Yang S., Lou C.-L. Effectiveness of photocatalytic filter for removing VOCs in heating ventilating and air-conditioning (HVAC) systems. Journal of the Air & Waste Management Association. 2006;56:666–674. doi: 10.1080/10473289.2006.10464482. [DOI] [PubMed] [Google Scholar]