

Abstract
The paper presents a novel, n-gram-based method for analysis of bacterial genome segments known as genomic islands (GIs). Identification of GIs in bacterial genomes is an important task since many of them represent inserts that may contribute to bacterial evolution and pathogenesis. In order to characterize and distinguish GIs from rest of the genome, binary classification of islands based on n-gram frequency distribution have been performed. It consists of testing the agreement of islands n-gram frequency distributions with the complete genome and backbone sequence. In addition, a statistic based on the maximal order Markov model is used to identify significantly overrepresented and underrepresented n-grams in islands. The results may be used as a basis for Zipf-like analysis suggesting that some of the n-grams are overrepresented in a subset of islands and underrepresented in the backbone, or vice versa, thus complementing the binary classification. The method is applied to strain-specific regions in the Escherichia coli O157:H7 EDL933 genome (O-islands), resulting in two groups of O-islands with different n-gram characteristics. It refines a characterization based on other compositional features such as G + C content and codon usage, and may help in identification of GIs, and also in research and development of adequate drugs targeting virulence genes in them.
Abbreviations: HGT, horizontal gene transfer; GI, genomic island; OI, O-island; PAI, pathogenesis island; CU, codon usage
Keywords: n-Grams, Statistical analysis, Zipf-like analysis, Genomic islands, Horizontal gene transfer, Backbone sequence, Escherichia coli O157:H7 EDL933
1. Introduction
Many bacterial genomes have been shown to contain specific genomic regions, known as islands. Islands that were acquired by horizontal gene transfer (HGT) events among bacteria are designated as genomic islands (GIs) and may contribute to their adaptability. Genes encoded in GIs offer various functions, e.g., additional metabolic activities, the capability of symbiosis with other organisms, antibiotic resistance and secretion, etc. [1]. The group of GIs that contain a variety of virulence factors, providing for specific host recognition, penetration and colonization of the host organism, and the ability to overcome host defense systems, are known collectively as pathogenicity islands (PAIs). GIs are identified and characterized by different compositional features, such as biased G + C content, codon usage (CU), dinucleotide signature contrasts, amino acid contrasts [2], and different functional features such as the presence of virulence genes and mobility (e.g., integrases, transposases) genes, or structural features such as the presence of proximal tRNA and/or rRNA gene(s) and repeats at their boundaries, presence of insertion sequence elements, origin of plasmid replication, etc. [3], [4].
In this paper we apply a linguistic method – exhaustive n-gram analysis – to already annotated islands in an attempt to characterize GIs more precisely than proved possible using earlier techniques, and to understand their structure better. We illustrate the method on the Escherichia coli O157:H7 EDL933 genome, a member of genus Escherichia of Enterobacteriaceae phylum and a well known and important experimental, medical and biotechnological organism [3], [5].
The paper is organized in the following way. Section 2 surveys different methods and algorithms for identification and prediction of GIs, including the n-gram technique and its applicability to characterization of different types of texts. It also outlines the authors’ prior work in the field. Section 3 describes the three steps of the GI characterization procedure. We first perform n-gram statistical analysis of islands, for different n, in order to classify them according to (dis)agreement with the complete genome. Next, we apply other compositional features (G + C content, CU) to islands and calculate statistical measures—recall, precision, sensitivity and specificity for the results of n-gram classification so as to examine how the n-gram feature contributes to characterizing GIs. Then we identify significantly overrepresented and underrepresented n-grams based on the maximal order Markov model, which may be used as a basis for Zipf-like analysis and for classification of islands based on such n-grams [6]. Section 4 presents computational results obtained for the E. coli EDL 933 genome. In Section 5 we offer our conclusions and outline some future plans.
2. Background
2.1. n-Grams
An n-gram, as introduced by Shannon in 1948 [7], is a subsequence of length n of a sequence over the given alphabet. The sequence may be a message in a natural or artificial language, a discrete approximation of a continuous signal, e.g., speech, or any sequence of symbols generated by a stochastic process. Any such “text” can be approximated by the set of n-gram statistical data (e.g. frequency distribution and the respective mean and standard deviation), and two such texts may be compared based on the distance of such approximations. n-Grams of length 2, 3 and 4 are usually called bigrams, trigrams and tetragrams, respectively, and for higher values of n—simply n-grams.
Formally, as defined in Vinga and Almeida [8], a sequence X of length k is a linear succession of k symbols from a finite alphabet, A, of cardinality |A| = r. A segment of n consecutive symbols from the sequence X (n ≤ k) is an n-gram (n-tuple, n-word, n-plet, n-mer) of the sequence X. There are L = r n different n-grams over the alphabet A, . There are k − n + 1 overlapping n-grams in the sequence X. Some authors use n-grams in a broader sense not assuming contingency of symbols but a distance of a given length between them (spacer).
If c i denotes the number of occurrences of the n-gram (i = 1, 2, …, L) in the sequence X, and f i denotes relative frequency of the n-gram in the sequence X (f i = c i/(k − n + 1)), then a vector of n-gram counts, , as well as a vector of n-gram frequencies, may be associated with the sequence X. For example, for DNA sequences, A = {A, C, G, T}, r = 4; for n = 2, number of all possible bigrams is L = r n = 16 and the set of all possible bigrams will be {AA, AC, AG, AT, CA, CC, CG, CT, GA, GC, GG, GT, TA, TC, TG, TT}. For the sequence X = ATATAC, where k = 6, there are k − n + 1 = 5 bigrams, determined by sliding a two letter window: AT, TA, AT, TA, AC, so the vector of n-gram counts will be (0, 1, 0, 2, 0, 0, 0, 0, 0, 0, 0, 0, 2, 0, 0, 0), and the vector of n-gram frequencies will be (0, 0.2, 0, 0.4, 0, 0, 0, 0, 0, 0, 0, 0, 0.4, 0, 0, 0).
The dissimilarity of two sequences, X and Y, may be defined by a distance function computed in the vector spaces of either n-gram counts or n-gram frequencies.
In general, n-gram analysis proves effective, regardless of the type and origin of the text analyzed. n-Grams were first used in the domain of natural language text analysis, for different tasks such as text compression [9], [10], spelling error detection and correction [11], [12], language identification [13], automatic text categorization [14], authorship attribution [15], etc. For example, Damashek [16] reports the automatic classification of a whole library of multilingual documents based on topical similarity which is determined by using n-grams and Euclidian distance in the vector space of n-gram frequencies.
n-Gram-based methods have also been applied to protein, proteome and genome sequences, for different purposes—to measure sequence similarity and reconstruct phylogenetic trees without sequence alignment, for protein classification, genome characterization, etc. As early as in 1967, Krzywicki and Slonimski compared the expected with the observed frequencies of amino acid bigrams with distance and showed that for certain distances, statistically highly significant deviations are present in proteins [17]. Radomski and Slonimski applied bigram analysis to a set of ribosomal protein sequences some thirty years later [18] to develop the notion of the genomic “style” of proteins, and the concept of n-grams with a spacer was used by Rosato et al. [19] to analyze the thermal dependencies of different proteomes, with some observed anomalies in n-gram distribution at certain distances (spacer lengths).
Deviation of observed from expected n-gram frequencies further aided the investigation of overrepresented and underrepresented n-grams, both in nucleotide and in protein composition. Phillips et al. [20], [21], Colosimo et al. [22], Schbath et al. [23], Gelfand and Koonin [24], Karlin et al. [25], Karlin and Burge [26], Rocha et al. [27], Pevzner et al. [28], Karlin et al. [29], Burge et al. [30] and Schbath [31], investigated identification of over- and underrepresented oligonucleotides and different methods for calculating the expected number of oligonucleotides and the comparison of the expected against the observed number of oligonucleotides. A comparison of different statistical measures of bias of oligonucleotide sequences in the DNA sequences of bacterial genomes is given by Elhai [32]. Noncontiguous sequences were considered since they exhibited significant bias, and the corresponding methods proved more efficient than Markov analysis at the highest order. Reinert et al. [33] reviewed statistical and probabilistic properties of words in sequences, with emphasis on the deductions of exact distributions and the evaluation of their asymptotic approximations.
n-Grams were also used for alignment-free sequence comparison, in order to reconstruct phylogeny trees or to classify proteins or nucleotide sequences. The earliest work systematizing the use of n-gram counts for sequence comparison [34], [35], [36] used the difference between two DNA sequences by the squared Euclidean distance between their transition matrices. Statistical distribution of the number of n-gram matches between two random sequences was analyzed by Karlin [37] and Lippert et al. [38]. Three asymptotic distributions were identified including compound Poisson, normal and uniform distribution. Radomski and Slonimski [39] recently proposed a method of representing and analyzing complete genome sequences, based upon the frequencies of amino acid bigrams at distance. They also gave a thorough review of the work done on alignment-free sequence comparison.
n-Gram composition has been applied to phylogenetic analysis of genes and species by Stuart et al. [40], Edgar [41], Qi et al. [42], and for classification of both protein and nucleotide sequences. Protein classification based on n-grams was investigated by Solovyev and Makarova [43] and Cheng et al. [44]. Daeyaert et al. [45] studied the characteristics of the amino acid composition of n-grams, and investigated two statistics (termed commonality and specificity) derived from n-gram counts, applicable to protein classification. Ganapathiraju et al. [46], [47] presented a biological language toolkit for statistical n-gram amino acid analysis and comparison of protein sequences. King and Guda [48] presented an n-gram-based Bayesian classifier that predicts the localization of a protein sequence. The classification accuracy of n-gram composition metrics was reviewed by Vinga and Almeida [8], [49], together with a new definition of distance between protein sequences. Volkovich et al. [50] applied n-grams to the classification of DNA sequences considered as text over the four-letter alphabet {A, C, G, T}. Kirzhner et al. [51] used a predefined set of n-grams over the same alphabet, the so-called “compositional spectrum”, for characterizing DNA sequences. Tomović et al. [52] introduced an n-gram-based method for classification and clustering of genome sequences.
Different n-gram-based methods for identification of compositionally distinct regions, prophages, functional sites were proposed by Rajan et al. [53], Srividhya et al. [54] and Tobi and Bahar [55].
The authors’ own experience with n-gram technique is promising. In Pavlović-Lažetić et al. [56] we applied n-gram distribution analysis to classification of SARS Coronavirus isolates and argued that different classes were characterized by different overrepresented n-grams (for n up to 8). In Vitas et al. [57] we reported computational results obtained for n-gram analysis of word sequences in natural language texts from different sources. In Mitić et al. [58] we applied n-gram analysis to predicting GIs in bacterial genomes using an algorithm based on n-gram bias between a window (sliding over the genome) and the complete genome.
2.2. Genomic islands
Although the most reliable methods for predicting GIs and their origin are based on gene function and relations within a gene family, compositional methods can support them greatly. Since both approaches may generate false positives and false negatives due to different factors [2], combining the results of multiple techniques may be beneficial in determining whether a gene or a group of genes has been acquired by HGT.
The functional, compositional, or combined approaches, resulted in a number of algorithms for GI/PAIs identification and prediction, and in several databases of predicted islands in bacterial and acrchaeal genomes, such as—IslandPath [59], Islander [60], Score-based Identification of Genomic Islands (SIGI) [61] and Pathogenicity Island DataBase (PAIDB) [62], [63]. IslandPath [59] incorporates both DNA sequence signal features (G + C frequency, dinucleotide bias) and annotation features (the presence of tRNA or rRNA, transposase or integrase genes) to aid the identification of GIs. Islander [60] coordinates several pre-existing computer programs and consists of 11 steps including tRNA (tmRNA) and integrase gene identification and then their passage through several filters sequentially. In SIGI procedure [61], a scoring scheme on codon frequencies is applied and clusters of genes significantly deviating from species-specific value were predicted as GIs. In PAI DB [62], [63], PAIs (which are a subgroup of GIs) are detected by combining sequence similarities (ORFs, RNA genes and repeat regions) and abnormalities in genomic composition (G + C frequency and CU).
Newly inserted sequences in a bacterial genome may deviate from the backbone sequence in G + C content as well as in nucleotide sequences (e.g., as a consequence of CU). It should thus be expected that n-gram analysis may contribute to genomic sequence characterization and classification since it encompasses both criteria. We are currently investigating application of n-gram analysis to bacterial genomes in order to characterize their genome structure and to relate it to genome organization. The results we presented in Mitić et al. [58] suggest that n-gram analysis does contribute to GI prediction.
3. Materials and methods
The complete genome of the E. coli O157:H7 EDL933 (GenBank database accession number NC_002655), is considered since it has segments annotated as “islands”. Its genome consists of a single circular DNA of 5,528,445 bp in length, 5453 genes of total length 4,885,090 bp and inter-gene sequences of length 643,355 bp in total. There is a 4001 bp long sequence of “N”s (unspecified nucleotides) in the genome (positions 1,725,749–1,729,749) and 6,641 incompletely specified nucleotides. There are 177 islands, designated as O-islands (OIs) with the total sum of length 1,278,307 bp. The backbone has a length of 4,250,138 bp. There are 4832 incompletely specified nucleotides in all the OIs. Approximately 26% of the E. coli EDL933 genes (1387/5416) lie completely within OIs, consisting mainly of phage or phage related sequences, and genes that may contribute to pathogenesis (i.e., PAI-like sequences), while others may confer strain-specific abilities to survive in different niches, or represent neutral variation between strains [5], [64]. Nine of the OIs (larger than 0.15 kilo base (kb)) encode for at least one large PAI (OI #148), and putative virulence factors having no obvious role in virulence [5], [64]. The two longest OIs, #43 and #48, are almost identical in length and nucleotide content. The OI #28, although 25,164 bp long, codes for four proteins, one of them being 5,189 amino acids in length (i.e., 15,567 bp; it is the longest protein, putative RTX family exoprotein). The 4001 bp long “N⋯N” sequence is contained in the OI #52 [5], [64].
3.1. n-Gram statistical analysis
Statistical analysis was performed for testing the agreement of n-gram frequency distributions between OIs and the complete genome. It was also applied to comparison of random sequences from the backbone of the genome, with the complete genome sequence. The complete E. coli EDL933 genome contains all the different n-grams for n = 3–7, while 0.15% of all the 8-grams are missing. Bigrams were not considered since there are only 16 different forms and not enough data for testing the corresponding hypothesis.
As far as OIs are concerned, we analyzed only those of length ≥10 kb, since 10 kb is considered as a lower limit of significant GI length [65], [66]. There are 26 such OIs. All of them contain all the 64 different trigrams and all the 256 different tetragrams.
Statistical analysis of n-gram frequency distribution was performed using the SPSS package [67] and programs written in C for processing MySQL data. MS Excel charts were used for representing the corresponding histograms.
For testing agreement of n-gram frequency distribution we used the Mann–Whitney U-test for two independent samples [67]. It is a rank-based test of whether two sampled populations are equivalent in location. If the populations are identical in location, the ranks of combined observations should be randomly mixed between the two samples. The number of times a score from group 1 precedes a score from group 2 and the number of times a score from group 2 precedes a score from group 1 are calculated. The Mann–Whitney U statistic is the smaller of these two numbers.
In our investigations, the Mann–Whitney U-test was used to test the hypothesis that an OI sequence had the same n-gram frequency distribution as the complete genome sequence, for different n since the hypothesis, if rejected, might support n-gram characterization of OI sequences. It was also used to test the hypothesis that a random sequence from the backbone of the genome had the same n-gram frequency distribution as the complete genome sequence, since the hypothesis, if not rejected, might further support n-gram characterization of OI sequences. A sequence, either an OI or from the backbone, is n-gram-characterized, if the hypothesis that it has the same n-gram frequency distribution as the complete genome is rejected.
We applied some commonly used measures for estimating the quality of our algorithm with respect to simpler criteria such as high or low G + C content (G + C content deviating significantly from the average genome G + C frequency) [2]. As a measure of significant deviation we used two standard deviations from the average genome G + C frequency over the subsequences of a given length.
First, we applied recall and precision as the most frequent and basic measures for information retrieval effectiveness [68]. Recall is the proportion of relevant items that are retrieved, and precision is the proportion of retrieved items that are relevant. When applied to n-gram characterization of OIs, relevant items were considered to be GenBank annotated OIs longer than 10 kb that significantly deviated in G + C content, and retrieved items were the n-gram characterized OIs.
Next we applied sensitivity and specificity, the two related statistical measures of how accurately a binary classification test identifies cases that meet the condition under study (sensitivity) and cases that do not meet the condition under study (specificity). In our case, the binary classification test was the OI n-gram characterization, and a condition was OI G + C content deviation. Sensitivity is basically the same as recall and it is the proportion of true positives that are correctly identified by the test (true positives are actually relevant items, and correctly identified are retrieved items). Specificity is the proportion of true negatives that are correctly identified by the test (true negatives are all the non-relevant items).
Sensitivity is calculated by the following formula:
Specificity is calculated by the following formula:
In the case of OI characterization, true positives are the OIs deviating in G + C content that are identified by the n-gram characterization test, false positives are the OIs non-deviating in G + C content that are identified by the n-gram characterization test, true negatives are the OIs non-deviating in G + C content that are not identified by the n-gram characterization test and false negatives are the OIs deviating in G + C content that are not identified by the n-gram characterization test.
3.2. Codon usage analysis
CU analysis of OIs was performed and used as another criterion for comparison with the complete genome sequence. CU bias was determined by a program written in C using MySQL C-API, according to the method described in Karlin [2]. CU bias of the gene family in a sequence S with respect to the gene family in a sequence T is calculated by the formula:
where p a(S) is the average frequency of an amino acid a in the gene family of S, s(x, y, z) is the average codon frequency for a codon (x, y, z) in the sequence S, normalized so that
A CU bias was considered significant if it was more than one standard deviation higher than the mean value of CU bias for all the OIs considered.
3.3. Overrepresented and underrepresented n-grams
With respect to n-grams, sequences may be characterized not only by their overall frequency distribution, but by overrepresented or underrepresented n-grams. We applied the statistic introduced in [23] to detect over-and-under represented n-grams in OIs sequences, the complete genome and its backbone, based on the maximal order Markov model of the sequences. The method estimates the bias of the observed to the expected frequencies of n-grams and tends to neutralize excess in n-grams which is due to excess in A + T, G + C, or oligonucleotide components solely. The so-called z M statistic is the normalized difference between the observed count and the expected number of a given word (n-gram in our case), calculated by using the maximal order Markov model [23], [31], [32]:
N is the observed number of occurrences of the word , NT is the length of the genome sequence considered, is the expected frequency of the word , based on the maximal order Markov model, and N T E M is the expected number of occurrences of the word , as calculated by the formula
The estimated standard deviation of the difference between N and N T E M, σ, is defined in [29] as
The z M statistic has an approximately normal distribution and is normalized to the standard deviation, so that a z-value higher than +1 indicates that the word (n-gram) is overrepresented, while a z-value lower than −1 indicates that the n-gram is underrepresented.
3.4. Zipf-like analysis
A modification of Zipf-like analysis was applied in order to investigate differences between n-gram appearances in different sequences [46]. The original Zipf power law was designed for word (i.e., motif) occurrences in any kind of text, stating that the most frequent word is expected to be twice as frequent as the following most frequent word, etc. The modification applied concerns the relationship between the most overrepresented n-grams (for specific n, according to the z M statistic) in a specific sequence and their usage in all the other sequences considered. First, n-grams (for specific n) were sorted in descending order of z-bias in a chosen OI (or the complete genome), and then MS Excel charts were used to represent the z-values of the sorted n-grams in the chosen sequence and in all the other sequences (OIs, complete genome, backbone). The procedure was repeated for each OI. It may suggest that some of the n-grams are overrepresented in a subset of OIs and underrepresented in the backbone, or vice versa, thus characterizing the subset of OIs. We identified such n-grams for the corresponding subsets of OIs.
The results of Zipf-like analysis might suggest that some of the n-grams were exclusively overrepresented (or underrepresented) in a single sequence, which would give us a criterion for defining the sequence's n-gram nucleotide signature. We calculated such signatures for each OI as a set of n-grams which were overrepresented in that OI only, and underrepresented in the backbone of the genome, and also for n-grams which were underrepresented in that OI only, and overrepresented in the backbone.
4. Results and discussion
4.1. Distribution of n-grams in O-islands
Table AF1 in the additional file (http://www.matf.bg.ac.yu/∼gordana/bioinf/ngrams) represents the identification number, length, number and percentage of missing n-grams (n = 5, 6, 7, 8), for OIs of length >10 kb.
Table 1.
Results of the Mann–Whitney two-sample U-test.
| (a) E. coli EDL933 O-islands | |||||||
|---|---|---|---|---|---|---|---|
| OI# | Position | z | Asymp. Sig. | G + C content | CU bias | Related to | Coding for |
| 7 | 241549..277463 | −1.434 | 0.152 | 51.96% | 0.163 | Rhs element | Put. Macrophage tox.; put. protease Rhs element associated |
| 8 | 300060..310645 | −2.685 | 0.007 | 41.30% | 0.363 | Phage or prophage related (CP-933H) | Phage related proteins |
| 28 | 579589..604753 | −8.804 | 0.000 | 59.15% | 0.306 | Put. RTX family proteins; put. membrane transport proteins | |
| 30 | 664172..675785 | −2.770 | 0.006 | 52.11% | 0.251 | Rhs element | Put. Rhs protein; put. receptor |
| 35 | 843271..857236 | −1.450 | 0.147 | 47.50% | 0.156 | Put. regulator; put. enzyme; put. Transport | |
| 36 | 892772..931359 | −0.945 | 0.345 | 49.32% | 0.185 | Phage or prophage related (CP-933K) | Phage related proteins |
| 43 | 1058620..1146182 | −0.183 | 0.855 | 47.96% | 0.179 | Phage or prophage related (P4-phage) | Phage related proteins; insertion sequence associated proteins; putative phage inhibition; colicin resistance; tellurite resistance |
| 44 | 1250302..1295546 | −1.760 | 0.078 | 51.94% | 0.176 | Phage or prophage related (CP-933M) | Phage related proteins |
| 45 | 1330836..1392498 | −0.096 | 0.923 | 49.37% | 0.192 | Phage or prophage related (BP-933W) | Phage related proteins (shiga-like toxin, tRNA, etc.) |
| 47 | 1420969..1452695 | −0.941 | 0.347 | 46.24% | 0.099 | Transcriptional regulator MarT; hemagglutinin/hemolysin-related protein | |
| 48 | 1454242..1541789 | −0.179 | 0.858 | 47.90% | 0.178 | Phage or prophage related (P4 family) | Insertion sequence associated proteins; put. urease; put. phage inhibition; colicin resistance; tellurite resistance |
| 50 | 1626570..1673884 | −1.354 | 0.176 | 48.40% | 0.205 | Phage or prophage related (CP-933N) | Phage related proteins |
| 51 | 1678561..1694142 | −1.968 | 0.049 | 50.96% | 0.217 | Phage or prophage related (CP-933C) | Phage related proteins; sensor protein PhoQ |
| 52 | 1701990..1756455 | −0.858 | 0.391 | 47.18% | 0.159 | Phage or prophage related (CP-933X) | Phage related proteins |
| 57 | 1849324..1929825 | −0.461 | 0.645 | 51.29% | 0.156 | Phage or prophage related (CP-933O) | Phage related proteins (put. intestinal colonization factor tRNA phage or prophage related) |
| 71 | 2271618..2329601 | −1.280 | 0.200 | 50.85% | 0.183 | Phage or prophage related (CP-933P) | Phage related proteins (put. RNA identical to DicF cryptic prophage encoded); tRNA genes |
| 76 | 2668112..2689231 | −1.120 | 0.263 | 50.08% | 0.157 | Phage or prophage related (CP-933T) | Phage related proteins |
| 84 | 2843565..2857752 | −6.392 | 0.000 | 36.24% | 0.493 | PAI related | Surface polysaccharides and antigens (O-antigen) |
| 93 | 2966157..3015072 | −1.041 | 0.298 | 51.66% | 0.200 | Phage or prophage related (CP-933V) | Phage related proteins (shiga-like toxin) |
| 102 | 3264256..3277062 | −1.207 | 0.227 | 44.74% | 0.291 | Phage or prophage related (P22, APSE-1, pM3) | Phage related proteins; enzymes; transport proteins |
| 108 | 3545770..3567450 | −3.210 | 0.001 | 40.41% | 0.359 | Phage or prophage related (CP-933Y) | Phage related proteins |
| 115 | 3786306..3803253 | −5.830 | 0.000 | 36.90% | 0.457 | PAI related | Type III secretion apparatus Proteins |
| 122 | 3919348..3942802 | −1.085 | 0.280 | 46.30% | 0.226 | PAI related | IS related proteins (put. pathogenicity island Integrase); PagC-like membrane protein |
| 138 | 4399382..4414774 | −3.783 | 0.000 | 54.68% | 0.156 | PAI related | enzymes |
| 148 | 4649862..4693279 | −2.929 | 0.003 | 40.91% | 0.345 | Phage or prophage related (CP-933L) PAI (LEE pathogenicity Island) | Phage related proteins; LEE PAI integrase; transport and secretory proteins; put. intimin receptor protein |
| 172 |
5377088..5421521 |
−0.262 |
0.793 |
47.35% |
0.158 |
IS sequences related proteins; myosin heavy chain (Cyprinus carpio similar) |
|
| (b) E. coli EDL933 backbone | |||||
|---|---|---|---|---|---|
| No. | Start | End | z | Asymp. Sig. | G + C content |
| 1 | 98355 | 135354 | −1.596 | 0.111 | 52.56% |
| 2 | 515030 | 552029 | −0.501 | 0.617 | 51.06% |
| 3 | 617536 | 654535 | −1.071 | 0.284 | 51.61% |
| 4 | 726296 | 763295 | −0.212 | 0.832 | 49.96% |
| 5 | 1179742 | 1216741 | −1.111 | 0.267 | 51.66% |
| 6 | 1803024 | 1840023 | −0.223 | 0.823 | 49.86% |
| 7 | 2122228 | 2159227 | −1.285 | 0.199 | 50.57% |
| 8 | 2409024 | 2446023 | −0.394 | 0.694 | 49.63% |
| 9 | 2572264 | 2609263 | −0.152 | 0.879 | 49.85% |
| 10 | 2733281 | 2770280 | −1.409 | 0.159 | 51.11% |
| 11 | 3062032 | 3099031 | −1.100 | 0.271 | 50.84% |
| 12 | 3331041 | 3368040 | −2.476 | 0.013 | 54.34% |
| 13 | 3386487 | 3423486 | −1.279 | 0.201 | 51.78% |
| 14 | 3480848 | 3517847 | −0.690 | 0.490 | 51.82% |
| 15 | 3603220 | 3640219 | −1.890 | 0.059 | 53.53% |
| 16 | 3719706 | 3756705 | −1.186 | 0.236 | 52.13% |
| 17 | 4026289 | 4063288 | −1.033 | 0.301 | 51.98% |
| 18 | 4117458 | 4154457 | −0.701 | 0.483 | 51.09% |
| 19 | 4277673 | 4314672 | −1.181 | 0.237 | 52.50% |
| 20 | 4473661 | 4510660 | −1.299 | 0.194 | 51.63% |
| 21 | 4799928 | 4836927 | −0.715 | 0.474 | 52.08% |
| 22 | 4882638 | 4919637 | −0.828 | 0.407 | 51.26% |
| 23 | 5133093 | 5170092 | −0.806 | 0.420 | 49.37% |
| 24 | 5215694 | 5252693 | −0.551 | 0.582 | 49.11% |
| 25 | 5323116 | 5360115 | −0.695 | 0.487 | 51.65% |
The Mann–Whitney two-sample U-test of equality of 5-gram frequency distributions is applied to OIs of the E. coli EDL933 of length >10 kb as the first sample, and the complete genome as the second sample (a). Included are OI number (OI#), its position in the genome (Position), z-value and p-value (Asymptotic Significance) of the test, G + C content and CU bias of the sequence, as well as possible origin of a sequence it is related to (Related to) and the element(s) it codes for (Coding for)—according to [5], [64].
The same test is applied to sequences from the backbone, as the first sample, and the complete genome E. coli EDL933, as the second sample (b). Included are the sequence number (No.), its position in the genome (Start, End), z-value and Asymptotic Significance (p-value) of the test, and the G + C content of the sequence.
Asymptotic Significance in bold denotes low p-value (<0.05); G + C content data in bold denote high percentage (>58%), in italic—low percentage (<42%); CU bias data in bold denotes high CU bias (>0.30).
Since 7- and 8-grams are quite rare in OIs, they cannot be used for testing agreement of frequency distribution between OIs and the complete genome. The hypothesis on the equality of 6-gram frequency distribution for two independent samples, using the Mann–Whitney test, is rejected with a significance level of 0.01 for the complete genome (as the first sample) and each of the OIs (as the second sample) except for the longest ones—#43 and #48. Since 6-gram distribution agreement seemingly relied on the length rather than the structure of the OI, 6-grams cannot be considered as reliable data for this kind of analysis.
4.1.1. 5-Grams statistical analysis
The hypothesis on equality of 5-gram frequency distribution for two independent samples using the Mann–Whitney U-test is rejected with a significance level 0.05, for the complete E. coli EDL933 genome as the first sample and OIs #148, #28, #108, #115, #51, #138, #84, #8 and #30 as the second sample. This group of OIs may be designated as the 5-gram Disagreeing Class (5DC). For all the other OIs, the hypothesis cannot be rejected. They form an Agreeing Class (AC). Some of the 5DC OIs have low G + C content (OIs #148, #108, #115, #84 and #8 – 40.91%, 40.41%, 36.90%, 36.24% and 41.30%, respectively), OI #28 has a high G + C content (59.15%) – see Table 1a, so that their disagreement with the complete genome in n-gram frequency distribution may be considered to be a direct consequence of their G + C content. But three of the 5DC OIs—#51, #138, #30 have about average G + C content and their disagreement with the complete genome in 5-gram frequency distribution cannot be attributed to their G + C content.
Furthermore, we randomly selected a 37 kb long subsequence from each of the backbone sequences (lying between two consecutive OIs) longer than 50 kb. We then applied the Mann–Whitney U-test to 5-gram frequency distributions in the complete genome (as the first sample) and each of the selected backbone subsequences (as the second sample)—see Table 1b. The length of 37 kb was selected as the average length of OIs longer than 10 kb. There are 25 backbone sequences longer than 50 kb, and thus 25 subsequences of length 37 kb were selected. Only one of them (positions 3,331,041–3,368,040) disagrees with the complete genome in 5-gram frequency distribution. Thus 5-gram frequency distribution may be considered as an OI characterizing feature. Fig. 1 represents 5-gram histograms for the complete E. coli EDL933 genome sequence, the backbone, OIs from the AC class (a) and OIs from the 5DC class (b). The similarity in histogram shapes among sequences in Fig. 1(a) may be noticed, as well as their dissimilarity with sequences in Fig. 1(b).
Fig. 1.
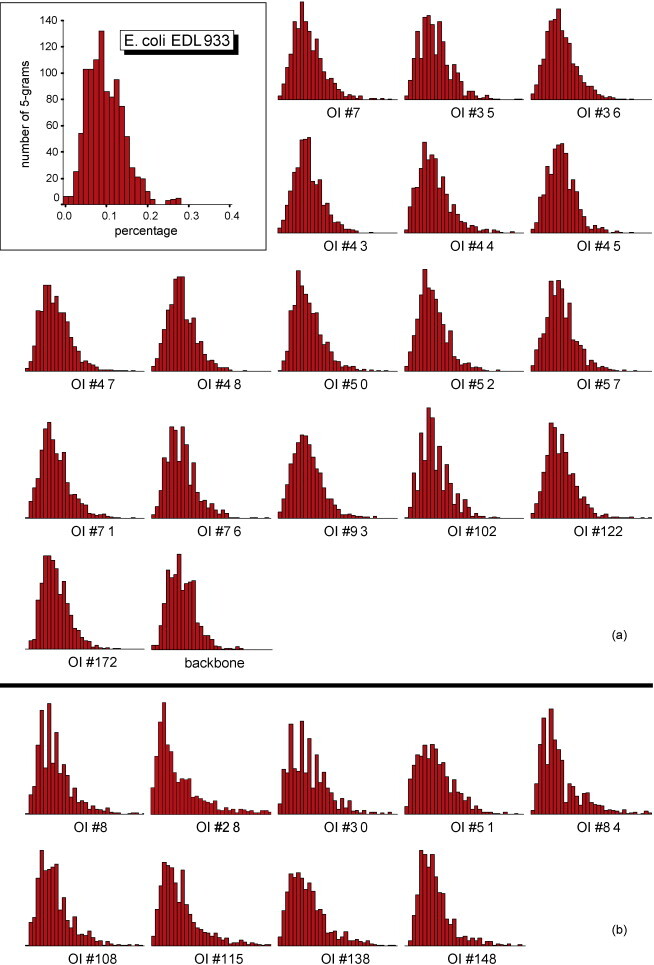
Distribution of 5-gram percentages in E. coli EDL933. Distribution of 5-gram percentages in E. coli EDL933 complete genome, the backbone sequence, OIs from the AC class (a) and OIs from the 5DC class (b). Labeled coordinate axes for the complete genome subfigure are presented only. The histogram's x-axis shows percentage intervals, y-axis shows number of different 5-grams with percent occurrence falling into specific intervals (e.g., in the complete genome there are 18 tetragrams with percentages in the interval 0.00–0.025%). x-Values range from 0 to the percent occurrence of the most frequent 5-gram (in the corresponding sequence, e.g., it is 0.28% for the complete E. coli EDL933 genome and corresponds to the most frequent 5-gram CCAGC). y-Values range from 0 to the number of different 5-grams with percent occurrence belonging to the modal interval (e.g., in the complete genome, there are 132 5-grams with percentages in the interval 0.08125–0.09375%); y-values sum up to 1024 (number of different 5-grams). Axes scales for all the subfigures are the same as the ones presented in the complete genome subfigure. Similarity in shape is noticeable among sequences from the AC class represented in (a), as well as their dissimilarity with sequences in the 5DC class represented in (b).
Tetragrams and trigrams do not contribute to characterization of genomic islands based on frequency distribution, since the sets of OIs disagreeing with the complete genome (OIs #28, #84, #115 and #148) are included in the 5DC class, and all of them have high or low G + C content.
4.1.2. Comparison with G + C content and CU bias
We consider CU bias to be significant if it is greater than 0.3, which is one standard deviation (about 0.1) higher than the mean value of CU bias (about 0.2) for all the OIs > 10 kb in length. Significant G + C content deviation is calculated to be outside the interval (42%, 58%). When comparing the 5-gram frequency distribution feature of E. coli EDL933 OIs with their G + C content and CU bias, a correlation was achieved: most OIs deviating significantly in 5-gram frequency distribution from the complete genome also deviate significantly in G + C content and CU bias (OIs #8, #28, #84, #108, #115 and #148). Exceptions are the three OIs that deviate significantly (p < 0.05) in 5-gram frequency distribution from the complete genome, while having low CU bias and roughly average G + C content (OIs #30, #51 and #138). Table 1a also represents all the OIs with a length >10 kb, with z and p-values (Asymptotic Significance) for the Mann-Whitney agreement test of 5-gram frequency distribution with the complete genome sequence.
With respect to OIs longer than 10 kb (26 in total), the results presented show that our algorithm for characterizing GIs has identified all the 6 OIs with unusual G + C content or significantly high CU bias (recall, i.e. sensitivity is 100%). On the other side, the algorithm identified 3 more OIs (not recognized by G + C content or CU bias), which results in 67% precision (6/9) and 85% specificity (17/20). We interpret this imprecision as an additional power of 33% (15%, respectively) with respect to other methods.
One obvious drawback of the method presented is that only OIs longer than 10 kb are analyzed. It is because 10 kb is considered as the lower limit for the length of a GI that exhibits characteristics of HGT [30], [31]. Although there are only 26 (out of 177) such OIs in E. coli EDL933, the total number of GIs identified in other genomes, e.g., in E. coli CFT073 [4], [64], [69] is, by an order of magnitude, smaller than that in E. coli EDL933 [51], [52], [64] and all of them are longer than 10 kb.
A general characteristic of n-gram methods is that they do not require linguistic (genomic) knowledge; the meaning of the sequence is not analyzed, it is merely the structure which is investigated. It makes the methods simpler but nonetheless useful in differentiating between different kinds of sequences, e.g., in characterizing and thus predicting GIs in bacterial genomes [58].
4.2. Overrepresented and underrepresented n-grams
Table 2a represents the 10 topmost overrepresented and underrepresented tetragrams (according to z M statistic) in the complete E. coli EDL933 genome, its backbone and 9 OIs from the 5DC class. Among these tetragrams there are 9 different palindromes, all of which are underrepresented, with 29 occurrences in total. There are also 14 pairs of sequences and their reverse complements, each pair simultaneously being either overrepresented or underrepresented. Table 2b represents rank, in the complete genome and the nine 5DC OIs of the 10 topmost overrepresented and underrepresented tetragrams from the backbone. Table 2a, Table 2b in the additional file contains the same data for all the OIs of length >10 kb, along with the z-values of the z M statistic. It can be seen that the intersection of all the 10 topmost overrepresented tetragram columns is empty, as is the intersection of all the 10 topmost underrepresented tetragram columns, i.e., no tetragram is among the 10 topmost overrepresented tetragrams in all the OIs. However, there are three tetragrams – CACC, CATC, CGCC, that are overrepresented, and one tetragram – GGCC, that is underrepresented (but not in the 10 topmost), in all the OIs, the backbone and the complete genome. Table AF3 in the additional file represents all the tetragrams in all the OIs of length>10 kb, the backbone and the complete genome, along with z-values of the z M statistic.
Table 2a.
The most overrepresented and the most underrepresented tetragrams in the complete E. coli EDL933 genome, backbone and the 9 O-islands from the 5DC class.

Table 2b.
Rank of tetragrams.
| Tetragram | Backbone | EDL933 | #30 | #8 | #84 | #138 | #51 | #115 | #108 | #28 | #148 |
|---|---|---|---|---|---|---|---|---|---|---|---|
| Rank | |||||||||||
| CGCC | 1 | 1 | 10 | 4 | 3 | 4 | 59 | 72 | 13 | 5 | 15 |
| GGCG | 2 | 2 | 81 | 63 | 37 | 2 | 4 | 140 | 19 | 16 | 10 |
| CCAG | 3 | 6 | 16 | 9 | 62 | 41 | 127 | 68 | 78 | 142 | 61 |
| CTTC | 4 | 5 | 9 | 23 | 172 | 129 | 238 | 4 | 54 | 139 | 33 |
| GAAG | 5 | 3 | 51 | 56 | 69 | 11 | 21 | 133 | 29 | 7 | 44 |
| CTGG | 6 | 4 | 74 | 200 | 85 | 1 | 1 | 77 | 18 | 15 | 40 |
| GATG | 7 | 7 | 8 | 12 | 65 | 10 | 23 | 150 | 60 | 9 | 2 |
| CATC | 8 | 8 | 2 | 8 | 2 | 76 | 18 | 6 | 2 | 22 | 11 |
| TTGC | 9 | 11 | 59 | 102 | 130 | 17 | 2 | 65 | 55 | 58 | 72 |
| GCAA | 10 | 13 | 41 | 5 | 54 | 7 | 6 | 126 | 124 | 8 | 45 |
| GGAC | 247 | 247 | 241 | 65 | 139 | 197 | 180 | 180 | 207 | 236 | 185 |
| TATA | 248 | 248 | 251 | 235 | 131 | 226 | 225 | 256 | 206 | 195 | 254 |
| GATC | 249 | 253 | 249 | 255 | 204 | 235 | 254 | 207 | 253 | 237 | 253 |
| CTAG | 250 | 249 | 111 | 222 | 179 | 240 | 168 | 255 | 248 | 225 | 246 |
| CGCG | 251 | 252 | 245 | 168 | 233 | 252 | 217 | 175 | 211 | 255 | 239 |
| CAAG | 252 | 250 | 193 | 108 | 207 | 225 | 230 | 82 | 236 | 252 | 223 |
| CTTG | 253 | 251 | 218 | 216 | 120 | 237 | 106 | 112 | 200 | 159 | 161 |
| TTGG | 254 | 255 | 252 | 239 | 112 | 254 | 255 | 213 | 254 | 200 | 244 |
| CCAA | 255 | 254 | 253 | 237 | 163 | 255 | 251 | 123 | 228 | 249 | 202 |
| GGCC | 256 | 256 | 248 | 226 | 225 | 256 | 253 | 216 | 255 | 256 | 251 |
(a) The 10 topmost overrepresented and the 10 topmost underrepresented (according to Markov Model of order 2) tetragrams in the complete E. coli EDL933 genome, backbone and the 9 OIs from the 5DC class. Tetragrams in first row of each group are overrepresented, while tetragrams in the second row are underrepresented. Tetragrams that represent palindromes themselves are shaded in orange, while pairs of tetragrams and their reverse complements (in the same OI, backbone or E. coli EDL933 genome) are shaded in red, blue, green or yellow. All palindromes belong to underrepresented group. Also, tetragrams and their reverse complements are either both underrepresented or both overrepresented.
(b) Rank of tetragrams in the complete genome E. coli EDL933 and in 9 OIs from the 5DC class, relative to the 10 topmost overrepresented and underrepresented tetragrams in the backbone. While the most overrepresented tetragrams in the backbone have low rank in some of the 5DC OIs (e.g., CTTC in OI# 84, #138, #51, #28, or CTGG in OI# 8), the most underrepresented tetragrams in the backbone have low rank in all the other sequences, too.
Table 3.
Over–underrepresented tetragrams according to z-value and their relation to restriction enzyme sites.
| No. | Tetragram sequence | OI# | z-Value in OI | z-Value in backbone | Restriction enzymes |
|
|---|---|---|---|---|---|---|
| E. coli | Other bacteria | |||||
| Overrepresented in an OI and underrepresented in the backbone | ||||||
| 1. | CGGC | 8 | 2.250 | −6.776 | Eco52I, Eco56I | FseI, NaeI, NotI, Sse232I, XmaIII, EagI, EclXI |
| 2. | TGGA | 28 | 7.395 | −10.732 | Bpml | |
| 3. | CGTG | 84 | 2.654 | −23.930 | Eco72I | PmaCI |
| 4. | GGCT/AGCC | 108 | 3.820 | −13.573 | TaqII | |
| 5. | GTGT/ACAC | 115 | 1.888 | −10.799 | RLeAI | |
| 6. | GCAC | 148 | 2.760 | −15.092 | ApaLI | |
| 7. | GTAC | 30 | 3.042 | −11.083 | Eco255I | ScaI, Bsp1407I |
| 8. | ATGC | 51 | 4.085 | −6.797 | EcoT22I | SphI, AvaIII |
| 9. | GAGC | 138 | 2.169 | −17.301 | Eco53kI, EcoICRI | SacI, EcI136II |
| Underrepresented in an OI and overrepresented in the backbone | ||||||
| 10. | CTTC/GAAG | 51 | −2.418 | 52.641 | Eco57I | Eam1104I, EarI |
| 11. | GTAA | 30 | −2.351 | 8.637 | PI-SceI | |
| 12. | TTAT | 138 | −2.642 | 13.506 | PsiI | |
| 13. | ACTA | 8 | −2.912 | 14.456 | SpeI | |
| 14. | TCAT | 28 | −4.408 | 10.197 | BspHI | |
| 15. | TATC | 84 | −1.125 | 22.921 | EcoRV, Eco32I | BfuI |
| 16. | ATCC | 84 | −2.985 | 1.821 | Bam HI | |
| 17. | GGCA | 108 | −1.404 | 38.056 | PI-SceI | |
| 18. | AGAG/CTCT | 115 | −1.846 | 22.564 | Eco31I, EcoA4I, EcoO44I | Esp3I |
| 19. | GAGA | 148 | −2.599 | 20.247 | Eam1104I, EarI | |
| Uniquely overrepresented in one OI and underrepresented in the backbone | ||||||
| 20. | ACAC | 28 | 4.204 | −11.712 | TaqII | |
| 21. | CGGC | 8 | 2.250 | −6.776 | Eco52I, Eco56I | FseI, NaeI, NotI, Sse232I, XmaIII, EagI, EclXI |
| 22. | ATCT | 28 | 2.186 | −16.522 | BglII | |
| 23. | CAAA | 30 | 1.795 | −5.137 | (not found in DB) | |
| 24. | GCAC | 148 | 2.760 | −15.092 | ApaLI | |
| 25. | TTAG | 148 | 1.904 | −17.928 | (not found in DB) | |
| 26. | GTTT | 138 | 1.172 | −11.686 | PmeI | |
| Uniquely underrepresented in one OI and overrepresented in backbone | ||||||
| 27. | GTAA | 30 | −2.351 | 8.637 | PI-SceI | |
| 28. | CTTC/GAAG | 51 | −2.418 | 52.641 | Eco57I | Eam1104I, EarI |
| 29. | ACCA | 138 | −1.206 | 2.861 | (not found in DB) | |
| 30. | ACTA | 8 | −2.912 | 14.456 | SpeI | |
| 31. | CCGG/CCGG | 28 | −3.418 | 21.776 | Eco56I, Eco52I, EcoHK31I | EcIRI, SrfI, Sse232I, AgeI, BetI, BspMII, Cfr 10I, EaeI, EaeAI, FseI, HpaII, NaeI, SgrAI, SmaI, EciIXI |
| 32. | GGTA | 84 | −1.137 | 19.760 | KpnI | |
| 33. | GGCA | 108 | −1.404 | 38.056 | PI-SceI | |
| 34. | AGAG/CTCT | 115 | −1.846 | 22.564 | Eco31I, EcoA4I, EcoO44I | Esp3I |
| 35. | GGAG | 148 | −1.627 | 6.808 | BpmI, BseRI | |
First part of this table represents tetragrams which are among the most overrepresented in an OI (high z-value) while being among the most underrepresented in the backbone (low z-value); second part of this table represents tetragrams which are among the most underrepresented in an OI (low z-value) while being among the most overrepresented in the backbone (high z-value); third part of this table represents some of the tetragrams which are uniquely overrepresented in an OI and underreperesented in the backbone, while the fourth part represents some of the tetragrams which are uniquely underrepresented in an OI and overrepresented in the backbone. As expected, the first and the third part of the table have tetragrams in common, as well as the second and the fourth part of the table.
Restriction enzyme recognition sequences for some E. coli strains, as well as for other bacteria, are given when known. Restriction enzyme data are taken from Genscript.com [70].
A tetragram with its reverse complement is given in pair (xxxx/yyyy) when the tetragram (xxxx) corresponds to the “OI#” and “z-value in OI” data, while its complement (yyyy) corresponds to the “Restriction enzymes” data.
4.2.1. Overrepresented and underrepresented tetragrams and restriction sites
Some tetragrams which are among the most over (or under) represented in some OIs, while being under (or over) represented in the backbone, are presented in Table 3 along with z-value in the OI and in the backbone. The first part of Table 3 represents tetragrams which are among the most overrepresented in an OI (high z-value), while being among the most underrepresented in the backbone (low z-value); the second part of Table 3 represents tetragrams which are among the most underrepresented in an OI (low z-value) while being among the most overrepresented in the backbone (high z-value); the third part of Table 3 represents some of the tetragrams which are uniquely overrepresented in an OI and underrepresented in the backbone, while the fourth part represents some of the tetragrams which are uniquely underrepresented in an OI while overrepresented in the backbone. It may be seen that tetragrams that are included in E. coli restriction enzyme recognition site sequences [70] are generally more represented in island sequences, than in the backbone (55% vs. 30%). This is in agreement with the fact that most of the OIs are phage or prophage related (61%), see Table 1. This fact would have been even more apparent if we had used the absolute number of occurrences of these tetragrams instead of normalized (by Markov model).
4.2.2. Comparative Zipf-like analysis
Application of the modified Zipf-like analysis to the most overrepresented and underrepresented tetragrams of different sequences is illustrated in Fig. 2 (1)–(6).
Fig. 2.
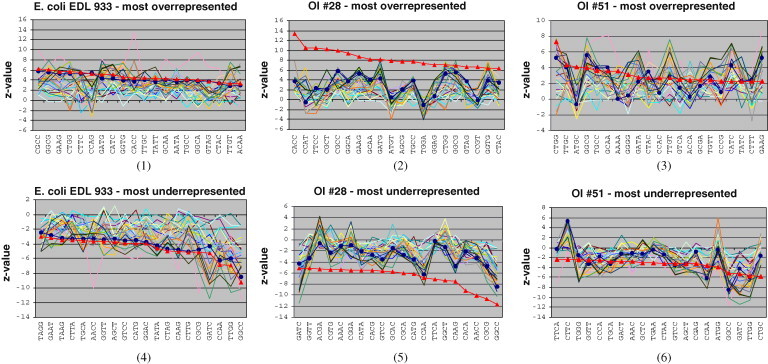
Comparative Zipf analysis. The 20 topmost overrepresented and underrepresented tetragrams in the complete E. coli EDL933 genome – subfigures (1), (4), OI #28 – subfigures (2), (5) and OI #51 – subfigures (3), (6), with the corresponding z-values for the biased (according to the maximal order Markov model) tetragram frequency. The red line marked with triangles (▴) represents z-values of tetragram frequencies in descending order for the chosen sequence (complete genome, OI), while the blue line marked with circles (●) represents z-values of the corresponding tetragram frequencies in the backbone, and all the other lines represent z-values of the corresponding tetragram frequencies in other sequences. (For interpretation of the references to color in this figure legend, the reader is referred to the web version of the article.)
Subfigures (1) and (4) present the data for the complete E. coli EDL933 genome, while others correspond to two OIs from the 5DC class: OI #28, deviating significantly in G + C content from the backbone of the genome – subfigures (2), (5), and OI #51 with G + C content around 50% – subfigures (3), (6). The corresponding figures for all the OIs from the 5DC class are given in Fig. 1AF1 in the additional file. It may be noticed that the most overrepresented and underrepresented tetragrams in the complete genome and its backbone are quite similar (as one would expect). Some of the most represented tetragrams in the complete genome are underrepresented in some of the OIs, e.g. CCAG (Fig. 2(1)), but the most underrepresented tetragrams in the complete genome tend to be underrepresented in most of the OIs, too (Fig. 3 ). As far as 5DC OIs are concerned, it can be noticed that some of the most overrepresented tetragrams in each of them are underrepresented in the backbone, and have z-values above the z-values of the corresponding tetragrams in all other sequences (e.g., CCAT, TGGA in the OI #28, Fig. 2(2), ATGC in the OI #51, Fig. 2(3)). The same holds true for the most underrepresented tetragrams (e.g., CTTC in the OI #51, Fig. 2(6)). Such tetragrams may be used as a basis for defining the OIs tetragram nucleotide signature.
Fig. 3.
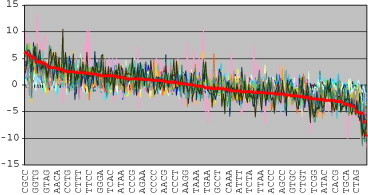
Comparative Zipf analysis. All the tetragrams (x-axis) are sorted according to descending z-value of the zM statistic (y-axis) in the complete genome sequence (thick line), and z-values for the corresponding tetragrams in all the other sequences are presented. Although the most overrepresented tetragrams may deviate highly among the sequences (left part of the figure), the most underrepresented ones tend to coincide (right part of the figure).
Table 4a, Table 4b represent all the tetragrams that are overrepresented/underrepresented, respectively, in just one of the 5DC OIs and, at the same time, underrepresented/overrepresented, respectively, in the backbone, along with the z-value and rank of the tetragram in both sequences. Fig. 4 represents z-values for the most underrepresented tetragram in each of the 5DC OIs, which is overrepresented in the backbone, along the E. coli EDL933 genome.
Table 4a.
O-islands signature (overrepresented tetragrams).
| Tetragam | O-island |
Backbone sequence |
|||
|---|---|---|---|---|---|
| OI# | z-Value | Rank | z-Value | Rank | |
| ATAC | 8 | 1.361 | 34 | −25.463 | 228 |
| CCTA | 8 | 1.079 | 46 | −25.620 | 229 |
| CGGC | 8 | 2.250 | 11 | −6.776 | 152 |
| ACAC | 28 | 4.204 | 40 | −11.712 | 178 |
| ATCT | 28 | 2.186 | 71 | −16.522 | 197 |
| TGGA | 28 | 7.395 | 13 | −10.732 | 169 |
| TTAA | 28 | 3.246 | 52 | −10.080 | 168 |
| AAAC | 30 | 1.228 | 62 | −11.112 | 176 |
| CAAA | 30 | 1.795 | 40 | −5.137 | 147 |
| GCGG | 30 | 1.982 | 32 | −2.159 | 134 |
| ACTG | 51 | 1.473 | 45 | −12.218 | 180 |
| CGCA | 51 | 1.017 | 71 | −26.859 | 233 |
| TGTA | 84 | 2.157 | 14 | −15.204 | 193 |
| GGTT | 115 | 1.048 | 73 | −33.843 | 244 |
| GTGT | 115 | 1.888 | 30 | −10.799 | 171 |
| GTTT | 138 | 1.172 | 71 | −11.686 | 177 |
| GCAC | 148 | 2.760 | 31 | −15.092 | 192 |
| TTAG | 148 | 1.904 | 54 | −17.928 | 207 |
All the tetragrams that are uniquely overrepresented in one of the 5DC class OIs and underrepresented in the backbone, along with the z-value and rank of the tetragram in both sequences, are listed.
Table 4b.
O-islands signature (underrepresented tetragrams).
| Tetragam | O-island |
Backbone sequence |
|||
|---|---|---|---|---|---|
| OI# | z-Value | Rank | z-Value | Rank | |
| ACTA | 8 | −2.912 | 256 | 14.456 | 68 |
| AACA | 8 | −1.758 | 233 | 29.532 | 19 |
| CGGG | 8 | −1.997 | 246 | 10.116 | 83 |
| GTCA | 8 | −1.797 | 236 | 13.755 | 71 |
| TCTT | 8 | −1.150 | 213 | 22.012 | 40 |
| TGCC | 8 | −1.387 | 221 | 38.883 | 11 |
| AGCA | 28 | −1.521 | 167 | 25.525 | 31 |
| CCGG | 28 | −3.418 | 210 | 21.776 | 43 |
| GTGG | 28 | −1.611 | 172 | 7.747 | 95 |
| GTTA | 28 | −1.964 | 181 | 7.667 | 96 |
| TAGT | 28 | −2.350 | 193 | 14.291 | 69 |
| TCCT | 28 | −1.840 | 178 | 7.251 | 100 |
| TGGC | 28 | −2.732 | 198 | 18.462 | 56 |
| CTAC | 30 | −1.138 | 199 | 34.370 | 18 |
| GTAA | 30 | −2.351 | 232 | 8.637 | 89 |
| TAAC | 30 | −1.045 | 192 | 8.668 | 8 |
| TTAC | 30 | −1.801 | 219 | 10.524 | 80 |
| CCCT | 51 | −1.080 | 194 | 5.075 | 108 |
| CTTC | 51 | −2.418 | 238 | 52.641 | 4 |
| GGGA | 51 | −1.206 | 199 | 16.351 | 65 |
| CACT | 84 | −1.699 | 231 | 8.861 | 87 |
| GGTA | 84 | −1.137 | 210 | 19.760 | 49 |
| TATC | 84 | −1.125 | 209 | 22.921 | 35 |
| GGCA | 108 | −1.404 | 208 | 38.056 | 13 |
| TCAC | 108 | −1.229 | 201 | 17.896 | 58 |
| TCCC | 108 | −1.470 | 213 | 13.943 | 70 |
| AGAG | 115 | −1.846 | 233 | 22.564 | 36 |
| GGTG | 115 | −1.051 | 192 | 38.467 | 12 |
| ACCA | 138 | −1.206 | 187 | 2.861 | 118 |
| GGAG | 148 | −1.627 | 193 | 6.808 | 103 |
All the tetragrams that are uniquely underrepresented in one of the 5DC class OIs and overrepresented in the backbone, along with the z-value and rank of the tetragram in both sequences, are listed.
Fig. 4.
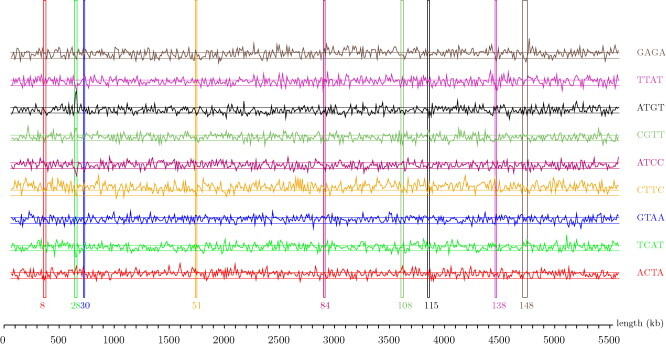
z values in 10 kb windows for tetragrams overrepresented in the backbone of the E. coli EDL933 and underrepresented in 5DC OIs. z-Plots of the most underrepresented tetragrams in each of the 5DC OIs, which are overrepresented in the backbone, are presented (ACTA is the most underrepresented in the OI #8 among the tetragrams overrepresented in the backbone, and similarly TCAT in the OI #28, GTAA in the OI #30, CTTC in the OI #51, ATCC in the OI #84, CGTT in the OI #108, ATGT in the OI #115, TTAT in the OI #138, GAGA in the OI #148). Tetragrams are ordered upward by the corresponding OIs ordering (first tetragram for the OI #8, followed by tetragrams for OI #28, #30, #51, etc.) Narrow vertical rectangles delimit each of the OIs and the color of each of them is the same as the z-plot of the tetragram the most underrepresented in it. Horizontal lines represent z values of −1 and +1 (boundary of under-overrepresentation).
On the other side, some tetragrams are overrepresented/underrepresented in a subset of OIs and underrepresented/overrepresented, respectively in the backbone, and may characterize, in a way similar to n-gram frequency distribution, the subset of OIs. For example, ATCC is underrepresented in five OIs, four of which belonging to the 5DC class (#28, #30, #84 and #148) and overrepresented in the backbone; GGCT is overrepresented in six OIs, four of which belong to the 5DC class (#30, #51, #84 and #108) and underrepresented in the backbone. Table AF4a in the additional file represents all the tetragrams that are overrepresented in an OI and underrepresented in the backbone, along with the expected number of occurrences (according to the maximal order Markov model), the observed number of occurrences, z-values of the z M statistic and the rank of the tetragrams in both OIs and the backbone. Table AF4b in the additional file represents the same data for tetragrams that are underrepresented in an OI and overrepresented in the backbone.
5. Conclusion
Although bacterial genomes are known to be substantially homogeneous regarding features such as G + C content or CU, island sequences tend to differ from the overall genome and in particular, from backbone sequences. The present investigations add n-grams as an additional feature refining characterization of OIs, classifying, and distinguishing them by classification from the backbone sequences. Structurally different classes of OIs may have different functional interpretations. Unusual n-gram content may identify additional OIs with unusual composition and thus potential candidates for PAIs. This feature may also complement criteria for predicting various island sequences in genomes where they have not yet been annotated.
Our future plans include computational experiments applying the proposed method to the island sequences of other bacterial species, in order to verify their characterization findings. We also plan to experiment with other types of motifs, such as repeats, as sequence characterization and classification features.
Acknowledgement
The work presented has been financially supported by the Ministry of Science and Technological Development of the Republic of Serbia, Project No. 144030.
References
- 1.Hacker J., Carniel E. Ecological fitness, genomic islands and bacterial pathogenicity. EMBO Rep. 2001;2(5):376–381. doi: 10.1093/embo-reports/kve097. [DOI] [PMC free article] [PubMed] [Google Scholar]
- 2.Karlin S. Detecting anomalous gene clusters and pathogenicity islands in diverse bacterial genomes. Trends Microbiol. 2001;9(7):335–343. doi: 10.1016/s0966-842x(01)02079-0. [DOI] [PubMed] [Google Scholar]
- 3.Blattner F.R., Ill G.P., Blochet C.A., Perna N.T., Burland V., Riley M., Collado-Vides J., Glasner J.D., Rode C.K., Mayhew G.F., Gregor J., Davis N.V., Kirkpatrick H.A., Goeden M.A., Rose D.J., Mau B., Shao Y. The complete genome sequence of Escherichia coli K-12. Science. 1997;277:1453–1462. doi: 10.1126/science.277.5331.1453. [DOI] [PubMed] [Google Scholar]
- 4.Lloyd A.L., Rasko D.A., Mobley H.L.T. Defining genomic islands and uropathogen-specific genes in uropathogenic Escherichia coli. J. Bacteriol. 2007;189:3532–3546. doi: 10.1128/JB.01744-06. [DOI] [PMC free article] [PubMed] [Google Scholar]
- 5.Perna N.T., Plunkett G., III, Burland V., Mau B., Glasner J.D., Rose D.J., Mayhew G.F., Evans P.S., Gregor J., Kirkpatrick H.A., Posfai G., Hackett J., Klink S., Boutin A., Shao Y., Miller L., Grotbeck E.J., Davis N.W., Limk A., Dimalantak E.T., Potamousis K.D., Apodaca J., Anantharaman T.S., Lin J., Yen G., Schwartz D.C., Welch R.A., Blattner F.R. Genome sequence of enterohemorrhagic Escherichia coli O157:H7. Nature. 2001;409:529–533. doi: 10.1038/35054089. [DOI] [PubMed] [Google Scholar]
- 6.Konopka A.K., Martindale C. Noncoding DNA, Zipf's law, and language. Science. 1995;268(5212):789. doi: 10.1126/science.7754361. [DOI] [PubMed] [Google Scholar]
- 7.Shannon C.A. Mathematical theory of communication. Bell Syst. Techn. J. 1948;27:379–423. 623–656. [Google Scholar]
- 8.Vinga S., Almeida J. Alignment-free sequence comparison—a review. Bioinformatics. 2003;19(4):513–523. doi: 10.1093/bioinformatics/btg005. [DOI] [PubMed] [Google Scholar]
- 9.Schwartz E.S. A dictionary for minimum redundancy encoding. JACM. 1963;10(4):413–439. [Google Scholar]
- 10.Wisniewski J.L. Effective text compression with simultaneous digram and trigram encoding. J. Inform. Sci. 1997;13:159–164. [Google Scholar]
- 11.Zamora E.M., Pollock J.J., Zamora A. The use of trigram analysis for spelling error detection. Inform. Process. Manage. 1981;17:305–316. [Google Scholar]
- 12.Angell R.C., Freund G.E., Willett P. Automatic spelling correction using trigram similarity measure. Inform. Process. Manage. 1983;19:255–261. [Google Scholar]
- 13.J.C. Schmitt, Trigram-based method of language identification, US Patent 5,062,143 (1991).
- 14.Cavnar W.B., Trenkle J.M. Symposium on Document Analysis and Information Retrieval. University of Nevada; Las Vegas: 1994. n-Gram-based text categorization. [Google Scholar]
- 15.Kešelj V., Peng F., Cercone N., Thomas C. Pacific Association for Computational Linguistics. Dalhousie University; Halifax, NS, Canada: 2003. n-Gram-based author profiles for authorship attribution, PACLING’03. [Google Scholar]
- 16.Damashek M. Gauging similarity with n-grams: language-independent categorization of text. Science. 1995;267(5199):843–848. doi: 10.1126/science.267.5199.843. [DOI] [PubMed] [Google Scholar]
- 17.Krzywicki A., Slonimski P.P. Formal analysis of protein sequences. I. Specific long range constraints in pair associations of amino acids. J. Theor. Biol. 1967;17:136–158. doi: 10.1016/0022-5193(67)90025-2. [DOI] [PubMed] [Google Scholar]
- 18.Radomski J.P., Slonimski P.P. Genomic style of proteins: concepts, methods and analysis of ribosomal proteins from 16 microbial species. FEMS Microbiol. Rev. 2001;25:425–435. doi: 10.1111/j.1574-6976.2001.tb00585.x. [DOI] [PubMed] [Google Scholar]
- 19.Rosato V., Pucello N., Giuliano G. Evidence for cysteine clustering in thermophylic proteomes. Trends Genet. 2002;18:278–281. doi: 10.1016/S0168-9525(02)02691-4. [DOI] [PubMed] [Google Scholar]
- 20.Phillips G.J., Arnold J., Ivarie R. The effect of codon usage on the oligonucleotide composition of the E. coli genome and identification of over- and underrepresented sequences by Markov chain analysis. NAR. 1987;15(6):2627–2638. doi: 10.1093/nar/15.6.2627. [DOI] [PMC free article] [PubMed] [Google Scholar]
- 21.Phillips G.J., Arnold J., Ivarie R. Mono-through hexanucleotide composition of the Escherichia coli genome: a Markov chain analysis. NAR. 1987;15(6):2611–2626. doi: 10.1093/nar/15.6.2611. [DOI] [PMC free article] [PubMed] [Google Scholar]
- 22.Colosimo A., Morante S., Parisi V., Rosi G.C. An improved method for detection of words with unusual occurrence frequency in nucleotide sequences. J. Theor. Biol. 1993;165:659–672. doi: 10.1006/jtbi.1993.1212. [DOI] [PubMed] [Google Scholar]
- 23.Schbath S., Prum B., de Turckheim E. Exceptional motifs in different Markov chain models for a statistical analysis of DNA sequences. J. Comp. Biol. 1995;2:417–437. doi: 10.1089/cmb.1995.2.417. [DOI] [PubMed] [Google Scholar]
- 24.Gelfand M.S., Koonin E.V. Avoidance of palindromic words in bacterial and archaeal genomes: a close connection with restriction enzymes. NAR. 1997;25:2430–2439. doi: 10.1093/nar/25.12.2430. [DOI] [PMC free article] [PubMed] [Google Scholar]
- 25.Karlin S., Mrazek J., Campbell A.M. Compositional biases of bacterial genomes and evolutionary implications. J. Bacteriol. 1997;179:3899–3913. doi: 10.1128/jb.179.12.3899-3913.1997. [DOI] [PMC free article] [PubMed] [Google Scholar]
- 26.Karlin S., Burge C. Dinucleotide relative abundance extremes: a genomic signature. Trends Genet. 2000;11:283–290. doi: 10.1016/s0168-9525(00)89076-9. [DOI] [PubMed] [Google Scholar]
- 27.Rocha E.P.C., Viari A., Danchin A. Oligonucleotide bias in Bacillus subtilis: general trends and taxonomic comparisons. NAR. 1998;26:2971–2980. doi: 10.1093/nar/26.12.2971. [DOI] [PMC free article] [PubMed] [Google Scholar]
- 28.Pevzner P.A., Borodovsky M.Y., Mironov A.A. Linguistics of nucleotide sequences. I. The significance of deviation from mean statistical characteristics and prediction of the frequencies of occurrence of words. J. Biomol. Struct. Dynam. 1989;6:1013–1026. doi: 10.1080/07391102.1989.10506528. [DOI] [PubMed] [Google Scholar]
- 29.Karlin S., Burge C., Campbell A.M. Statistical analysis of counts and distributions of restriction sites in DNA sequences. NAR. 1992;20:1363–1370. doi: 10.1093/nar/20.6.1363. [DOI] [PMC free article] [PubMed] [Google Scholar]
- 30.Burge C., Campbell A.M., Karlin S. Over- and under-representation of short oligonucleotides in DNA sequences. PNAS. 1992;89:1358–1362. doi: 10.1073/pnas.89.4.1358. [DOI] [PMC free article] [PubMed] [Google Scholar]
- 31.Schbath S. An efficient statistic to detect over- and under- represented words in DNA sequences. J. Comp. Biol. 1997;4:189–192. doi: 10.1089/cmb.1997.4.189. [DOI] [PubMed] [Google Scholar]
- 32.Elhai J. Determination of bias in the relative abundance of oligonucleotides in DNA sequences. J. Comp. Biol. 2001;8:151–175. doi: 10.1089/106652701300312922. [DOI] [PubMed] [Google Scholar]
- 33.Reinert G., Schbath S., Waterman M.S. Probabilistic and statistical properties of words: an overview. J. Comput. Biol. 2000;7:1–46. doi: 10.1089/10665270050081360. [DOI] [PubMed] [Google Scholar]
- 34.Blaisdall B.E. A measure of the similarity of sets of sequences not requiring sequence alignment. PNAS. 1986;83:5155–5159. doi: 10.1073/pnas.83.14.5155. [DOI] [PMC free article] [PubMed] [Google Scholar]
- 35.Blaisdall B.E. Effectiveness of measures requiring and not requiring prior sequence alignment for estimating the dissimilarity of natural sequences. J. Mol. Evol. 1989;29:526–537. doi: 10.1007/BF02602924. [DOI] [PubMed] [Google Scholar]
- 36.Blaisdall B.E. Average values of a dissimilarity measure not requiring sequence alignment are twice the averages of conventional mismatch counts requiring sequence alignment for computer generated system model. J. Mol. Evol. 1989;29:538–547. doi: 10.1007/BF02602925. [DOI] [PubMed] [Google Scholar]
- 37.Karlin S. Statistical significance of sequence patterns in proteins. Curr. Opin. Struct. Biol. 1995;5:360–371. doi: 10.1016/0959-440x(95)80098-0. [DOI] [PubMed] [Google Scholar]
- 38.Lippert R.A., Huang H.Y., Waterman M.S. Distributional regimes for the number of k-word matches between two random sequences. PNAS. 2002;99:13980–13989. doi: 10.1073/pnas.202468099. [DOI] [PMC free article] [PubMed] [Google Scholar]
- 39.Radomski J.P., Slonimski P.P. Primary sequences of proteins from complete genomes display a singular periodicity: alignment-free N-gram analysis. C. R. Biol. 2007;330:33–48. doi: 10.1016/j.crvi.2006.11.001. [DOI] [PubMed] [Google Scholar]
- 40.Stuart G.W., Moffett K., Baker S. Integrated gene and species phylogenies from unaligned whole genome protein sequences. Bioinformatics. 2002;18:100–108. doi: 10.1093/bioinformatics/18.1.100. [DOI] [PubMed] [Google Scholar]
- 41.Edgar R.C. Local homology recognition and distance measures in linear time using compressed amino acid alphabets. NAR. 2004;32:380–384. doi: 10.1093/nar/gkh180. [DOI] [PMC free article] [PubMed] [Google Scholar]
- 42.Qi J., Wang B., Hao B.I. Whole proteome prokaryote phylogeny without sequence alignment: a k-string composition approach. J. Mol. Evol. 2004;58:2924–2935. doi: 10.1007/s00239-003-2493-7. [DOI] [PubMed] [Google Scholar]
- 43.Solovyev V.V., Makarova K.S. A novel method of protein sequence classification based on oligopeptide frequency analysis and its application to search for functional sites and to domain localization. Comput. Appl. Biosci. 1993;9:17–24. doi: 10.1093/bioinformatics/9.1.17. [DOI] [PubMed] [Google Scholar]
- 44.Cheng B.Y., Carbonell J.G., Klein-Seetharaman J. Protein classification based on text document classification techniques. Proteins. 2005;58:955–970. doi: 10.1002/prot.20373. [DOI] [PubMed] [Google Scholar]
- 45.Daeyaert F., Moereels H., Lewi P.J. Classification and identification of proteins by means of common and specific amino acid n-tuples in unaligned sequences. Comput. Methods Prog. Biomed. 1998;56:221–233. doi: 10.1016/s0169-2607(98)00031-5. [DOI] [PubMed] [Google Scholar]
- 46.Ganapathiraju M., Weisser D., Klein-Seetharaman J., Rosenfeld R., Carbonell J., Reddy R. Comparative n-gram analysis of whole-genome sequences, HLT’02. Human Language Technologies Conference; San Diego; 2002. [Google Scholar]
- 47.Ganapathiraju M., Klein-Seetharaman J., Rosenfeld R., Carbonell J., Reddy R. Rare and frequent amino acid n-grams in whole-genome protein sequences, RECOMB’02. The Sixth Annual International Conference on Research in Computational Molecular Biology; Washington DC, USA; April 2002. [Google Scholar]
- 48.King B.R., Guda C. ngLOC: an n-gram-based Bayesian method for estimating the subcellular proteomes of eukaryotes. Genome Biol. 2007;8(5):R68. doi: 10.1186/gb-2007-8-5-r68. [DOI] [PMC free article] [PubMed] [Google Scholar]
- 49.Vinga S., Gouveia-Oliveira R., Almeida J.S. Comparative evaluation of word composition distances for the recognition of SCOP relationships. Bioinformatics. 2004;20:206–215. doi: 10.1093/bioinformatics/btg392. [DOI] [PubMed] [Google Scholar]
- 50.Volkovich Z., Kirzhner V., Bolshoy A., Nevo E., Korol A. The method of N-grams in large-scale clustering of DNA texts. Pattern Recogn. 2005;38:1902–1912. [Google Scholar]
- 51.Kirzhner V., Nevo E., Korol A., Bolshoy A. A large-scale comparison of genomic sequences: one promising approach. Acta Biotheor. 2003;51:73–89. doi: 10.1023/a:1024553109779. [DOI] [PubMed] [Google Scholar]
- 52.Tomović A., Janičić P., Kešelj V. N-Gram-based classification and unsupervised hierarchical clustering of genome sequences. Comput. Methods Prog. Biomed. 2006;81:137–153. doi: 10.1016/j.cmpb.2005.11.007. [DOI] [PubMed] [Google Scholar]
- 53.Rajan I., Aravamuthan S., Mande S.S. Identification of compositionally distinct regions in genomes using the centroid method. Bioinformatics. 2007;23(20):2672–2677. doi: 10.1093/bioinformatics/btm405. [DOI] [PubMed] [Google Scholar]
- 54.Srividhya K.V., Alaguraj V., Poornima G., Kumar D., Singh G.P., Raghavenderan L., Katta A.V.S.K.M., Mehta P., Krishnaswamy S. Identification of prophages in bacterial genomes by dinucleotide relative abundance difference. PLoS One. 2007;2(11):e1193. doi: 10.1371/journal.pone.0001193. [DOI] [PMC free article] [PubMed] [Google Scholar]
- 55.Tobi D., Bahar I. Recruitment of rare 3-grams at functional sites: Is this a mechanism for increasing enzyme specificity? BMC Bioinform. 2007;8:226. doi: 10.1186/1471-2105-8-226. [DOI] [PMC free article] [PubMed] [Google Scholar]
- 56.Pavlović-Lažetić G., Mitić N., Beljanski M., Tomović A. Mutational analysis of SARS CoV genome, MCCMB’05. Moscow Conference on Computational Molecular Biology; Moscow, Russia; 2005. [Google Scholar]
- 57.D. Vitas, G. Pavlović-Lažetić, C. Krstev, About word length counting in Serbian, in: P. Grzybek (Ed.), Word Length Studies and Related Issues, Contributions to the Science of Text and Language, Series: Text, Speech and Language Technology, Springer-Verlag, Heidelberg, 2006, pp. 279–295.
- 58.Mitić N., Pavlović-Lažetić G., Beljanski M. Could N-gram analysis contribute to genomic island determination? J. Biomed. Inform. 2008;41:936–943. doi: 10.1016/j.jbi.2008.03.007. [DOI] [PubMed] [Google Scholar]
- 59.Hsiao W., Wan I., Jones S.J., Brinkman F.S.L. IslandPath: aiding detection of genomic islands in prokaryotes. Bioinformatics. 2003;19(3):418–420. doi: 10.1093/bioinformatics/btg004. [DOI] [PubMed] [Google Scholar]
- 60.Mantri Y., Williams K.P. Islander: a database of integrative islands in prokaryotic genomes, the associated integrases and their DNA site specificities. NAR. 2004;32(DB issue):D55–D58. doi: 10.1093/nar/gkh059. [DOI] [PMC free article] [PubMed] [Google Scholar]
- 61.Merkl R. SIGI: score-based identification of genomic islands. BMC Bioinform. 2004;5(22):1–14. doi: 10.1186/1471-2105-5-22. [DOI] [PMC free article] [PubMed] [Google Scholar]
- 62.Yoon S.H., Hur C.-G., Kang H.-Y., Kim Y.H., Oh T.K., Kim J.F. A computational approach for identifying pathogenicity islands in prokaryotic genomes. BMC Bioinform. 2005;6(184):1–11. doi: 10.1186/1471-2105-6-184. [DOI] [PMC free article] [PubMed] [Google Scholar]
- 63.Yoon S.H., Park Y.-K., Lee S., Choi D., Oh T.K., Hur C.-G., Kim J.F. Towards pathogenomics: a web based resource for pathogenicity islands. NAR. 2007;35(DB issue):D395–D400. doi: 10.1093/nar/gkl790. [DOI] [PMC free article] [PubMed] [Google Scholar]
- 64.PubMed NCBI Entrez, http://www.ncbi.nlm.nih.gov/entrez.
- 65.Schmidt H., Hensel M. Pathogenecity islands in bacterial pathogenesis. Clin. Microbiol. Rev. 2004;17:14–56. doi: 10.1128/CMR.17.1.14-56.2004. [DOI] [PMC free article] [PubMed] [Google Scholar]
- 66.Zhang R., Zhang C.-T. A systematic method to identify genomic islands and its applications in analyzing the genomes of Corynebacterium glutamicum and Vibrio vulnificus CMCP6 chromosome I. Bioinformatics. 2004;20:612–622. doi: 10.1093/bioinformatics/btg453. [DOI] [PubMed] [Google Scholar]
- 67.Levesque R. SPSS Inc.; Chicago, IL, USA: 2007. SPSS Programming and Data Management: A Guide for SPSS and SAS Users. [Google Scholar]
- 68.Manning C.D., Raghavan P., Schütze H. Cambridge University Press; Cambridge, England: 2007. An Introduction to Information Retrieval. [Google Scholar]
- 69.Welch R.A., Burland V., 3rd Plunkett G., Redford P., Roesch P., Rasko D., Buckles E.L., Liou S.-R., Boutin A., Hackett J., Stroud D., Mayhew G.F., Rose D.J., Zhou S., Schwartz D.C., Perna N.T., Mobley H.L.T., Donnenberg M.S., Blattner F.R. Extensive mosaic structure revealed by the complete genome sequence of uropathogenic Escherichia coli. PNAS. 2002;99:17020–17024. doi: 10.1073/pnas.252529799. [DOI] [PMC free article] [PubMed] [Google Scholar]
- 70.Genscript Com, http://www.genscript.com/cgi-bin/products/enzyme.cgi?op=all_ez.