

Abstract
Chronic kidney disease (CKD) is a key cause of hypertension and a potent independent risk for cardiovascular disease. Epidemiological studies suggest a strong genetic component determining susceptibility for renal disease and, by inference, the associated cardiovascular risk. With a subtotal nephrectomy model of kidney disease, we found the 129S6 mouse strain to be very susceptible to the development of hypertension, albuminuria, and kidney injury, whereas the C57BL/6 strain is relatively resistant. Accordingly, we set out to map quantitative trait loci conferring susceptibility to hypertension and albuminuria using this model with F2 mice. We found significant linkage of the blood pressure trait to two loci. At D11Mit143, mice homozygous for the 129S6 allele had significantly higher systolic blood pressure than mice heterozygous or homozygous for the C57BL/6 allele. Similarly, at D1Mit308, there was an excellent correlation between genotype and the blood pressure phenotype. The effect of the chromosome 11 locus was verified with a separate cohort of F2 mice. For the albuminuria trait, a significant locus was found at D11Mit143, which overlaps the blood pressure trait locus. Our studies have identified a region spanning ~8cM on mouse chromosome 11 that is associated with susceptibility to hypertension and albuminuria in CKD.
Keywords: chronic kidney disease, sub-total nephrectomy or sub-total renal ablation, genetic susceptibility, hypertension, albuminuria, kidney injury
Chronic kidney disease (CKD) is defined as a persistent reduction in glomerular filtration rate and/or the presence of albuminuria.1 CKD is highly prevalent, with recent estimates suggesting that more than 18 million people in the United States are affected.2 One consequence of CKD is progression to end-stage renal disease requiring renal replacement therapy including dialysis and/or renal transplantation. However, perhaps more important from a public health standpoint are emerging data showing that CKD is a powerful risk factor for the development of cardiovascular disease.3–8 Hypertension is a risk factor for cardiovascular and kidney diseases, and is also a common complication of CKD. The prevalence of hypertension in patients with CKD is three to four times that of the general population, affecting approximately 50–75% of individuals with GFR < 60 ml/min/1.73 m2 (CKD stages 3–5).1
There is growing evidence that inherited factors contribute to the progression of CKD. For example, African Americans with hypertension are seven times more likely to develop end-stage renal disease than Caucasians.2 Similarly, in diabetic nephropathy, African Americans, Mexican Americans, and American Indians have a disproportionately higher incidence of end-stage renal disease than Caucasians.9,10 There have also been many reports of familial clustering of cases of end-stage renal disease and diabetic nephropathy.11–16 Population-based and family-based epidemiological studies support the premise that susceptibility to development and progression of kidney disease and its complications has a heritable component. However, demonstration of specific genetic variants that determine susceptibility to development and progression of CKD and its associated cardiovascular risks have been elusive.
Various animal models of CKD that resemble the disease process in humans have been widely used to attempt to unravel the mechanisms that cause progression of kidney injury. One of these models is subtotal nephrectomy. The surgical excision of renal mass is thought to recapitulate the maladaptive elevation of the single-nephron glomerular hyperfiltration process17 in the remaining nephrons in humans, regardless of the primary etiology of kidney injury. This simple model in rats results in a number of features of CKD in humans, including hypertension, albuminuria, and glomerulosclerosis,18 and established the efficacy of ACE inhibitors that is now widely used clinically in the prevention of progression of kidney disease.19,20 However, responses to subtotal nephrectomy are variable in mice and previous studies have suggested that common strains of laboratory mice have varying susceptibilities to the development of hypertension, albuminuria, and kidney injury after renal ablation.21,22 The purpose of this study was to characterize the effects of genetic background on the manifestations of CKD in the mouse and to localize these modifying genes to specific chromosomal segments.
RESULTS
Genetic effects that enhance susceptibility to hypertension in CKD
To determine whether genetic factors contribute to the severity and manifestations of CKD, we examined responses to subtotal nephrectomy in two common inbred laboratory strains, 129S6 (formerly 129/SvEv), and C57BL/6. As hypertension is commonly the first clinically detected cardiovascular consequence of CKD and the source of significant morbidity in CKD patients, we first examined blood pressure responses using tail-cuff manometry in the 7th to 10th week after subtotal nephrectomy. Baseline systolic blood pressures were similar between 129S6 and C57BL/6 mice (104 ± 3, n = 20 vs 103 ± 2 mm Hg, n = 20; P = NS). After subtotal nephrectomy, blood pressures increased in both strains compared to baseline (P< 0.0005), but were significantly higher in the 129S6 mice (143 ± 16 mm Hg, n = 16) than the B6 mice (127 ± 11 mm Hg, n = 19, P = 0.004) (Figure 1).
Figure 1 |. Systolic blood pressure at baseline and after subtotal nephrectomy.
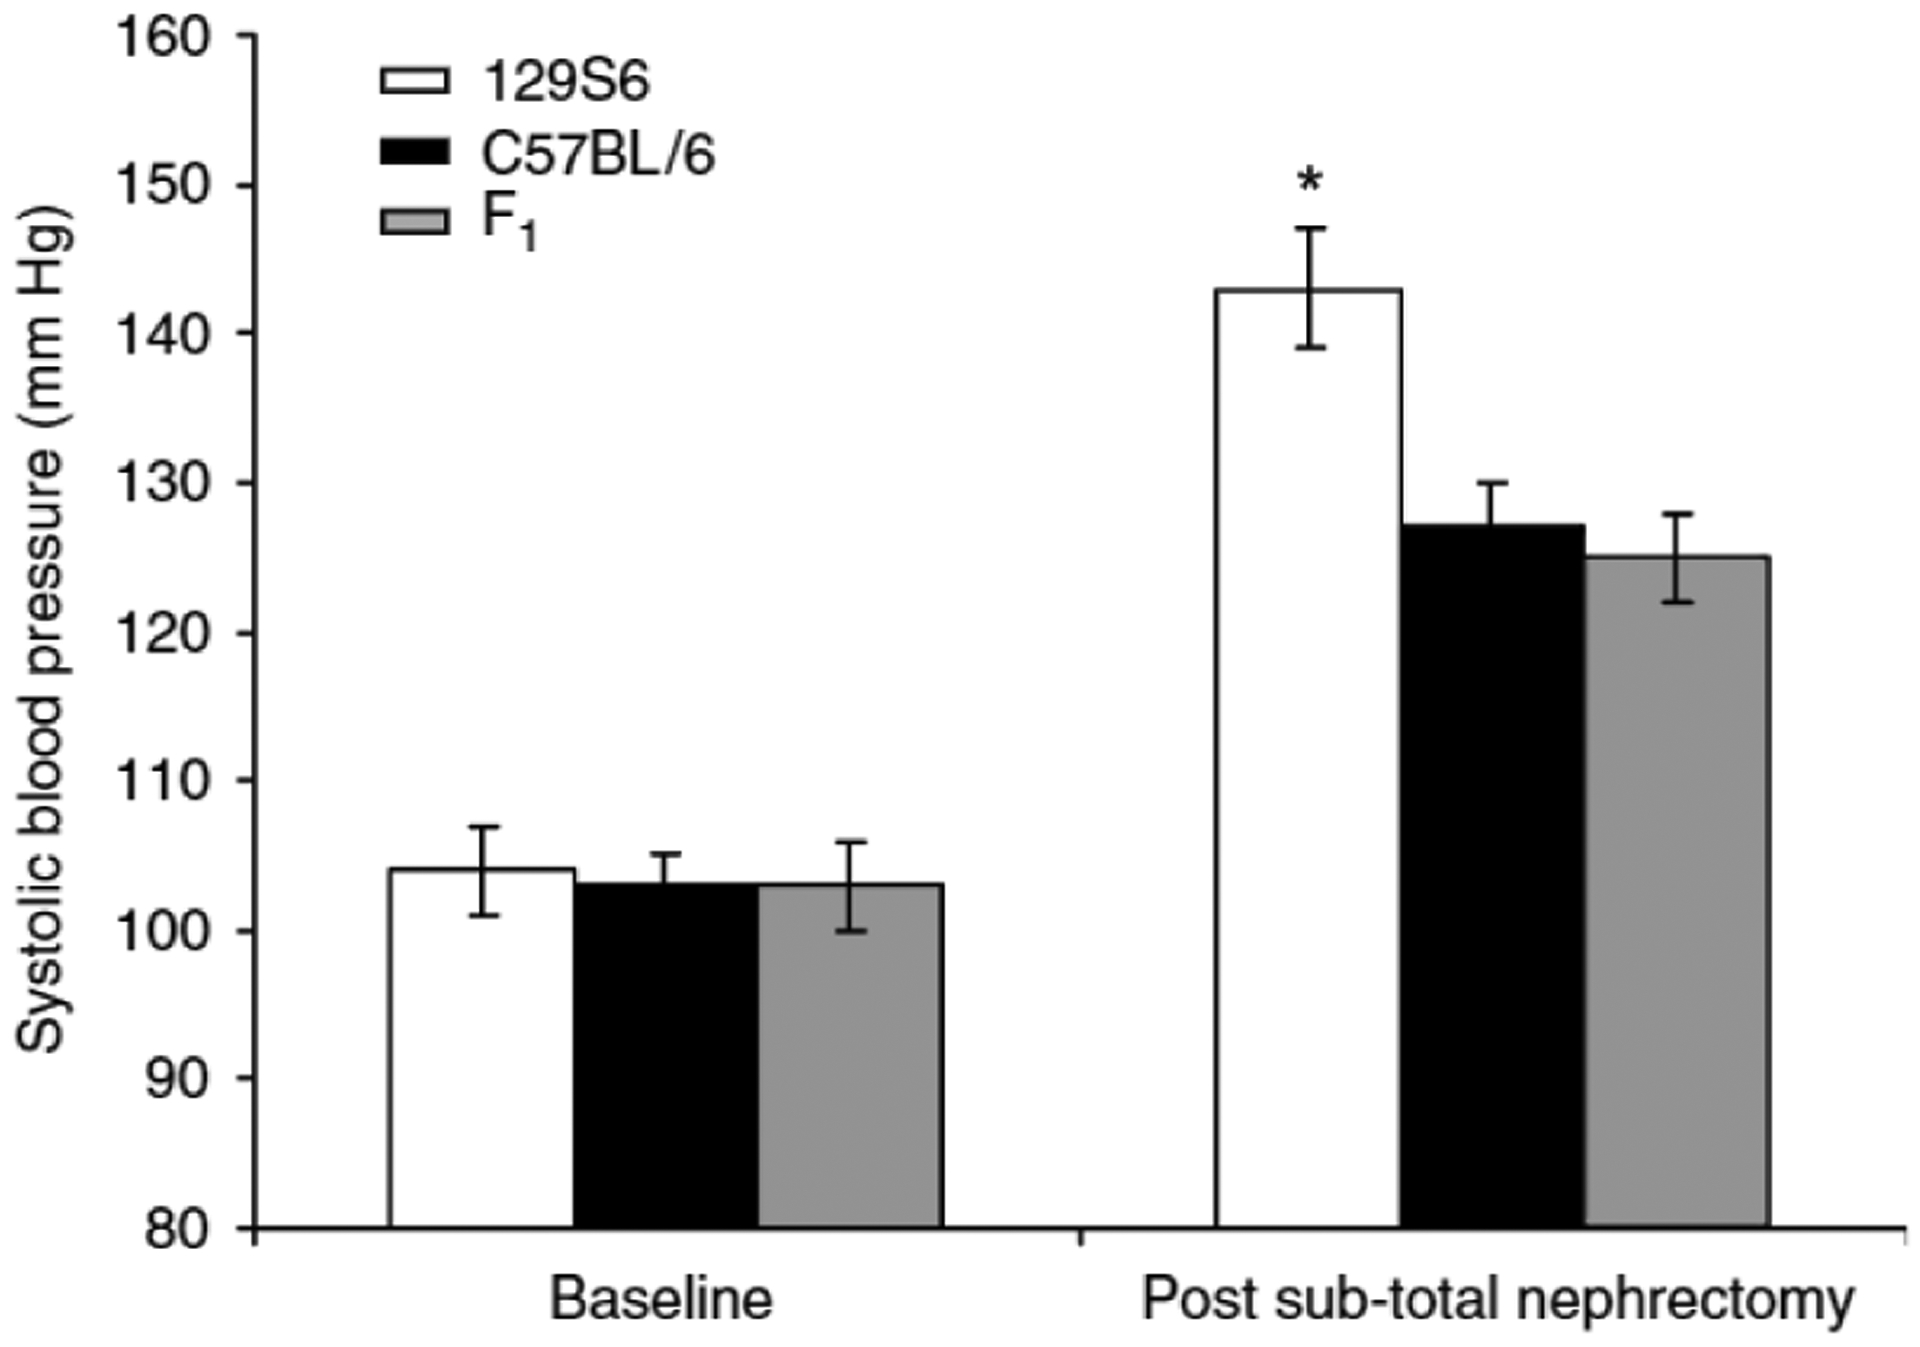
Systolic blood pressure was measured by tail-cuff. At baseline, blood pressures were similar between 129S6 (white bar), C57BL/6 (black bar), and F1 (129S6 × C57BL/6) (gray bar) mice. After subtotal nephrectomy, blood pressures increased in all groups compared to baseline, but were significantly higher in the 129S6 strain compared to C57BL/6 and F1 mice, *P = 0.001, ANOVA, one-way. Values are expressed as mean±s.e.m.
We next compared blood pressures in the F1 (129S6 × C57BL/6) cross with those of the parental lines. Baseline systolic blood pressures of the F1 mice were similar to those of the parental lines (103 ± 3 mm Hg, P = NS). After subtotal nephrectomy, blood pressures in the F1 mice were virtually identical to those of the C57BL/6 mice (125 ± 15 mm Hg, n = 20; P = NS) (Figure 1). By analysis of variance (ANOVA), blood pressures were significantly higher in the 129S6 group after subtotal nephrectomy compared to either the C57BL/6 (26.94, −3.06) or F1 (−28.91, −6.83) group (P = 0.001). This suggests that there are genes with recessive effects on the 129S6 background that confer susceptibility to development of hypertension after reduction of renal mass.
Genetic effects that enhance susceptibility to albuminuria and kidney injury in CKD
As albuminuria is a key marker of kidney injury, we measured urinary albumin excretion, expressed as albumin/creatinine (A/C) ratio, in the three experimental groups. In previous studies in mice23 and in our own experience, the A/C ratio correlates well with 24-h urinary albumin excretion. As with blood pressure, we found significant strain differences in the extent of albuminuria after subtotal nephrectomy. The 129S6 mice had the highest levels of A/C ratio (366 ± 112 μg/mg), followed by the C57BL/6 mice (174 ± 36 μg/mg) and F1 mice (44 ± 8 μg/mg), P < 0.004 (ANOVA, one-way) (Figure 2).
Figure 2 |. A/C ratios after subtotal nephrectomy.
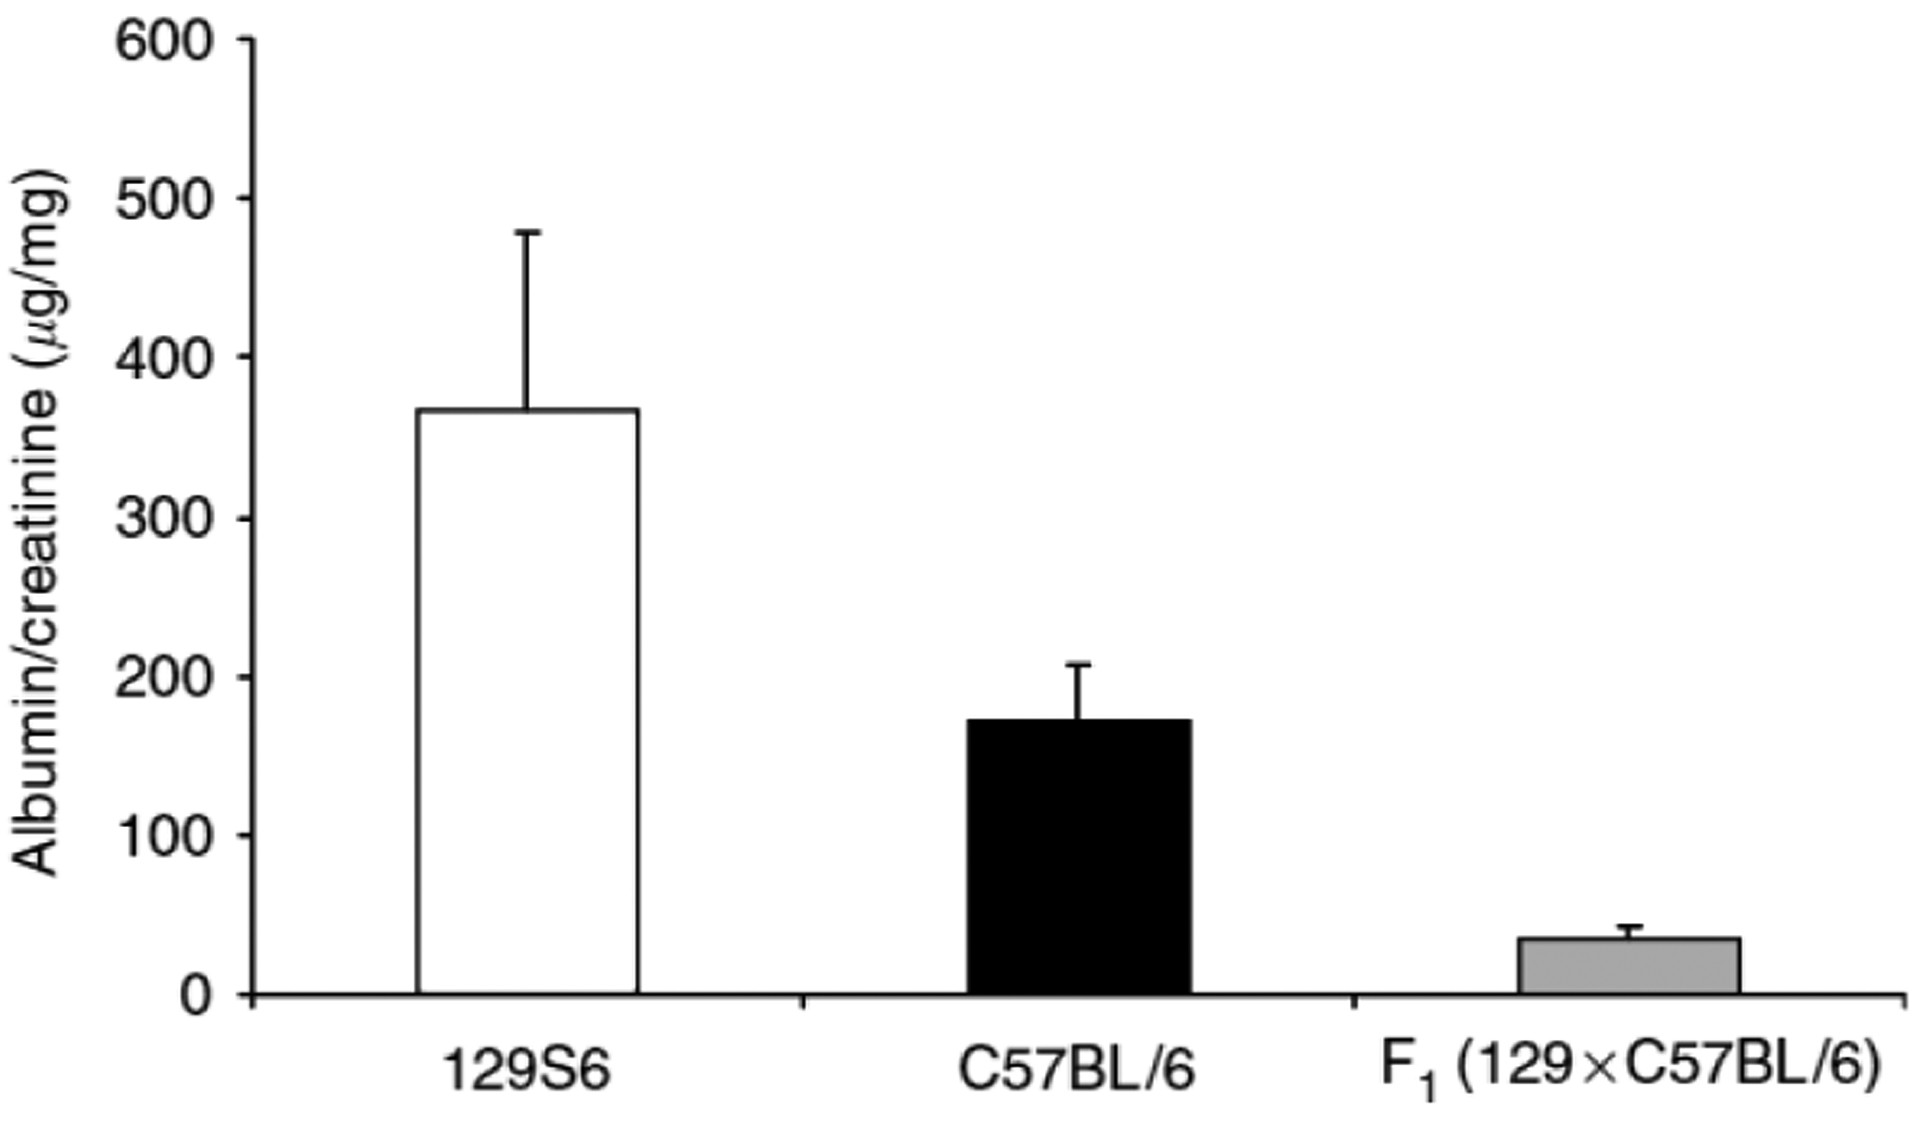
129S6 mice have significantly higher A/C ratios than C57BL/6 and F1 mice. Values are expressed as mean±s.d. 129S6 (white bar) 366 ± 112 μg/mg, n = 16; C57BL/6 (black bar) 174 ± 36, n = 19; F1 (129S6 × C57BL/6) (gray bar) 44 ± 8, n = 20. P = <0.004, ANOVA, one-way.
We next compared kidney histopathology between the experimental groups. Thirteen weeks after subtotal nephrectomy, 129S6 mice developed kidney injury characterized by glomerulosclerosis and tubulo-interstitial inflammation characterized by lymphocytic infiltration (Figure 3a and b). By contrast, the extent of renal pathology was less severe in the C57BL/6 animals (Figure 3c and d). The severity of the pathological changes was also quantitated by our renal pathologist masked to the experimental groups. As shown in Figure 4, the extent of kidney pathology was significantly worse in the 129S6 group than the C57BL/6 mice (19 ± 8, n = 16 vs 13 ± 3, n = 19; P = 0.02). On the other hand, the F1 animals were significantly more resistant to renal injury than either parental line (severity score: 8 ± 2, n = 20; P < 0.0005 by ANOVA, one-way). Taken together, these studies suggest that there are strain-specific genetic factors between the 129S6 and C57BL/6 lines with strong actions to influence the development of hypertension, proteinuria, and kidney injury in this model of CKD.
Figure 3 |. Kidney histology 13 weeks after subtotal nephrectomy.
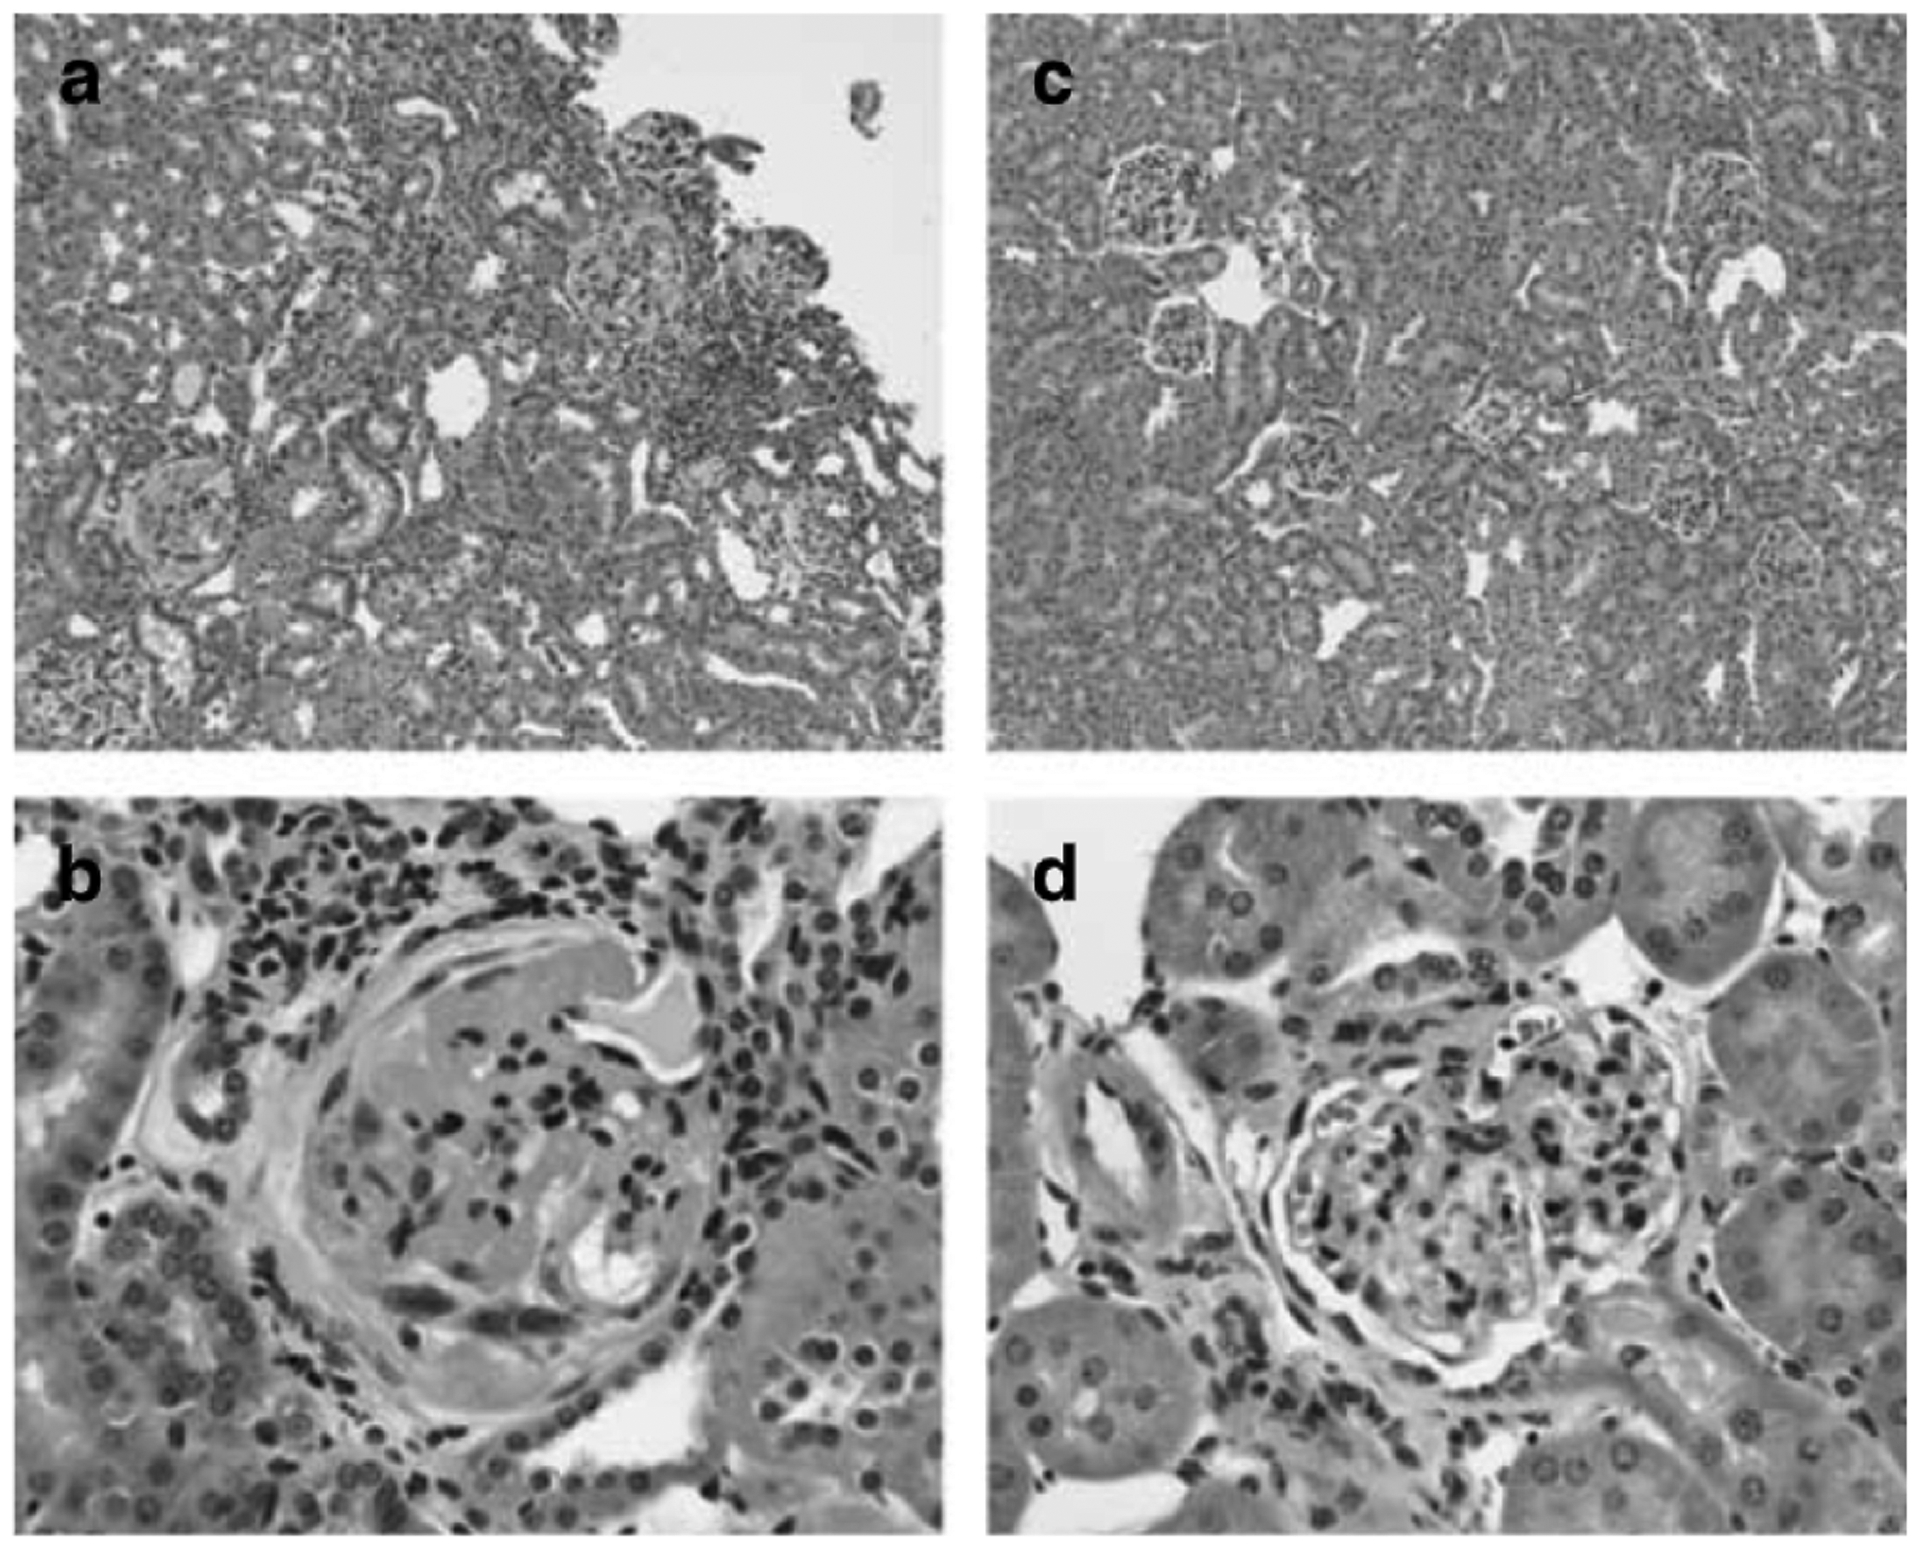
129S6 mice develop tubulo-interstitial inflammatory changes with lymphocytic infiltration (a (× 10)) and severe glomerulosclerosis characterized by marked mesangial matrix deposition (b (× 40)). C57BL/6 mice have negligible tubulo-interstitial disease (c (× 10)) and develop only mild mesangial expansion and hypercellularity of the glomeruli (d (40 ×)).
Figure 4 |. Total kidney injury scores.
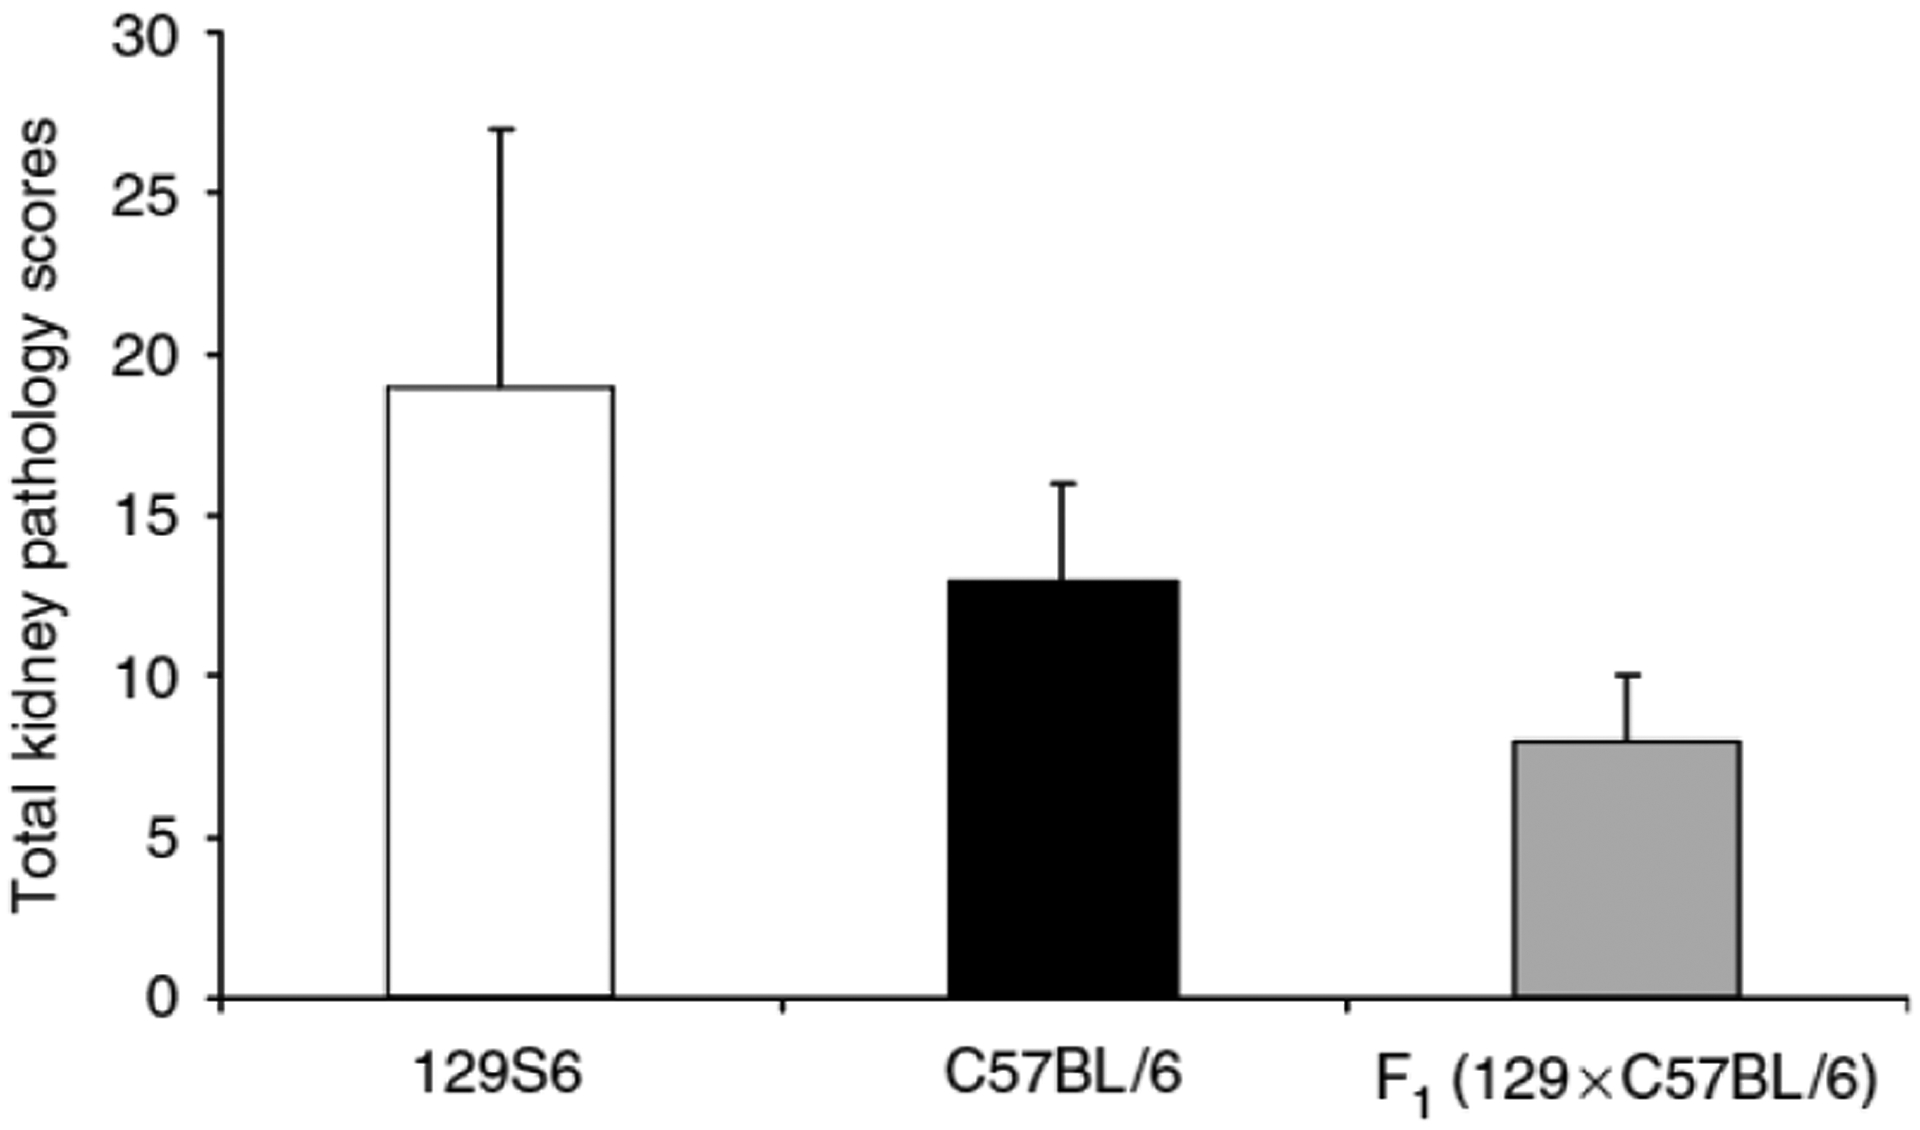
Values are expressed as mean±s.d. 129S6 (white bar) 19 ± 8, n = 16; C57BL/6 (black bar) 13 ± 3, n = 19; F1 (129S6 × C57BL/6) (gray bar) 8 ± 2, n = 20. P = 0.02 for 129S6 vs C57BL/6; P < 0.005 for F1 vs 129S6 and C57BL/6, ANOVA, one-way.
Linkage of CKD-associated hypertension to chromosomes 11 and 1
Based on our observations in the parental strains, we first set out to map the quantitative trait loci (QTLs) conferring susceptibility to hypertension in this model of CKD. To this end, we performed subtotal nephrectomy on F2 mice, and began whole genome scan using 44 consecutive animals. Our scan revealed significant linkage of the blood pressure trait to two loci, one on chromosome 1, Ckdbp1 (CKD Blood Pressure Locus 1), and one on chromosome 11, Ckdbp2, as shown in Figure 5a.
Figure 5 |. Genome-wide scan and mapping for blood pressure trait.
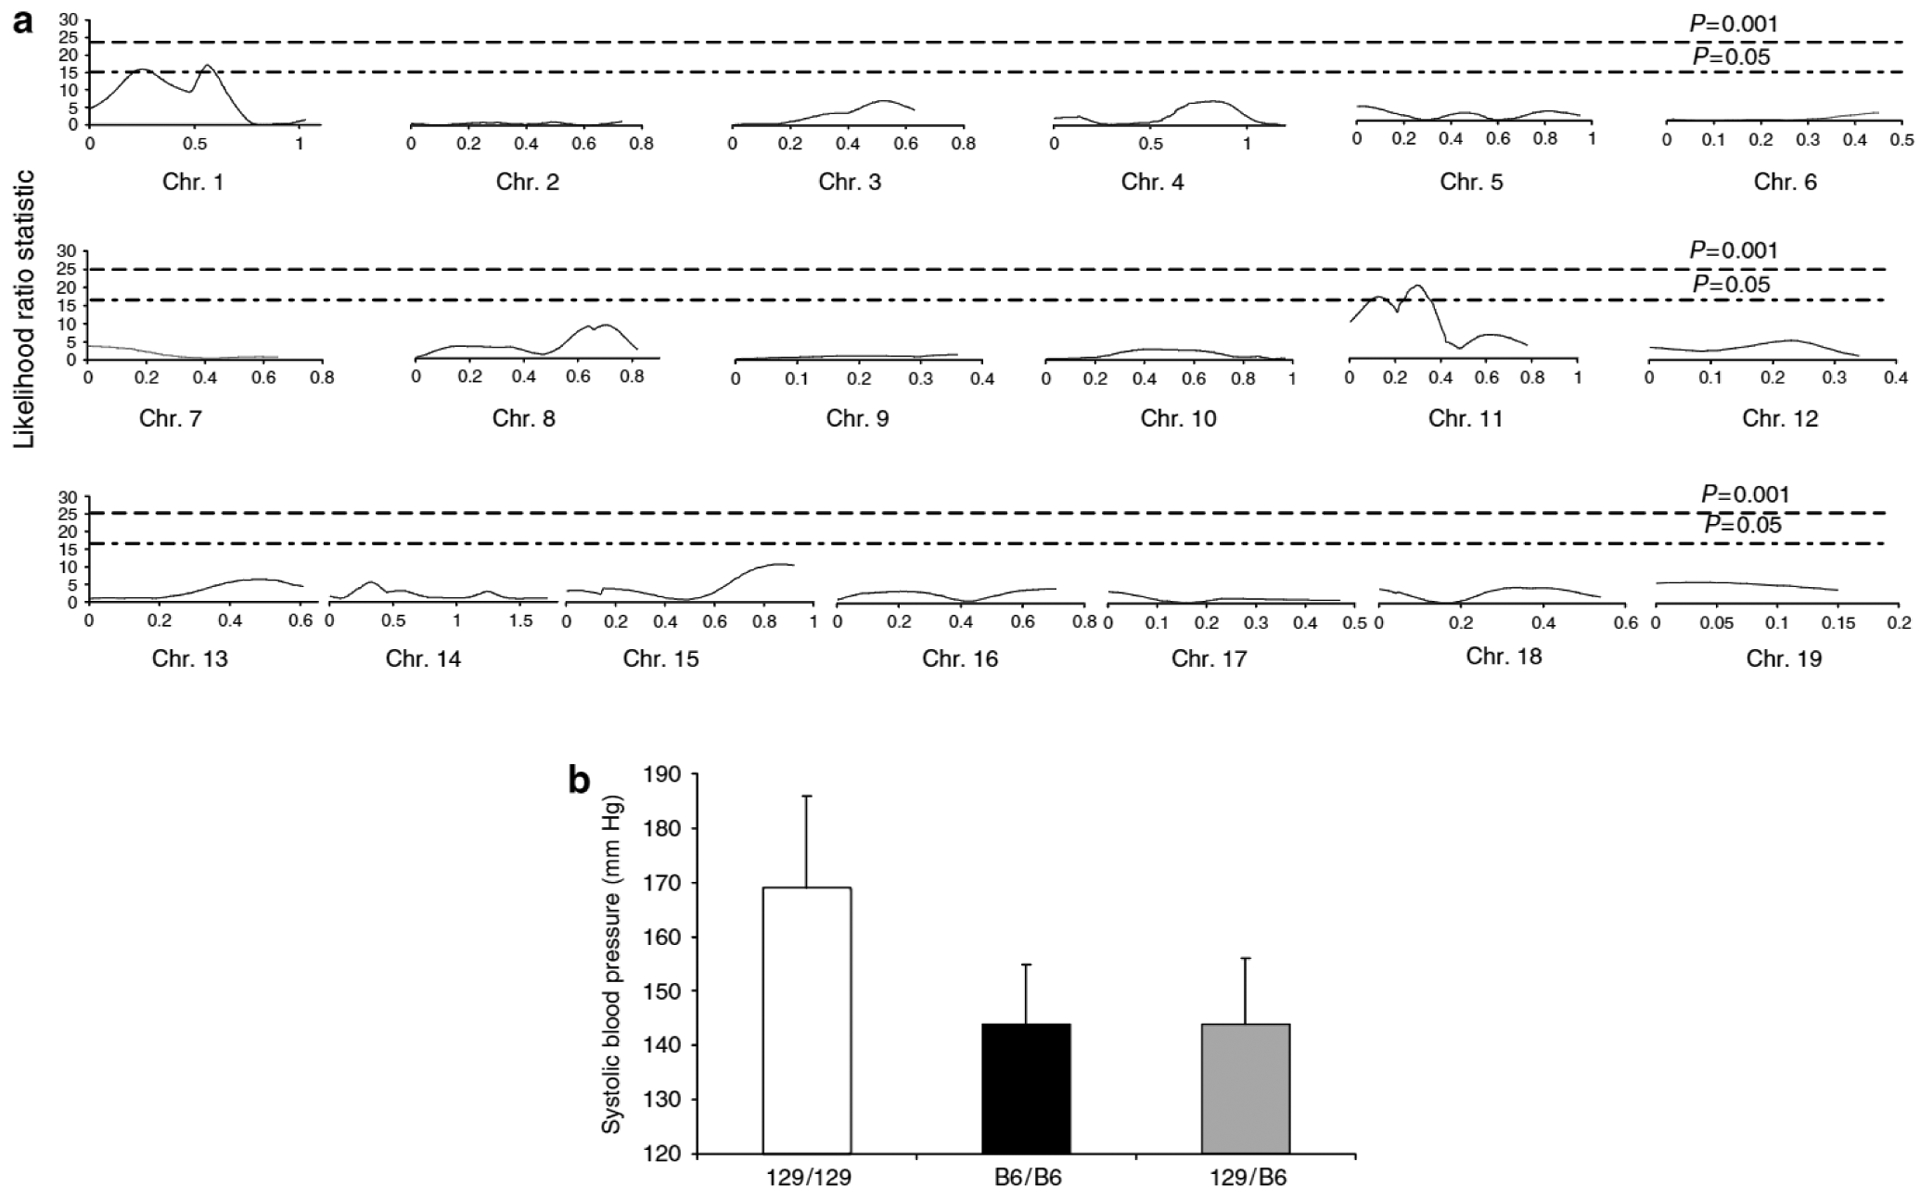
(a) Linkage analysis. Interval maps of each of the autosomes for blood pressure trait are shown. Statistical significance was determined using data permutation tests and the P = 0.05 and 0.001 thresholds. Only two regions of the genome, one on chromosome 1 and one on chromosome 11, passed the P = 0.05 threshold for blood pressure trait, (b) Blood pressure vs genotype at D11Mit143. Values are expressed as mean±s.d. Homozygous for 129S6 allele (129)(white bar) 169 ± 19mm Hg, homozygous for C57BL/6 allele (black bar) (B6) 144 ± 12mm Hg, and heterozygous (gray bar) (129/B6) 144 ± 11 mm Hg. Values are expressed as mean±s.d. P < 0.0005, ANOVA, one-way.
By interval mapping (Figure 5a), at the Ckdbp2 locus on chromosome 11, the likelihood ratio statistic (LRS) score approached highly significant linkage criteria LRS 22 (logarithm of the odds score ~4.8), and exceeded significance at the Ckdbp1 locus on chromosome 1, LRS 17.3 (logarithm of the odds score ~ 3.8). Ckdbp2 and Ckdbp1 explain 39 and 21% of the variance for blood pressure, respectively. We next compared blood pressure levels between animals of each genotype at the D11Mit143 marker on chromosome 11. As shown in Figure 5b, mice homozygous at D11Mit143 for the 129S6 allele had significantly higher blood pressures (169 ± 17 mm Hg; n = 9) than mice that were heterozygous (144 ± 11 mm Hg; n = 26) or homozygous for the C57BL/6 allele (144 ± 12 mm Hg; n = 9; P < 0.0005). This pattern was similar for Ckdbp1 on chromosome 1. Mice homozygous for the 129S6 allele at D1Mit308 had significantly higher blood pressures (167 ± 19 mm Hg) than heterozygotes (146 ± 14 mm Hg) or mice that were homozygous for the C57BL/6 allele (142 ± 8 mm Hg; P < 0.0005, graph not shown). Thus, within both QTLs, homozygosity for the 129S6 allele was associated with a significant increase in blood pressure.
We next performed interaction mapping and found no interaction between these two QTLs even at significance threshold set at the lowest level of stringency of P = 0.05. Thus, we have identified two QTLs (Ckdbp1 and Ckdbp2) that are independently associated with susceptibility for the development of hypertension after subtotal nephrectomy, both originating from the 129S6 background.
A QTL for albuminuria in model of CKD
After subtotal nephrectomy, we found that 129S6 mice were much more susceptible to development of albuminuria than C57BL/6 mice, while F1 animals were relatively resistant. To explore this further, we carried out a genome-wide scan for albuminuria, expressed as A/C ratio, in the same F2 progeny. This analysis revealed only one significant QTL for albuminuria, which is located on chromosome 11. At marker D11Mit143, the LRS was 11.4. This locus overlaps Ckdbp2 and interval mapping on chromosome 11 for A/C ratio reveals a curve that is very similar to that for the blood pressure trait (Figure 6a). We next compared A/C ratios between animals of each genotype at the D11Mit143 marker on chromosome 11. As shown in Figure 6b, mice homozygous at D11Mit143 for the 129S6 allele had significantly higher A/C ratio blood pressures (306 ± 140 μg/mg) than mice that were homozygous (105 ± 69 μg/mg) or heterozygous for the C57BL/6 allele (71 ± 23 μg/mg), P = 0.02.
Figure 6 |. Interval mapping of chromosome 11 for blood pressure and albuminuria.
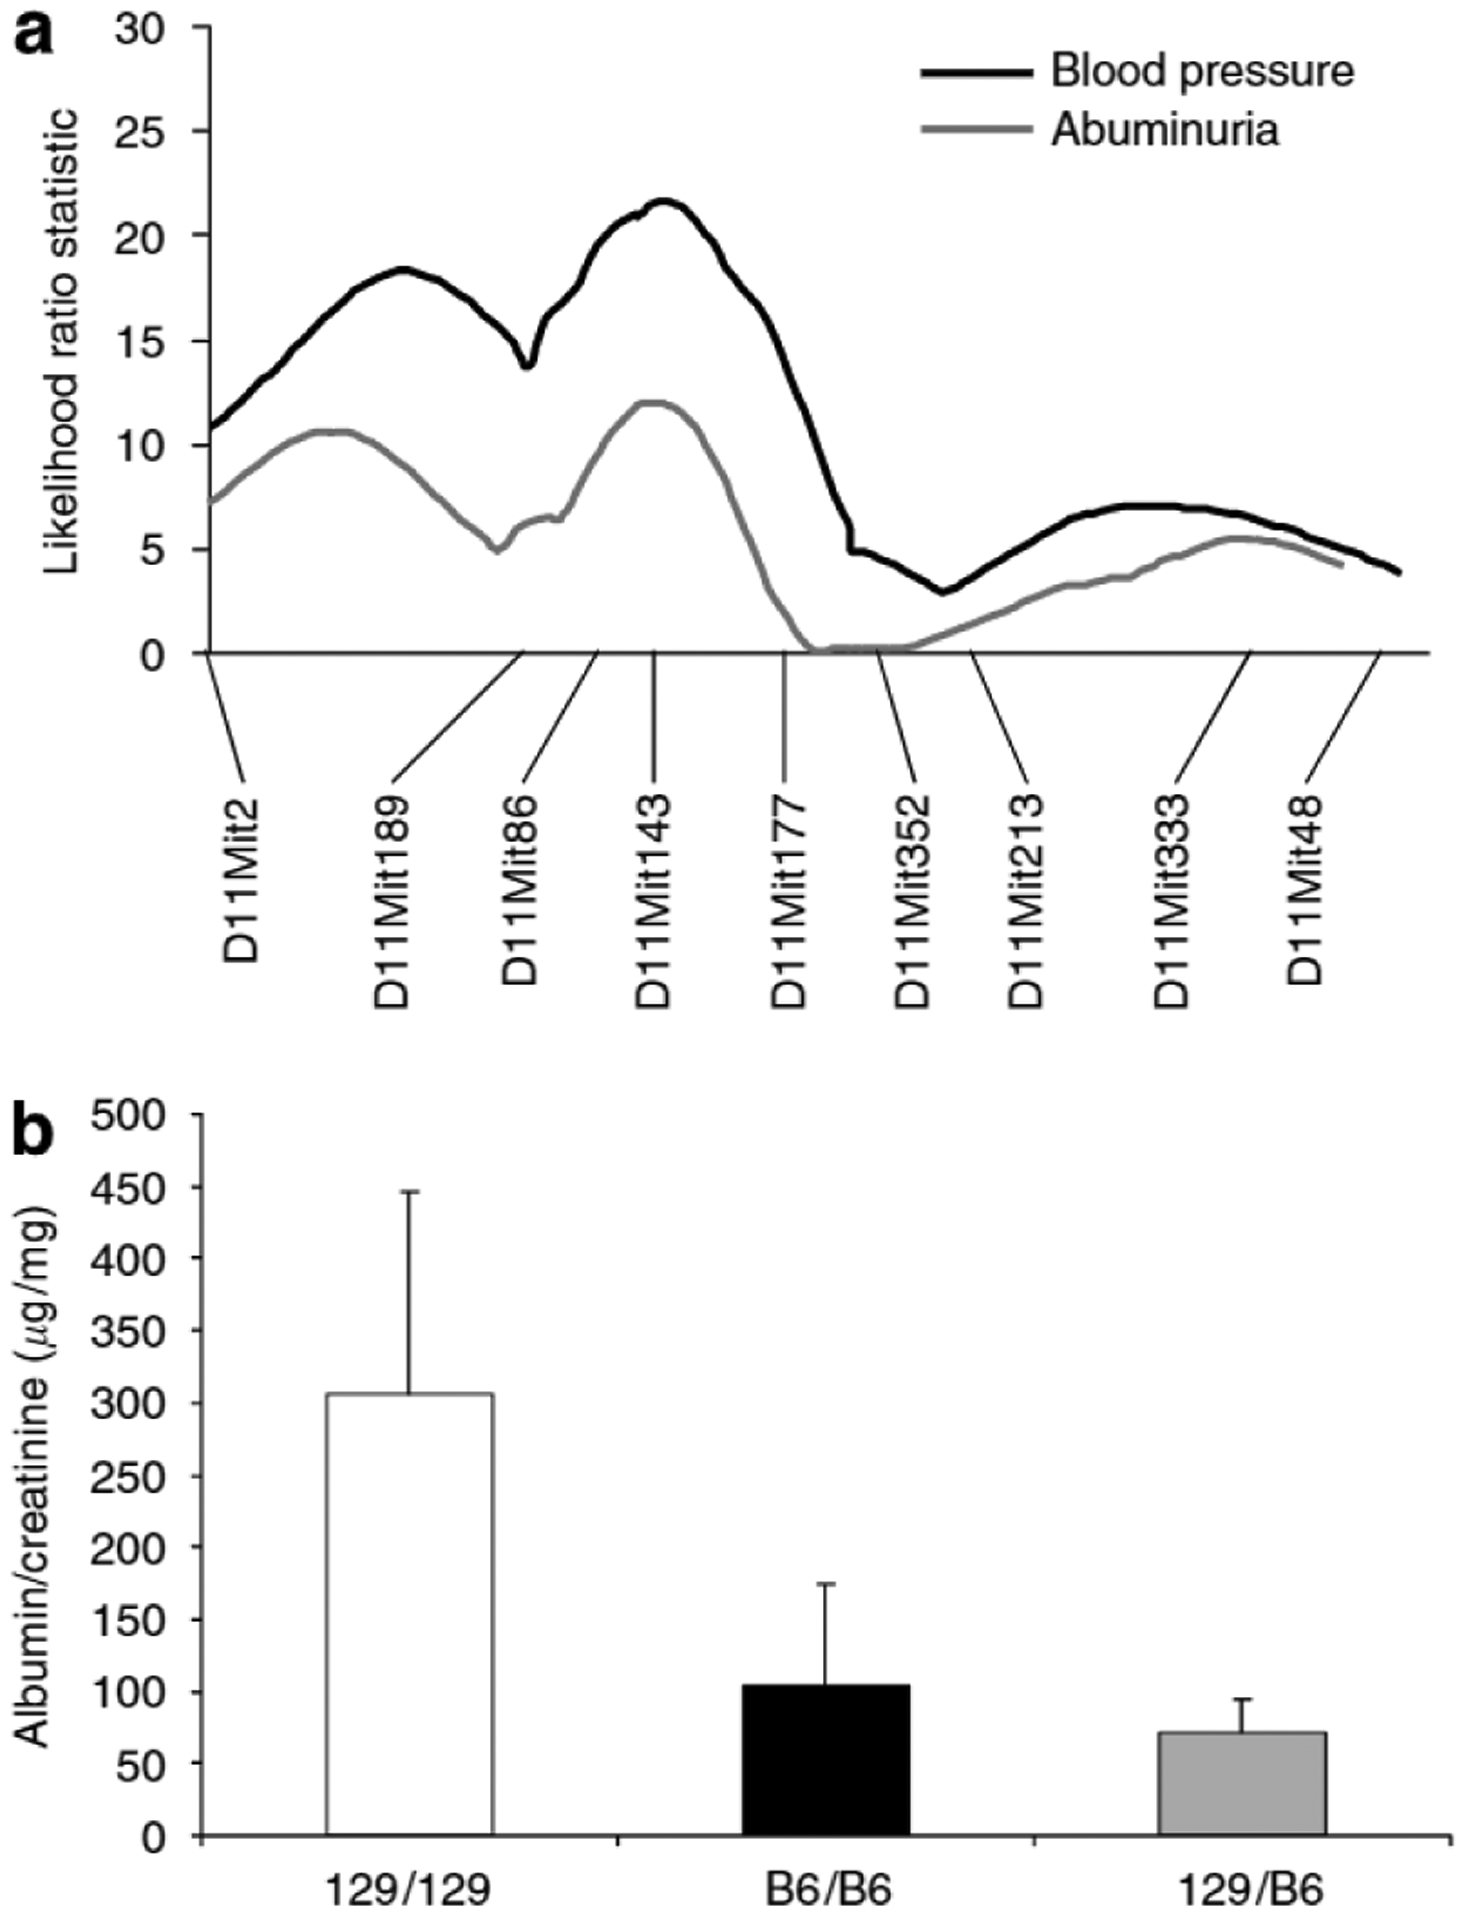
(a) Multipoint linkage analysis of microsatellite markers on chromosome 11 for blood pressure and albuminuria. Interval mapping identified a strong modifier locus for blood pressure at D11Mit143 (Ckdbp2), map distance 8cM, with an LRS of 22 (logarithm of the odds score ~4.8). Whole genome scan for albuminuria trait revealed only one significant locus, also at D11 Mit143 (LRS 11.4), with very similar interval mapping as for blood pressure, (b) A/C ratios vs genotype at D11 Mit143. Values are expressed as mean±s.d. Homozygous for 129S6 allele (129) (white bar) 306 ± 140 μg/mg, homozygous for C57BL/6 allele (black bar) (B6) 105 ± 59 μg/mg, and heterozygous (gray bar) (129/B6) 71 ± 23 μg/mg. P = 0.02, ANOVA, one-way.
Genome-wide scan for kidney injury
Using kidney pathology scores as another measure of kidney injury, we have also found a suggestive locus on chromosome 2, D2Mit285, that is associated with susceptibility to glomerulosclerosis with an LRS of 13.7. We suspect that the limited range of severity of pathological lesions in this cohort limited our ability to precisely define and confirm this QTL. We anticipate that with more animals, we will be able to find significant linkage for this trait.
Association study of Ckdbp2
Based on the genome scan, Ckdbp2 accounts for 39% of the variance in blood pressure. To verify this strong effect, we compared genotypes vs blood pressure specifically at the Ckdbp2 locus in a separate cohort of 27 F2 animals. The association of this locus to blood pressure response was significantly replicated in this second cohort. At D11Mit143, mice homozygous for the 129S6 allele had significantly higher blood pressures (152 ± 13 mm Hg) than those homozygous for the C57BL/6 allele (137 ± 9 mm Hg) (P = 0.02). Blood pressures in mice heterozygous (144 ± 8 mm Hg) were not statistically different from those homozygous for the C57BL/6 allele, P> 0.2. Taken together, the results of two separate cohorts demonstrate that Ckdbp2 has a robust effect on blood pressure response to loss of nephron mass. At Ckdbp1, there was again a trend toward higher blood pressure in mice homozygous for the 129S6 allele in this second cohort, but the association was not statistically significant. Efforts are underway to perform whole genome scan for the combined cohorts using dense single nucleotide polymorphic analysis to fine-map the blood pressure trait.
DISCUSSION
Subtotal nephrectomy in rodents is a well-established model of progressive kidney disease. In rats, this simple model recapitulates a number of features of CKD in humans including hypertension, albuminuria, and glomerular sclerosis.17,18 The model also has proven utility in identifying therapeutic approaches, such as the use of angiotensin-converting enzyme inhibitors, which were later found to be applicable to humans with CKD in numerous clinical trials.19,20 The remnant kidney model has been used in various species, including dogs, cats, rabbits, baboons, and most extensively in rats.21 Although utilization of this model in mice has been somewhat limited, previous studies suggested a variable susceptibility to renal injury between different strains of mice. For example, the C57BL/6 strain was reported to be resistant to the development of proteinuria after subtotal renal ablation.21 Moreover, in a genetic model of reduced nephron mass, C57BL/6 mice were resistant to glomerulosclerosis, whereas mice from the ROP strain developed severe glomerular scarring.24 Similarly, Fogo and co-workers22 identified robust phenotypic differences in the responses to subtotal nephrectomy between C57BL/6 and 129/Sv strains. In the current study, we also found that 129S6 mice develop marked hypertension, proteinuria, and glomerulosclerosis after subtotal nephrectomy, whereas C57BL/6 mice are relatively resistant to renal injury, developing only moderate increases in blood pressure and albumin excretion. Furthermore, with subtotal nephrectomy, F1 mice have only modest increases in blood pressure, similar to the C57BL/6 line, and are significantly more resistant to the development of albuminuria and renal pathology than either of the parental strains.
Traditional QTL mapping relies on genetic ‘outliers’ that operate within the normal physiologic range, and typically relies on very large numbers of animals. Using our model, a surgical sensitizer to mimic the clinical pathological process of CKD, we are pushing the phenotype into the pathologic range and we are mapping only those genetic factors that strongly influence or modify the outcome. In this light, the genetic factor(s) being investigated are acting similarly to modifier loci, such as those that modify the phenotype in a knockout or transgenic mouse. In our case, we have employed a surgical rather than genetic sensitizer to create CKD, but the principle remains the same. Using this approach, we have identified two QTLs for hypertension. One of these, Ckdbp1, is located on chromosome 1 between positions 43 and 73 cM. Previous studies have identified blood pressure QTLs on mouse chromosome l.25–27 Our locus, Ckdbp1, is centered at 62.1 cM and appears to lie between these two previously independently identified QTLs.25–27
The QTL Ckdbp2 has robust effects on blood pressure, as demonstrated by reproducible results in our association study in an independent cohort of F2 mice. It is located in an 8cM region defined by markers D11Mit86 (28 cM, 53.8 Mb) and D11Mit177 (36 cM, 64.8 Mb). This region overlaps a previously reported blood pressure QTL, Abbp4, on mouse chromosome 11 that conferred a 7–12 mm Hg increase in blood pressure in a genome-wide screen for blood pressure QTLs between two distinct and unmanipulated inbred strains.26 Comparative mapping28 demonstrates that the distal segment of mouse chromosome 11 is syntenic with the distal segment of rat chromosome 10 where multiple blood pressure QTLs have been reported in several independent studies. This distal segment is also syntenic with the mid-segment of human chromosome 17 where genetic susceptibility for essential hypertension, HYT1, in humans has also been reported.29,30 Of note, WNK4, mutations of which cause pseudohypoaldosteronism type II and hypertension in humans, lies within this region.31 Although our candidate region is slightly above the syntenic region across the three species, its location just above the blood pressure QTL region on human chromosome 17 and its proximity to the conserved syntenic region for blood pressure QTLs in human and rat suggest some overlap with previously identified hypertension QTLs. Moreover, this is the first documented linkage of this region in hypertension associated with CKD. Interestingly, this locus is immediately adjacent to the locus on chromosome 11 that is associated with compensatory renal hypertrophy in mice after unilateral nephrectomy.32
Although the absolute ranges for blood pressure from the two distinct cohorts are slightly different, the difference in allelic effects on blood pressure at Ckdbp2 in both cohorts is the same at 15 mm Hg. This magnitude of difference is almost identical to the difference between the parental strains (16 mm Hg). The variation in the absolute blood pressure ranges in the cohorts and the parental and F1 strains likely reflects seasonal variations in blood pressures that are commonly observed in mice, as these cohorts and the parental strains were studied at different time points. It is also possible that this reflects the complexity of gene interactions.
As there are potential confounding effects of sex steroid hormones, we determined whether sex may influence blood pressure in our F2 cohorts. We examined the cohorts separately and together, and found that systolic blood pressures were only 3–5 mm Hg higher in males vs females after subtotal nephrectomy, but this was not statistically significant (P>0.3). Furthermore, there was no apparent impact of sex at the Ckdbp2 locus when the groups were analyzed based on sex and genotypes.
Our genome-wide scan for albuminuria, expressed as A/C ratio, reveals the same locus found for Ckdbp2, with very similar interval mapping curve. This is the first documented linkage on mouse chromosome 11 for albuminuria. In humans and in other models, albuminuria can be associated with and secondary to increased blood pressure. In our F2 cohort, there was a significant positive correlation between A/C ratio and blood pressure, R2 = 53.2%, P< 0.0005, suggesting a causal association. Our studies are consistent with previous work, suggesting that the 129 strain may be more susceptible to the development of kidney injury after partial renal ablation.22 This susceptibility may also extend to other models of kidney disease. Our finding of a common QTL derived from the 129S6 background that is associated with blood pressure and albuminuria suggests that the susceptibility to renal injury on the 129S6 background may be driven by a propensity to develop hypertension after loss of nephron mass.
On the other hand, our genome-wide scan for pathologically defined kidney injury revealed a suggestive locus on chromosome 2 (LRS of 13.7) that is associated with glomerulosclerosis. This locus is clearly distinct from either of the blood pressure QTLs, suggesting that there may be genetic components determining susceptibility to kidney injury that are distinct from hypertension. However, the limited range of severity of pathological lesions in this cohort limited our ability to precisely define and confirm this QTL. A larger cohort and more robust scoring system that allows a wider range of scores may enable a greater likelihood of obtaining association with chromosomal regions. Alternatively, haplotype analysis using the extremes of one to two standard deviations as ‘affected’ vs ‘unaffected’ may also be of potential value.
In summary, the study we report represents a novel approach to the use of a mouse model of CKD to find modifier genes and their role in the progression of kidney disease and its systemic consequences. Defining the genetic variants that confer susceptibility to CKD and its cardiovascular effects will at the very least identify potential mechanisms to explain the detrimental effects of CKD on cardiovascular risks. They also provide the potential opportunity to identify candidate genes that affect the severity and progression of CKD in humans.
MATERIALS AND METHODS
Strain comparison and generation of intercrosses
To examine systematically the effects of genetic background in a model of CKD, we compared blood pressure, albuminuria, and kidney injury scores in male and female wild-type 129S6 (Taconic) and C57BL/6 (Jackson Laboratory, Bar Harbor, ME, USA) mice subjected to subtotal nephrectomy. To define the inheritance pattern of genetic modifiers of CKD, F1 (129S6 × C57BL/6) mice were generated by mating male 129S6 and female C57BL/6 mice. Genomic screen was performed using F2 mice generated from the F1 (129S6 male × C57BL/6 female) intercrosses. Animals were bred and maintained in the animal facility of the Durham Veterans Affairs Medical Center under local and National Institutes of Health guidelines.
Renal ablation
All mice were subjected to subtotal nephrectomy at 8 weeks of age. Under general anesthesia with 1.5% isoflurane, the right kidney was removed, and the blood supply to the upper half of the left kidney was interrupted by ligation of the upper branch of the two main branches of the left renal artery. The extent of renal infarction is confirmed by visual inspection to ensure a uniform extent of kidney injury in all mice. The uniformity of our surgical technique was also assessed by determination of the percent atrophic area of the remnant kidney by our pathologist who was masked to the experimental conditions and crosses. Virtually all of the remnant kidneys had an atrophic area ranging from 5 to 10% of the kidney, with very few outliers of 15%. This suggests the lack of variability in our model, and a good degree of reproducibility of the area of infarction by our surgical technique. Mice are allowed to recover for 3 weeks after renal ablation before any training or phenotyping.
Phenotyping methods
From week 4 through 6 after subtotal nephrectomy, mice were trained daily for blood pressure measurement using a computerized tail-cuff system (Hatteras Instruments) as described previously.33,34 From week 7 through 10, systolic blood pressures were recorded at least 5 days a week, 10–20 measurements each day. Training and measurements were performed by the same operator at the same time each day.
At week 12, mice were placed in metabolic cages35 and urine was collected for 24 h and stored at −80°C for later analysis. Urinary albumin and creatinine concentrations were determined using Exocell assays according to the manufacturer’s instructions (Exocell Inc., Philadelphia, PA, USA). Albuminuria is expressed as A/C (μg/mg) ratio as described previously.36
At week 13, mice were killed and the remnant kidneys were removed and fixed with buffered formalin, embedded in paraffin, sectioned, and stained with hematoxylin and eosin, and Masson’s Trichrome (for collagen deposition). The slides were read and interpreted by a renal immunopathologist without prior knowledge of the treatment modality, the specific strain, or crosses. Renal pathology was graded by standard methods for several morphological features, including glomerular inflammation, proliferation, sclerosis (segmental or global), and mesangial changes. Interstitial and vascular changes were also noted. Scores from 0 to 3 were assigned for each of the features (e.g., glomerular inflammation was graded as follows: 0, normal; 1, few inflammatory cells; 2, moderate inflammation; and 3, severe inflammation), and then added together to yield a final renal score. Scores for inflammation were graded on the basis of both intensity and pattern of distribution (e.g., focal, diffuse).
Data analysis
The values for each parameter within a group are expressed as means±s.d. For comparisons between two groups, statistical significance was assessed using an unpaired t-test. For comparisons among three groups, ANOVA with Tukey’s multiple comparisons tests was used to test for statistical significance.
Genome-wide scan and mapping
F2 mice were screened using 96 microsatellite markers (Applied Biosystems, Foster City, CA, USA) spaced at approximately 15–20cM intervals throughout the 19 mouse autosomes as we have described previously.37 Genetic distances were obtained from public databases. Genotyping errors were assessed by evaluation for adherence to Mendelian inheritance and for the presence of unlikely double recombinant events or crossovers.
Linkage and QTL analyses were performed using Map Manager QTXb20 software.38 For a quantitative trait, single locus association tests39 were performed between each marker and the phenotype to identify regions of interest. Simple interval mapping was performed at 1-cM intervals. Permutation tests were performed on our data at 1-cM intervals for 10 000 permutations to establish linkage thresholds. Suggestive (P = 0.63), significant (P = 0.05), and highly significant (P = 0.001) were established using guidelines suggested by Lander and Kruglyak,40 and correspond to the 37th, 95th, and 99.95th percentiles, respectively. LRS value can be divided by 4.6 to obtain the equivalent logarithm of the odds score.
ACKNOWLEDGMENTS
We thank Dr Thomas Coffman for active discussion and critical review of the paper. This work was supported by the National Institutes of Health Grants 5R01DK075035 and 5R01HL69230.
Footnotes
DISCLOSURE
The authors have no interests to disclose.
REFERENCES
- 1.National Kidney. FK/DOQI clinical practice guidelines for chronic kidney disease: evaluation classification, stratification. Am J Kidney Dis 2002; 39: S1–S266. [PubMed] [Google Scholar]
- 2.Coresh J, Astor BC, Greene T et al. Prevalence of chronic kidney disease and decreased kidney function in the adult US population: Third National Health and Nutrition Examination Survey. Am J Kidney Dis 2003; 41: 1–12. [DOI] [PubMed] [Google Scholar]
- 3.Foley RN, Parfrey PS, Sarnak MJ. Clinical epidemiology of cardiovascular disease in chronic renal disease. Am J Kidney Dis 1998; 32: S112–S119. [DOI] [PubMed] [Google Scholar]
- 4.Levin A, Singer J, Thompson CR et al. Prevalent left ventricular hypertrophy in the predialysis population: identifying opportunities for intervention. Am J Kidney Dis 1996; 27: 347–354. [DOI] [PubMed] [Google Scholar]
- 5.Foley RN, Parfrey PS, Harnett JD et al. Clinical and echocardiographic disease in patients starting end-stage renal disease therapy. Kidney Int 1995; 47: 186–192. [DOI] [PubMed] [Google Scholar]
- 6.Anonymous. Controlling the epidemic of cardiovascular disease in chronic renal disease: what do we know? What do we need to know? Where do we go from here? Special report from the National Kidney Foundation Task Force on Cardiovascular Disease. Am J Kidney Dis 1998; 32: S1–S1 99. [PubMed] [Google Scholar]
- 7.Cheung AK, Sarnak MJ, Yan G et al. Atherosclerotic cardiovascular disease risks in chronic hemodialysis patients. Kidney Int 2000; 58: 353–362. [DOI] [PubMed] [Google Scholar]
- 8.Sarnak MJ, Levey AS. Cardiovascular disease and chronic renal disease: a new paradigm. Am J Kidney Dis 2000; 35: S117–S131. [DOI] [PubMed] [Google Scholar]
- 9.Carter JS, Pugh JA, Monterrosa A. Non-insulin-dependent diabetes mellitus in minorities in the United States, [see comment]. Anna Intern Med 1996; 125: 221–232. [DOI] [PubMed] [Google Scholar]
- 10.Karter AJ, Ferrara A, Liu JY et al. Ethnic disparities in diabetc complications in an insured population [erratum appears in JAMA 2002 Jul 3; 288:46]. JAMA 2002; 287: 2519–2527. [DOI] [PubMed] [Google Scholar]
- 11.Lei HH, Perneger TV, Klag MJ et al. Familial aggregation of renal disease in a population-based case-control study. J Am Soc Nephrol 1998; 9: 1270–1276. [DOI] [PubMed] [Google Scholar]
- 12.Iyengar SK, Fox KA, Schachere M et al. Linkage analysis of candidate loci for end-stage renal disease due to diabetic nephropathy. J Am Soc Nephrol 2003; 14: S195–S201. [DOI] [PubMed] [Google Scholar]
- 13.Bl Freedman, Soucie JM, McClellan WM. Family history of end-stage renal disease among incident dialysis patients. J Am Soc Nephrol 1997; 8: 1942–1945. [DOI] [PubMed] [Google Scholar]
- 14.Bl Freedman, Tuttle AB, Spray BJ. Familial predisposition to nephropathy in African-Americans with non-insulin-dependent diabetes mellitus. Am J Kidney Dis 1995; 25: 710–713. [DOI] [PubMed] [Google Scholar]
- 15.Bowden DW. Genetics of kidney disease. Kidney Int Suppl 2003; 83: S8–S12. [DOI] [PubMed] [Google Scholar]
- 16.The Family Investigation of N& Diabetes Research GGenetic determinants of diabetic nephropathy. The family investigation of nephropathy diabetes (FIND). J Am Soc Nephrol 2003; 14. [DOI] [PubMed] [Google Scholar]
- 17.Anderson S, Brenner BM. Intraglomerular hypertension: implications and drug treatment. Annu Rev Med 1988; 39: 243–253. [DOI] [PubMed] [Google Scholar]
- 18.Waldherr R, Gretz N. Natural course of the development of histological lesions after 5/6 nephrectomy. Contrib Nephrol 1988; 60: 64–72. [DOI] [PubMed] [Google Scholar]
- 19.Jafar TH, Schmid CH, Landa M et al. Angiotensin-converting enzyme inhibitors and progression of nondiabetic renal disease. A meta-analysis of patient-level data. Ann Intern Med 2001; 135: 73–87. [DOI] [PubMed] [Google Scholar]
- 20.Kshirsagar AV, Joy MS, Hogan SL et al. Effect of ACE inhibitors in diabetic and nondiabetic chronic renal disease: a systematic overview of randomized placebo-controlled trials. Am J Kidney Dis 2000; 35: 695–707. [DOI] [PubMed] [Google Scholar]
- 21.Kren S, Hostetter TH. The course of the remnant kidney model in mice. Kidney Int 1999; 56: 333–337. [DOI] [PubMed] [Google Scholar]
- 22.Ma LJ, Fogo AB. Model of robust induction of glomerulosclerosis in mice: importance of genetic background. Kidney Int 2003; 64: 350–355. [DOI] [PubMed] [Google Scholar]
- 23.Gurley SB, Clare SE, Snow KP et al. Impact of genetic background on nephropathy in diabetic mice. Am J Physiol Renal Physiol 2006; 290: F214–F222. [DOI] [PubMed] [Google Scholar]
- 24.He C, Esposito C, Phillips C et al. Dissociation of glomerular hypertrophy, cell proliferation, and glomerulosclerosis in mouse strains heterozygous for a mutation (Os) which induces a 50% reduction in nephron number. J Clin Investig 1996; 97: 1242–1249. [DOI] [PMC free article] [PubMed] [Google Scholar]
- 25.Sugiyama F, Churchill GA, Higgins DC et al. Concordance of murine quantitative trait loci for salt-induced hypertension with rat and human loci. Genomics 2001; 71: 70–77. [DOI] [PubMed] [Google Scholar]
- 26.Woo DD, Kurtz I. Mapping blood pressure loci in (A/J × B6)F2 mice. Physiol Genom 2003; 15: 236–242. [DOI] [PubMed] [Google Scholar]
- 27.DiPetrillo K, Tsaih SW, Sheehan S et al. Genetic analysis of blood pressure in C3H/HeJ and SWR/J mice. Physiol Genom 2004; 17: 215–220. [DOI] [PubMed] [Google Scholar]
- 28.Zimdahl H, Kreitler T, Gosele C et al. Conserved synteny in rat and mouse for a blood pressure QTL on human chromosome 17. Hypertension 2002; 39: 1050–1052. [DOI] [PubMed] [Google Scholar]
- 29.Baima J, Nicolaou M, Schwartz F et al. Evidence for linkage between essential hypertension and a putative locus on human chromosome 17. Hypertension 1999; 34: 4–7. [DOI] [PubMed] [Google Scholar]
- 30.Julier C, Delepine M, Keavney B et al. Genetic susceptibility for human familial essential hypertension in a region of homology with blood pressure linkage on rat chromosome 10. Hum Mol Genet 1997; 6: 2077–2085. [DOI] [PubMed] [Google Scholar]
- 31.Wilson FH, Disse-Nicodeme S, Choate KA et al. Human hypertension caused by mutations in WNK kinases, [see comment]. Science 2001; 293: 1107–1112. [DOI] [PubMed] [Google Scholar]
- 32.Zidek V, Musilova A, Vorlieek J et al. Quantitative trait loci for compensatory renal hypertrophy in the mouse. Biochem Biophys Res Commun 1998; 248: 473–475. [DOI] [PubMed] [Google Scholar]
- 33.Krege J, Hodgin J, Hagaman J, Smithies O. A computerized system for measuring blood pressure in mice. Hypertension 1995; 25: 1111–1115. [DOI] [PubMed] [Google Scholar]
- 34.Le TH, Kim HS, Allen AM et al. Physiological impact of increased expression of the AT1 angiotensin receptor. Hypertension 2003; 42: 507–514. [DOI] [PubMed] [Google Scholar]
- 35.Crowley SD, Gurley SB, Oliverio Ml et al. Distinct roles for the kidney and systemic tissues in blood pressure regulation by the renin-angiotensin system. J Clin Invest 2005; 115: 1092–1099. [DOI] [PMC free article] [PubMed] [Google Scholar]
- 36.Francois H, Athirakul K, Mao L et al. Role for thromboxane receptors in angiotensin-ll-induced hypertension. Hypertension 2004; 43: 364–369. [DOI] [PubMed] [Google Scholar]
- 37.Le TH, Fogo AB, Salzler HR et al. Modifier locus on mouse chromosome 3 for renal vascular pathology in AT1A receptor-deficiency. Hypertension 2004; 43: 445–451. [DOI] [PubMed] [Google Scholar]
- 38.Meer JM, Cudmore RH Jr, Manly KF. Map Manager QTXb20. Roswell Park Cancer Institute, Buffalo, New York. [Google Scholar]
- 39.Haley CS, Knott SA. A simple regression method for mapping quantitative trait loci in line crosses using flanking markers. Heredity 1992; 69: 315–374. [DOI] [PubMed] [Google Scholar]
- 40.Lander E, Kruglyak L. Genetic dissection of complex traits: guidelines for interpreting and reporting linkage results, [see comment]. Nat Genet 1995; 11: 241–247. [DOI] [PubMed] [Google Scholar]