Abstract
Here, we describe the synthesis, characterization and in vitro and in vivo performance of a series of tantalum oxide (TaOx) based nanoparticles (NPs) for computed tomography (CT). Five distinct versions of 9–12 nm diameter silane coated TaOx nanocrystals (NCs) were fabricated by a sol-gel method with varying degrees of hydrophilicity and with or without fluorescence, with the highest reported Ta content to date (78%). Highly hydrophilic NCs were left bare and were evaluated in vivo in mice for micro-CT of full body vasculature, where following intravenous injection, TaOx NCs demonstrate high vascular CT contrast, circulation in blood for ~ 3 h, and eventual accumulation in RES organs; and following injection locally in the mammary gland, where the full ductal tree structure can be clearly delineated. Partially hydrophilic NCs were encapsulated within mesoporous silica nanoparticles (MSNPs; TaOx@MSNPs) and hydrophobic NCs were encapsulated within poly(lactic-co-glycolic acid) (PLGA; TaOx@PLGA) NPs, serving as potential CT-imagable drug delivery vehicles. Bolus intramuscular injections of TaOx@PLGA NPs and TaOx@MSNPs to mimic the accumulation of NPs at a tumor site produce high signal enhancement in mice. In vitro studies on bare NCs and formuated NPs demonstrate high cytocompatibility and low dissolution of TaOx. This work solidifies that TaOx-based NPs are versatile contrast agents for CT.
Introduction
X-ray computed tomography, or CT, has matured into an important molecular imaging tool, propelled forward by innovations in contrast agents (CAs), imaging systems, image acquisition schemes and image analysis strategies.1–3 CT CAs enable molecular imaging by attenuating X-rays at their location, giving rise to signal in CT images.4 Iodine (Z=53) is the most used element clinically, and is the imageable component in a number of FDA-approved CT CAs.5,6 CT CAs containing barium (Z=56) are also used clinically.7,8 These chemical elements have uniquely varying X-ray attenuation as a function of X-ray energy, which can be exploited for multiple molecular imaging approaches, including dual energy CT material decomposition and spectral photon counting CT.9
CT molecular imaging requires the preparation of new CAs incorporating these elements, and indeed, numerous reports have detailed experimental CT CAs incorporating silver, Ag (Z=47), gadolinium, Gd (Z=64), ytterbium, Yb (Z=70), tantalum, Ta (Z=73), platinum, Pt (Z=78), gold, Au (Z=79) and bismuth, Bi (Z=83), among others.10–16 Due to the inherent low sensitivity of CT for these contrast media, requiring 10’s millimolar for detection, these new contrast media are most often nanoparticles (NPs), enabling the efficient packaging of X-ray attenuating elements within a compact volume.
With its K edge at 67 keV, Ta has high attenuation of X-rays used in clinical CT systems today (80–140 kVp), and produces more CT contrast w/w than Au or I.17 Synthetic schemes for Ta nanocrystals (NCs), Ta2O5 and TaOx, are well described and repeatable, and analytical methodologies are straightforward.18–22 Further, multiple reports have established that Ta based nanomaterials exhibit low toxicity in biomedical milieu.23,24 Lastly, Ta is a relatively inexpensive material, an important consideration long term for commercialization.25
Generally, surface protected Ta NPs have been formulated as very small NPs for use as injectable CAs. As an example, zwitterionic, sub-10 nm Ta2O5 NPs have been prepared by the hydrolysis and condensation of a mixture of silane surface ligands on isobutyric acid stabilized Ta2O5 cores.21 These have been demonstrated as a safe and effective CT CA, with increased effectiveness versus I in clinical CT scenarios, especially in large adults.17 In a separate study, 5–10 nm Ta2O5 NPs have also been used for imaging cartilage via interactions with the charged cartilage matrix.26 The overall Ta content in all these reported NPs is ~ 30–41%.
Given the importance of CT CA molar concentration for detection, TaOx may be a better choice than Ta2O5 NPs. The mass percent of Ta in Ta2O5 is 82% while in TaOx it is between 92% (x=1) and 85% (x=2). Further, the density of Ta2O5 is 8.2–8.4 g cm−3 while for TaOx it is 10.5 g cm−3.27–29 The product of the increased mass percent and the higher density results in TaOx having 32–43% higher Ta than Ta2O5, for a given volume, depending on the value for ‘x’ in TaOx. The synthesis of TaOx NCs was pioneered by Hyeon and co-workers and involved a base-catalyzed sol-gel reaction with a tantalum (V) ethoxide precursor.19 The TaOx NP surface has a high propensity of reacting with silanes and this was used for consequent surface modification to generate hydrophilic well-dispersed NPs. This fundamental, easy to replicate, procedure has been adopted by multiple groups to design and fabricate TaOx NPs for drug delivery, imaging, and radiotherapy.30–36 However, none of these reports indicate the Ta concentration within the NP construct. A high Ta concentration is a pre-requisite to generate a robust contrast agent for CT and is essential to augment the development of CT as a molecular imaging tool.
In this work, we first synthesized a preliminary silane coated TaOx NC (NC0), which we could then chemically modify to impart different degrees of hydrophilicity and impart fluorescence. Highly hydrophilic versions of these NCs (NC1) were left bare and investigated for vascular/vessel imaging. Moderately hydrophilic versions of these NCs (NC2) and hydrophobic versions of these NCs (NC3) were encapsulated separately into two diverse, polymeric constructs; NC2 into mesoporous silica nanoparticles (MSNPs) and NC3 into poly(lactic-co-glycolic acid) (PLGA) NPs. These two NP types are promising drug delivery vehicles within which TaOx enables the opportunity for image guided drug delivery by CT. A multifarious set of in vivo micro-CT demonstrations with this diverse set of NPs establishes the versatility and utility of TaOx-based NPs and initial in vitro and in vivo toxicology assays point toward the acute non-toxic nature of these materials, encouraging the further development of TaOx-based NPs for clinical CT molecular imaging.
Experimental
General Details
Unless otherwise stated, all reagents and solvents were purchased from the respective suppliers and used as received without any further purification. The details for various chemicals and their suppliers has been provided in the Electronic Supporting Information (ESI†). We discuss the general synthetic details for the NCs and NPs in this section. The synthesis of each NC and NP type has also been comprehensively detailed in ESI†. Exhaustive characterization of all the NC and NP variants are discussed in ESI†, together with general information on the instruments used for characterization of NCs and NPs. Specific details for various in vitro and in vivo experiments are mentioned in this section.
Synthetic Procedures
TaOx NC Synthesis:
In a 250 ml, one neck round bottom flask, fitted with a septa, IGEPAL®-CO-520 [poly(oxyethylene)nonylphenyl ether), Mn 441; 23.0 g], Cyclohexane (200 mL) and Ethanol (2.5 mL), were added and the contents were stirred to obtain a clear solution. To this stirring mixture, a solution of sodium hydroxide (100 mM, 2.5 mL) was added and this micro-emulsion was sonicated in a water bath to ensure homogeneity. Next, tantalum (V) ethoxide, (Ta2O5, 0.5 mL) was added in one portion and the contents were stirred at ambient temperature for 20 minutes. On addition of Ta2O5, the otherwise clear solution gave way to slight turbidity, indicating the formation of uncoated NCs, which we refer to as NC0. At this stage of the reaction, different silane end group reactants were added to form NCs with varying degree of hydrophilicity/hydrophobicity or to append fluorescent tags to the NC surface. On exclusive addition of 2-[methoxy (polyethyleneoxy)-9–12-propyl]trimethoxysilane (PEG-Silane, 3.0 mL) followed by subsequent work up, the partially hydrophilic TaOx NC2 were isolated. At the same stage, addition of (3-aminopropyl)trimethoxy silane (APTMS, 0.028 mL) and subsequent surface modification using methoxy-poly(ethylene-glycol)-succinimidyl glutarate (m-PEG-SG-200, 50 mg) in ethanol generates the highly water soluble TaOx NC1. Altering the ratio of PEG-Silane and APTMS in favour of a higher concentration of the latter (1:6 ratio, v/v), followed by subsequent work up leads to the hydrophobic TaOx NC3. To synthesize the respective fluorescent analogues, a pre-formed FITC-APTMS linker was introduced into the reaction mixture after the addition of PEG-Silane and APTMS and the subsequent steps were carried out in dark. Addition of the fluorescent linker to the respective hydrophilic/hydrophobic reaction mixture, leads to the formation of hydrophilic FITC-TaOx NC4 and the hydrophobic FITC-TaOx NC5, respectively. Once the reaction was complete, all NC types were isolated by centrifugation as an oily pellet and purified by exhaustive dialysis in water using 12–14 kDa MWCO dialysis bags, followed by lyophilization to yield NCs as a dry powder. For specific details, refer to Section 1.2 in ESI†.
TaOx@PLGA NP Synthesis
In a 50 mL falcon tube, 4% polyvinyl alcohol (PVA, 3 mL) was taken. In a separate 15 mL falcon tube, 1.0 mL of the TaOx NC3 suspension in dichloromethane (DCM; 25 mg TaOx NC3 in 1 mL DCM) was taken and 0.5 mL poly(DL-lactic-co-glycolic acid) (or PLGA), [LG 50:50, acid terminated] stock solution in DCM (12.5 mg PLGA polymer in 0.5 mL DCM) was added dropwise to it with continuous vortex. The resulting white colored suspension was sonicated for 5 minutes with periodic vortex. This solution was next added dropwise to the 4% aqueous PVA solution (3 mL) in the 50 mL falcon tube with rigorous and continuous vortex. Once addition was complete, the resulting white suspension was tip sonicated at 40% amplitude for 20 s and then transferred to an ice bath for 10 s. This process of tip sonication, followed by rapid cooling in an ice bath was repeated six times. After the final cycle, the white suspension was added to 10 mL 4% PVA and diluted further using 10 mL ultra-pure water. The resulting reaction mixture was stirred at RT for 3 h to remove DCM, resulting in NP hardening. After 3 h, the NPs were isolated by centrifugation at 15,000 rpm for 10 min. The white NPs were cleaned again by repeated dispersion in aqueous media and centrifugation to isolate the NPs, until the supernatant was clear (3 times). Finally, the pellet was suspended in UP water and the TaOx@PLGA NPs were re-collected as a dry powder by lyophilization. For the corresponding synthesis of the fluorescent FITC-TaOx@PLGA NPs, the precursor TaOx NC3 was replaced with the hydrophobic, FITC labeled TaOx NC5 and the subsequent reaction and purification steps were carried out in dark. For specific details, please refer to Section 7 in ESI†.
TaOx@MSNP Synthesis
In a 500 mL four neck round bottom flask, fitted with three rubber septa and a screw top temperature probe, hexadecyl trimethylammonium bromide (CTAB, 800 mg) and triethanolamine (TEA, 0.5 mL) were added and water (DI, 190 mL) was added to it. To this mixture was added a previously prepared suspension of TaOx NC2 in water (200 mg in 10 mL). The flask was placed on a heating mantle and temperature of the reaction mixture was maintained at 80 °C to obtain a white colored solution with slight turbidity. After 1 h, tetraethyl orthosilicate (TEOS, 2.0 mL) was added and heating was continued for another 2 h. Next, the reaction mixture was cooled to ambient temperatures. At this stage, different silane precursors were introduced into the reaction mixture to yield different TaOx@MSNP types with distinct surface functionalities. The addition of PEG-Silane (2.0 mL) leads to formation of TaOx@MSNP-OH, while the addition of (2-Diethylphosphatoethyl)triethoxysilane (Phospha-silane, 2.0 mL) results in TaOx@MSNP-Phos. Once the silane functionality is added, the reaction contents were stirred overnight. Next, the reaction mixture was diluted to three times its volume using methyl alcohol (MeOH, 200 mL) and the MSNPs were collected via centrifugation (15,000 rpm, 10 min.) as a white colored pellet. This pellet was re-suspended in a solution of hydrochloric acid (HCl) in MeOH (10% v/v, 100 mL) and this suspension was heated at reflux for 24 h. After 24 h, the reaction mixture was concentrated to a final volume of ~ 2 mL using a rotary evaporator and diluted to ~ 10 mL using DI water. This suspension was next transferred to 12–14 kDa dialysis bags and subjected to prolonged dialysis against DI water to purify the NPs. After extensive dialysis, the contents in the dialysis bags were lyophilized to obtain the desired product.
For the synthesis of fluorescent FITC-TaOx@MSNP, an aqueous suspension of hydrophilic, FITC-labeled TaOx NC4 (200 mg in 10 mL water) was used instead of the TaOx NC2. The subsequent reaction steps were carried out in dark. For specific details and the synthesis of empty MSNPs, refer to the ESI†, Section 9.
Cell Culture
General Information
RAW 264.7 (murine macrophage cells) and HEK 293 (human embryonic kidney cells) were purchased from ATCC (Manassas, VA, USA) and grown in mono-layers using Dulbecco’s Modified Eagle’s Medium [DMEM (1X), Gibco®) supplemented with 10% (v/v) fetal bovine serum (FBS, Gibco®) and penicillin/streptomycin [100 units mL−1 and 100 μg mL−1, respectively, Anti-Anti (100-X), Antibiotic-Antimycotic, Gibco®] in a humidified atmosphere with 5% CO2 at 37 °C.
In Vitro Cell Viability Studies
Cell viability was evaluated for RAW 264.7 and HEK 293 cells incubated with TaOx NCs, TaOx@PLGA NPs and TaOx@MSNPs using 3-(4,5-dimethylthiazol-2-yl)-2,5-diphenyltetrazolium bromide assays (MTT, Sigma Aldrich). In a typical experiment, 1 × 10⁴ cells per well were cultured in 96-well plates overnight. Next, the cells were incubated with different concentrations of TaOx NCs and NPs (0, 0.0375, 0.075, 0.15, 0.30, 0.60, 1.2 and 2.4 mg of Ta mL−1) for 24 h. After the incubation period, cells were washed thrice with PBS and incubated with media containing the MTT reagent (0.5 mg mL−1) for 4 h to allow the formation of formazan crystals. Next, the solubilization reagent was added to each well and following further incubation to completely dissolve the purple crystals obtained in the earlier step, spectrophotometric absorbance from the plates was measured at 570 nm using an UV-Vis microplate reader (SpectraMax® 190, Molecular Devices).
Micro-CT Imaging
Phantom imaging:
For in vitro phantom measurements, solutions of TaOx NC1 in saline were prepared at various concentrations (0, 20, 50, 80 and 100 mM Ta). Phantom CT images were acquired on a Perkin Elmer Quantum GX micro-CT scanner operating at 90 kVp and 88 μA.
In vivo micro-CT
We used micro-CT to demonstrate the versatility of TaOx NPs in a diverse set of in vivo experiments.
Experiment #1: Imaging the vasculature.
BALB/c Mice (Charles River Laboratories, Inc.; sex, male; age, ~ 3 months; body weight, ~ 25 g) received either a single intravenous dose of TaOx NCs formulated in sterile saline (0.9% sodium chloride) at 100 mM (296 mg kg−1 TaOx particles) (n = 2) or 200 mM (592.3 mg kg−1 TaOx particles) (n = 3) TaOx NCs. Animals were serially imaged via micro-CT at 0 h (baseline), immediate post-injection, 1 h, 3 h, 24 h, and 72 h post-injection using a Perkin Elmer Quantum GX micro-CT. The following image acquisition parameters were used at each scan time point: 14 minute acquisition; 90kVp/88μA; Field of View (FOV), 72 mm; voxel resolution, 144 μm3. After 72 h, mice were euthanized and tissue sections were collected for histology and Ta analysis using ICP-OES.
Experiment #2: Imaging the ductal tree in mammary glands.
FVB mice (Charles River Laboratories, Inc.; sex, female; age, 9–10 weeks), were serially imaged using a PerkinElmer Quantum GX micro-CT scanner at different times after intraductal injection as described37 with a solution containing 60 or 100 mM Tantalum oxide nanocrystals as contrast agent. Serial micro-CT was performed with: 2 minute acquisition; 90kVp/88μA; FOV, 36 mm; voxel resolution, 72 μm3.
Experiment #3: Imaging the ‘accumulation’ of TaOx embedded NPs at a single site.
The accumulation of TaOx embedded NPs at a single site, such as in the case of tumor targeting, was mimicked by injecting concentrated NPs intramuscular as a single bolus bilaterally in the right and left leg muscle. micro-CT was performed on animals (n = 3) following injection of 27.4 mg kg−1 in saline (50 mM Ta) or 13.7 mg kg−1 in saline (25 mM Ta) TaOx@PLGA NPs and 36.8 mg kg−1 in saline (50 mM Ta) or 18.4 mg kg−1 in saline (25 mM Ta) TaOx@MSNP-Phos. Injected mice were evaluated using the same micro-CT scan parameters as in Experiment #1, at a single scan time point; immediate post-injection, micro-CT image rendering, segmentation, and analysis of whole body or individual mammary glands was performed using Caliper AnalyzeDirect©, v12.0 (Biomedical Imaging Resource, Mayo Clinic, Rochester, MN).
Results and discussion
Design, Synthesis and Characterization of TaOx NCs
Synthesis of TaOx NCs
The general synthetic approach for the various TaOx NCs is shown in Scheme 1 (Supporting Information, Schemes S1–S3, ESI†). In the first step, a surfactant promoted micro-emulsion is formed that acts as the reaction chamber for the generation of preliminary TaOx NCs (NC0). On addition of Tantalum (V) ethoxide to this micro-emulsion, a base catalyzed sol-gel reaction ensues that results in rapid formation of NC0.19
Scheme 1.
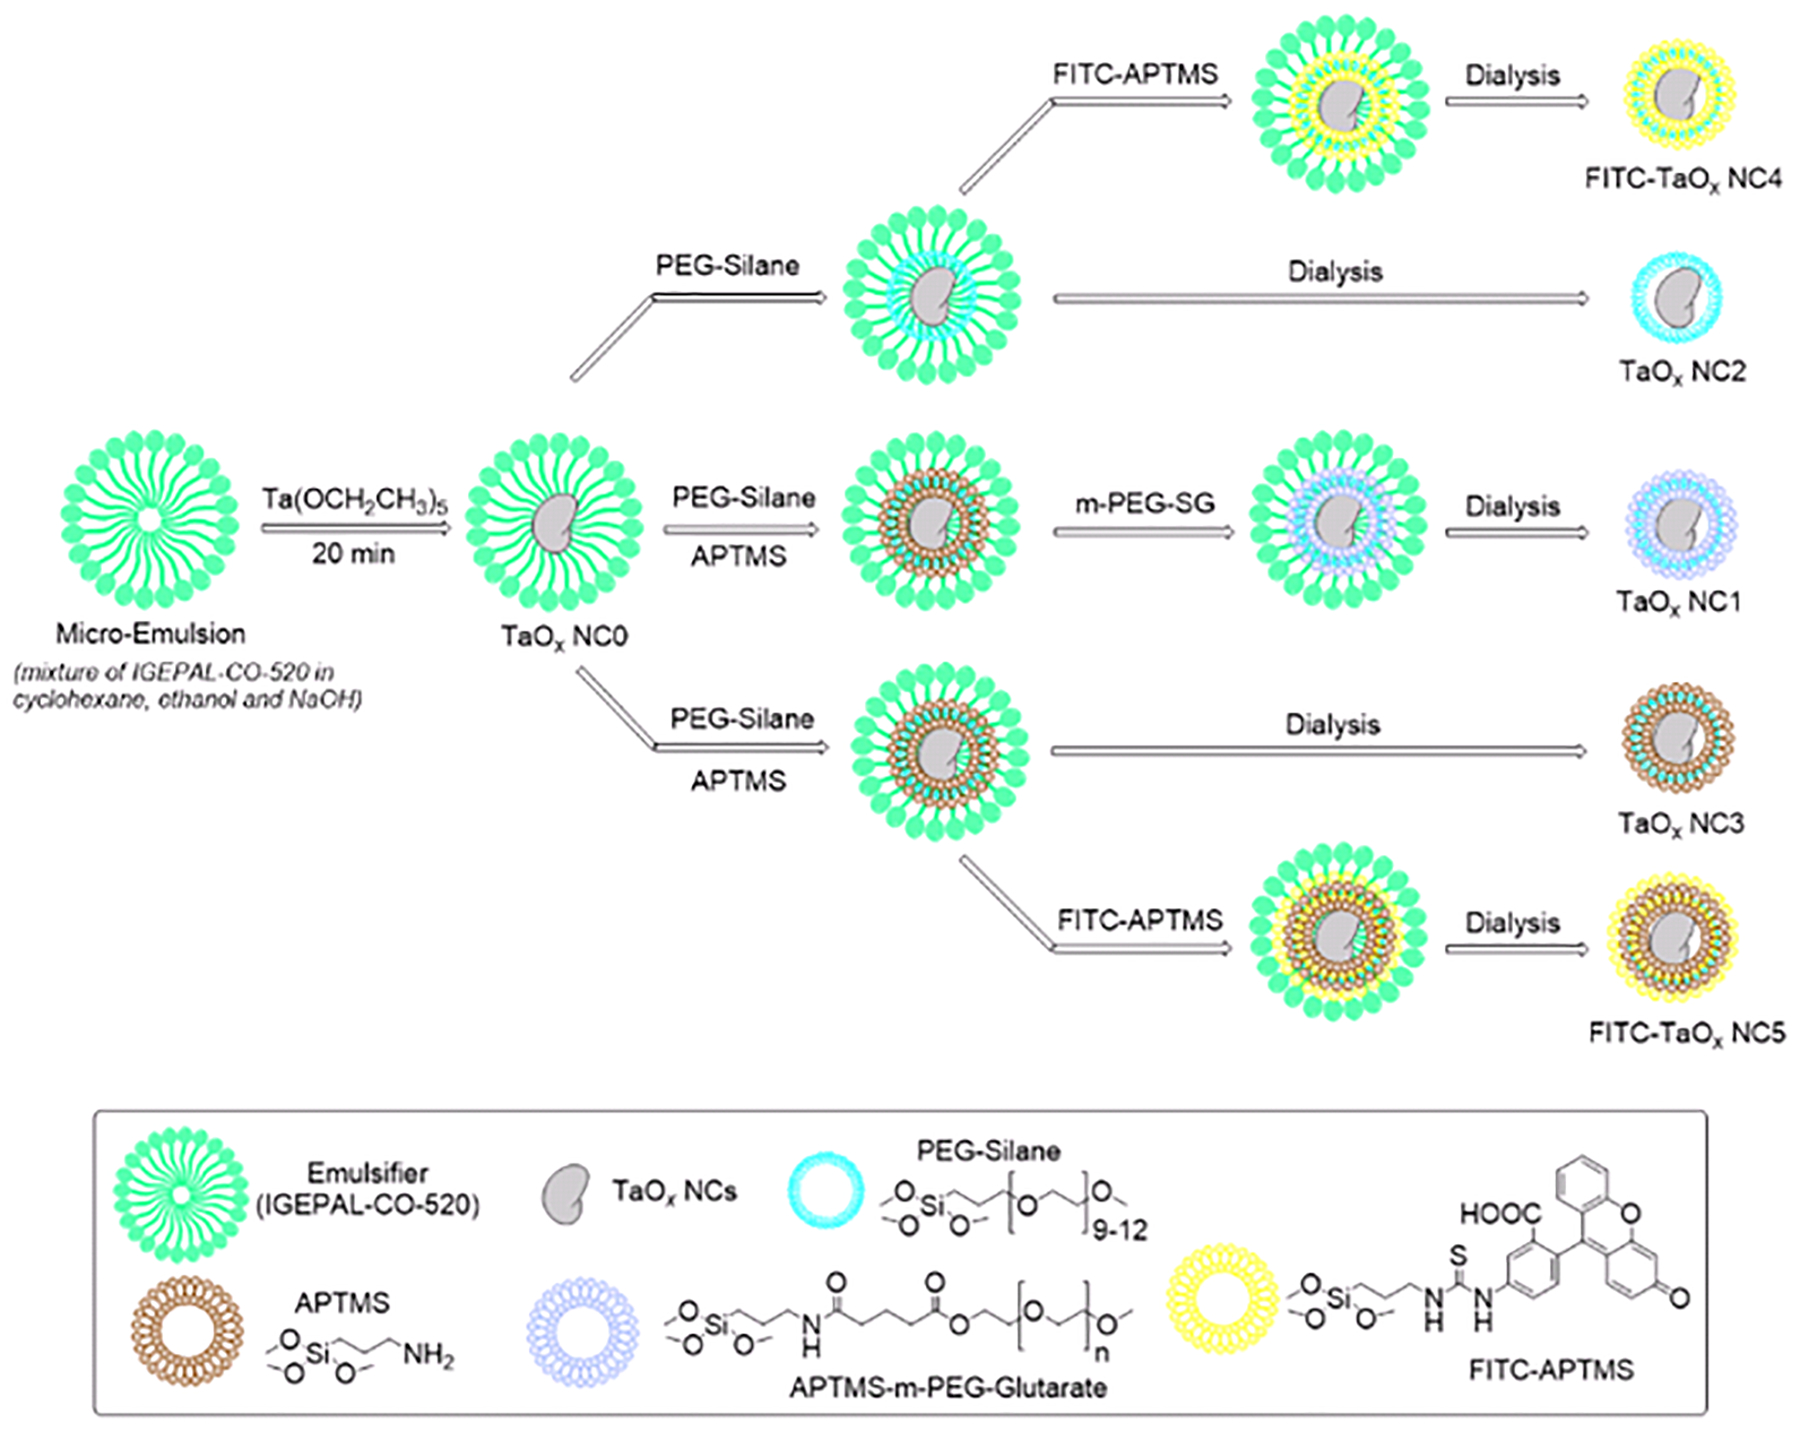
Schematic representation for the syntheses of TaOx NC formulations
The acidic (pH = 5) surface of these preliminary TaOx NCs in the reaction micro-emulsion has pendant hydroxyl groups that have a high propensity to undergo condensation reaction with silanes and henceforth, the addition of a poly(ethylene glycol) moiety with a silane end cap (PEG-Silane) results in formation of well-dispersed hydrophilic TaOx NCs. At this point of the synthesis, a mixture of different commercially available silanes could be potentially employed to engineer the hydrophilicity/hydrophobicity of the NCs.
To demonstrate this feature, we incorporated varying ratios of 3-(Aminopropyl)trimethoxy silane (APTMS) and PEG-silane to synthesize three different TaOx NC variants; a highly water soluble TaOx (NC1), a partially hydrophilic TaOx (NC2) and a hydrophobic TaOx (NC3). Similarly, a pre-formed cocktail of silane appended fluorescent tags could also be potentially introduced during this step to generate labeled TaOx NCs (Schemes S4–S5, ESI†). To this end, by addition of a pre-formed FITC-APTMS-PEG linker during the surface modification step, both hydrophilic FITC-TaOx (NC4) and hydrophobic FITC-TaOx (NC5) were also synthesized. For each of the TaOx NC types, the purification steps involved isolation of the NCs as a sticky oil via centrifugation, followed by dialysis against DI water and lyophilization to generate the product as a dry powder (Section 1.2, ESI†). In the absence of any surface modifying silane moiety, the resulting TaOx NCs are clumped together in an agglomerated mass (Figure S1, ESI†) leading to an increase in overall size. Further, the exclusive addition of only APTMS did not result in well dispersed NCs (Figure S2, ESI†) and a small amount of PEG-Silane was required to avoid clumping. This suggested that surface protection of bare TaOx NCs using repeating PEG units is essential to prevent irreversible agglomeration of NCs, which could lead to compromised cell internalization, non-specific biodistribution and increased toxicity.38,39 Further, the prolonged circulation of NP CT CAs is a desirable characteristic for effective CT imaging and PEG coating on the surface of TaOx NCs can act as an antifouling agent thereby enhancing the blood circulation time.40,41
Characterization of TaOx NCs
Table 1 lists the detailed characterization of the different TaOx NC types. Transmission electron microscopy (TEM) of hydrophilic NC1 (Figure 1a, b; Figure S3, ESI†) and partially hydrophilic NC2 (Figure 1c, d; Figure S8, ESI†) dispersed in water, and hydrophobic NC3 (Figure 1e, f; Figure S13, ESI†) dispersed in hexane, confirmed uniform and well-dispersed TaOx NCs with a narrow size distribution ~ 9–12 nm diameter. The hydrodynamic size (particle diameter) of NC1 and NC2 dispersed in water were ~ 12–18 nm (Table 1), as measured by dynamic light scattering (DLS). The marginal increase in diameter in aqueous media can be explained by the formation of a hydration sphere around the NCs as is routinely observed among various NP formulations.42 DLS measured negative zeta potentials for NC1 and NC2 (Table 1), which can be attributed to the hydroxyl, alkoxy and carboxylate surface groups. X-ray diffraction (XRD) experiments showed the amorphous nature of the NCs (NC1, Figure S4; NC2, Figure S9 and NC3, Figure S14, ESI†). The presence of Ta and its electronic state, as well as the presence of Si, was confirmed using energy dispersive spectroscopy (EDS) and X-ray photoelectron spectroscopy (XPS). The EDS spectra for all TaOx NC variants show clear peaks for Ta and Si confirming the presence of these elements (NC1, Figure S5, ESI†; NC2, Figure S10, ESI†; NC3, Figure S15, ESI†). Further confirmation of the electronic state of the TaOx NCs (x ≈ 1) was ascertained from XPS spectra as shown in the (NC1, Figure S6; NC2, Figure S11 and NC3, Figure S16, ESI†). The XPS peaks near 26 and 24, corresponding to Ta 4f7/2 and Ta 4f5/2 respectively, were similar to those reported for TaO.43 The presence of silane, PEG and various other surface functionalities was confirmed by Fourier transform infrared spectroscopy (FTIR) characterization (NC1, Figure S7; NC2, Figure S12 and NC3, Figure S17, ESI†), with specific details about important peaks discussed in the SI. Importantly, the Ta content for all the NCs was found to be 54–78% using inductively coupled plasma-optical emission spectroscopy (ICP-OES), which is the highest among all reported TaOx NPs to date (Table 1). A protocol for complete digestion of the NCs using a mixture of hydrofluoric acid (HF) and nitric acid (HNO3) and consequent estimation of Ta content using a Varian ICP-OES system was developed (further details in ESI†, Section 3.1). Of note, to the best of our knowledge, exact Ta content of previously described TaOx NPs have not been reported. The Ta content within multiple Ta2O5 NPs have been reported and varies between 30–41%, which is almost half of that reported in the current work.18,21 With an optimal Ta content, the TaOx NCs described in this work possess a highly X-ray dense core and address an essential pre-requisite of a pre-amplified CT CA. NC4 and NC5; are fluorescent versions of NC2 and NC3 with FITC-labeled surface, respectively, with XRD showing that these NCs were amorphous (NC4, Figure S19 and NC5, Figure S25, ESI†); TEM showing near identical diameter (NC4; Figure 1g, h and Figure S18 and NC5; Figure 1i, j and Figure S24), EDS confirming the presence of Ta and Si (NC4; Figure S20, ESI†; NC5; Figure S26, ESI†) and XPS confirming the electronic state of Ta (NC4; Figure S21 and NC5; Figure S27, ESI†) and (x ≈ 1). Further characterization using FTIR (NC4; Figure S22, S23 and NC5; Figure S28, S29, ESI†) confirm FITC-conjugation and the presence of various surface functionalities. Fluorescence spectra of FITC-labeled NC4 and NC5 suspended in PBS were in close agreement to that of free FITC (Figure S30, ESI†).
Table 1.
Characterization of various TaOx NCs.
| TaOx NC type | Ta (%)a | Diameterb, c (nm) | PDIb | Zeta Potentialb (mV) |
|---|---|---|---|---|
| NC1 | 73 | (11.1 ± 0.7)b | 0.12 ± 0.05 | −12.1 ± 1.3 |
| NC2 | 78 | (12.9 ± 0.8)b | 0.17 ± 0.01 | −29.4 ± 5.9 |
| NC3 | 69 | (10.1 ± 0.4)c | n/a | n/a |
| NC4 | 61 | (17.2 ± 2.1)b | 0.14 ± 0.04 | −39.9 ± 3.1 |
| NC5 | 56 | (11.2 ± 1.8)c | n/a | n/a |
Ta content reported using ICP-OES;
Diameter, PDI and Zeta potential reported using DLS;
Diameter reported using TEM images analysed by Image J software.
Figure 1.
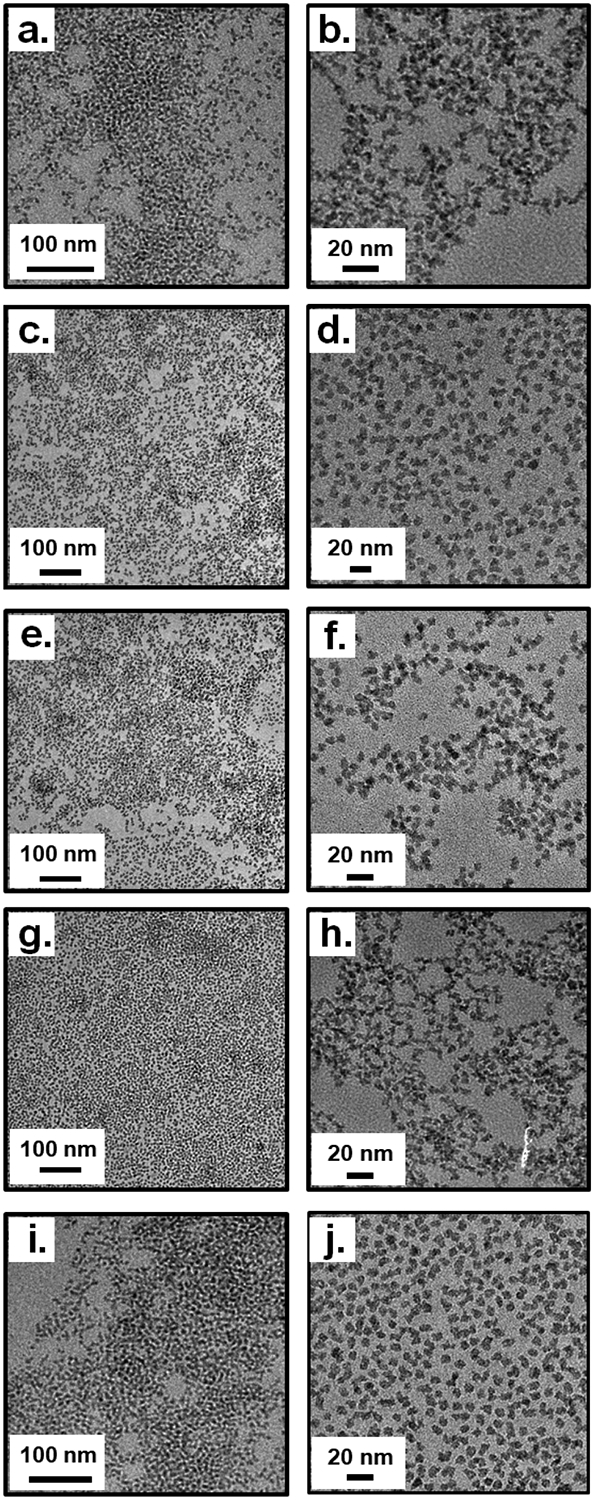
TEM characterization for a-b.) TaOx NC1; c-d) TaOx NC2; e-f) TaOx NC3; g-h) TaOx NC4; i-j) TaOx NC5.
Dissolution of TaOx NCs under lysosomal conditions
A primary concern regarding the clinical translation of NPs is the potential toxicity resultant from their dissolution in cells within lysosomes, exposing cells to metal ions.44,45 As injected or endocytosed NPs follow an intracellular transport pathway through endosomes to lysosomes, conditions such as low pH and presence of ligating anions such as citrates are typically encountered. In order to evaluate the stability of the NCs against dissolution under such conditions, an in vitro dissolution study was carried out in phosphate buffered saline (PBS, pH 7.4) and sodium citrate (NaCit, pH 5.5) at 37 °C for a period of 4 weeks. Incubation in PBS mimics the cytosolic and extracellular pH; while NaCit, pH 5.5 mimics the post endocytosis lysosome environment. The experimental details for this study are described in Section 3.2 of the ESI†. Briefly, TaOx NC3 and TaOx NC5 were suspended in 1 mL each of PBS and NaCit at 37 °C, and aliquots were withdrawn at regular time points for the entire period of the study (infinite sink conditions), analysed for Ta content using ICP-OES and normalized to obtain cumulative Ta release. The Ta release is plotted in Figure 2 (Figure S30, ESI†) and shows low Ta dissolution for both the NC variants (< 4%) in both PBS (Figure 2a) and NaCit (Figure 2b). The slow dissolution of various heavy metal NPs under neutral conditions is well-documented,46–50 however, the less than 3% overall Ta dissolution under lysosomal pH was surprising. This clearly demonstrates the inert nature of the TaOx NCs under cytosolic and lysosomal conditions.
Figure 2.
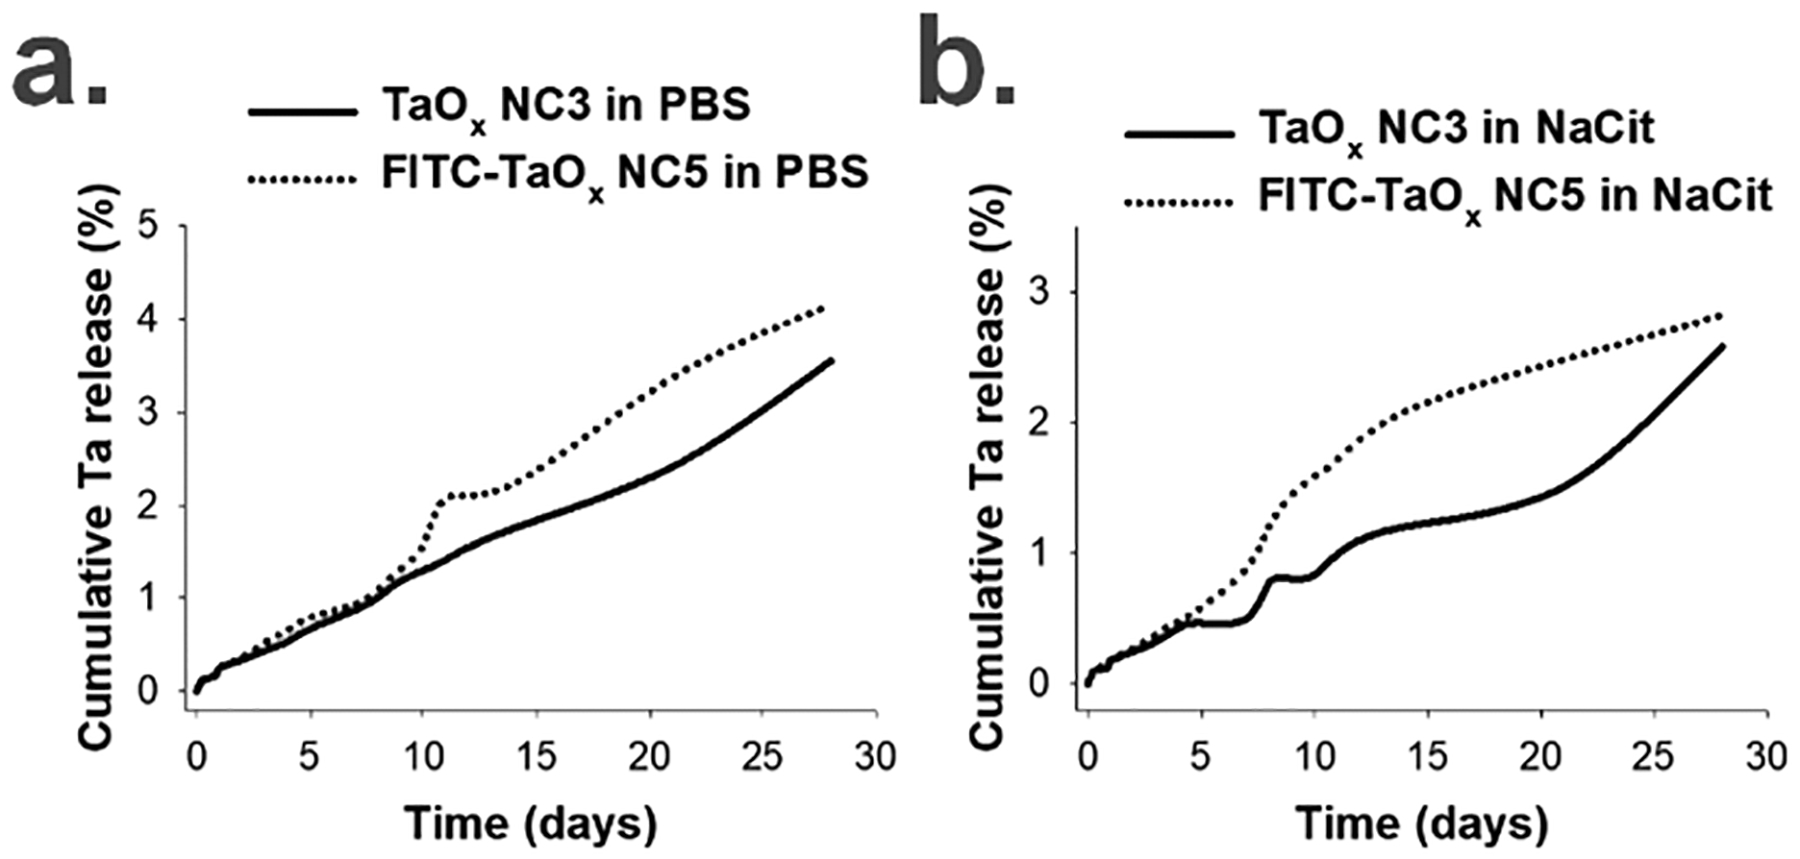
Ta dissolution from TaOx NC3 and FITC-TaOx NC5 in a.) PBS (pH 7.4) and b.) sodium citrate (NaCit, pH 5.5) over 4 weeks using ICP-OES (n = 3, S.D. < 0.5).
In vitro viability and fluorescence imaging of FITC-labeled TaOx NCs
To evaluate the cytocompatibility of various TaOx NCs, MTT cell viability assays using RAW 264.7 macrophage cells and HEK 293 cells following 24 h incubation with varied NC concentrations were carried out. NC1, NC2 and NC4 were selected as these were hydrophilic and formed stable suspensions in cell culture media. High cytocompatibility, up to 2.4 mg mL−1 Ta, was measured for all three NC types in both cell lines (Figure 3a, b; Section 4, ESI†), likely aided by the inertness and limited dissolution of the TaOx NCs. The high cell viability matches that of RITC-TaOx NPs reported by Oh, et al.19
Figure 3.
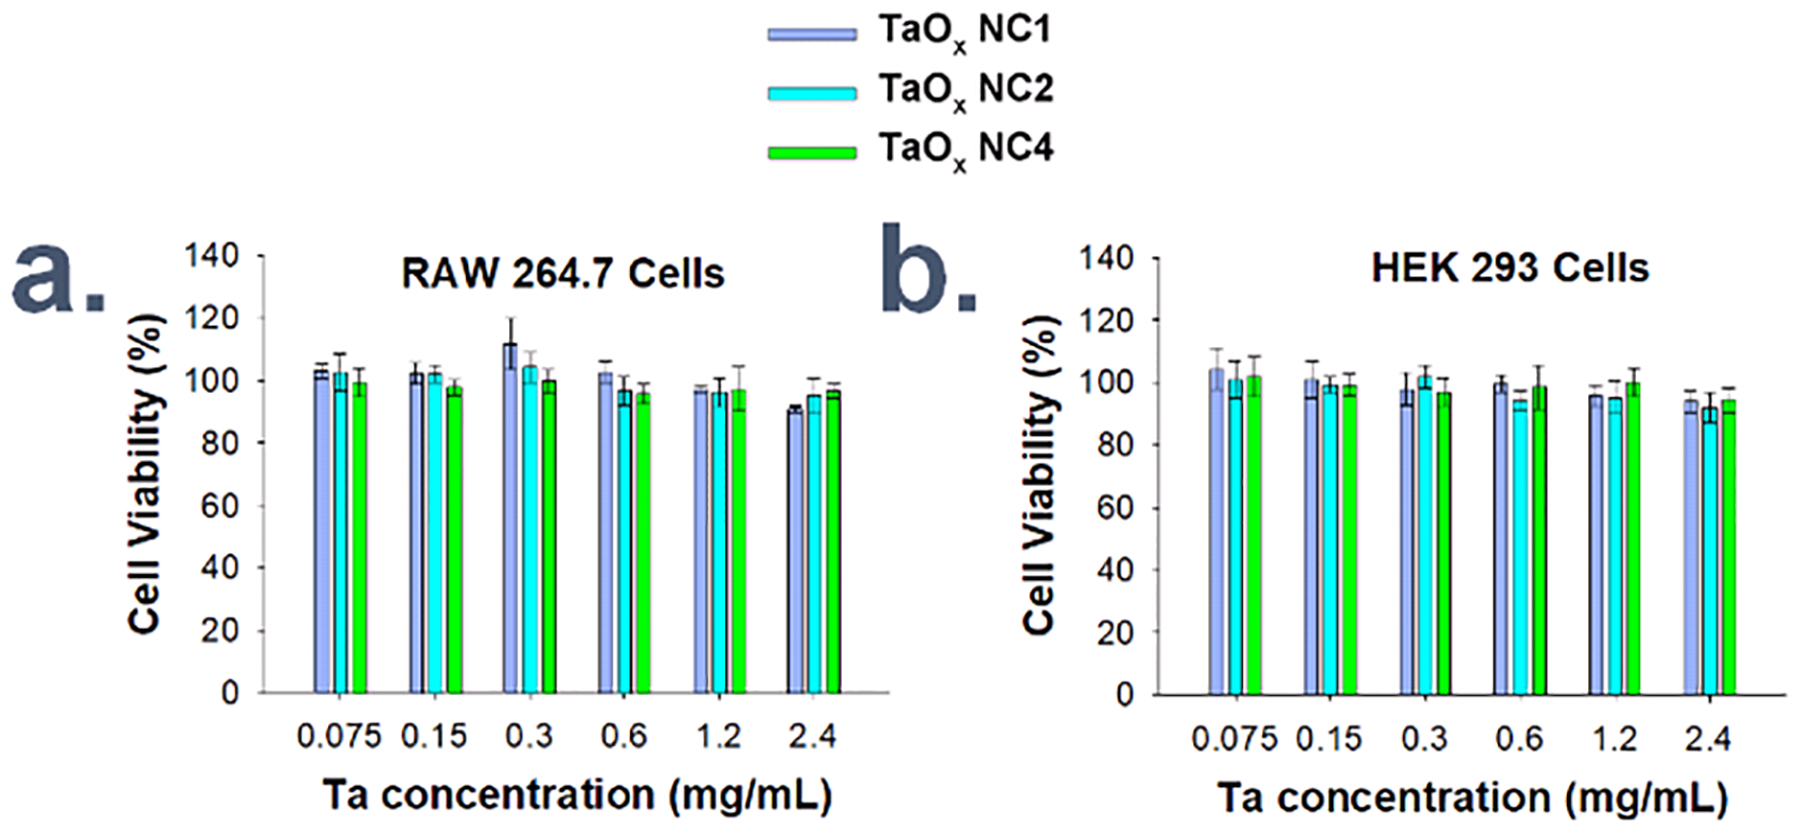
MTT cytotoxicity assay for different concentrations of various TaOx NC types incubated with cultured a.) RAW 264.7 macrophage cells and b.) HEK 293 fibroblast cells for 24 h each.
Micro-CT imaging of TaOx NC1 phantoms in saline
To characterize the CT properties of TaOx NCs, samples of the highly hydrophilic TaOx NC1 (0–100 mM Ta) were dispersed in saline and CT images were acquired on a Perkin Elmer Quantum GX micro-CT scanner operating at 90 kVp and 88 μA. The CT Hounsfield units (HU) showed a linear increase versus Ta concentration with 5.7 HU mM−1 (Figure 4; Section 5, ESI†), which is almost identical to that of gadolinium and iodine based agents in other studies as yet unpublished in our lab, but only at 90 kVp. At clinical kVp, especially above 100 kVp, Ta outperforms iodine in phantom studies.51
Figure 4.
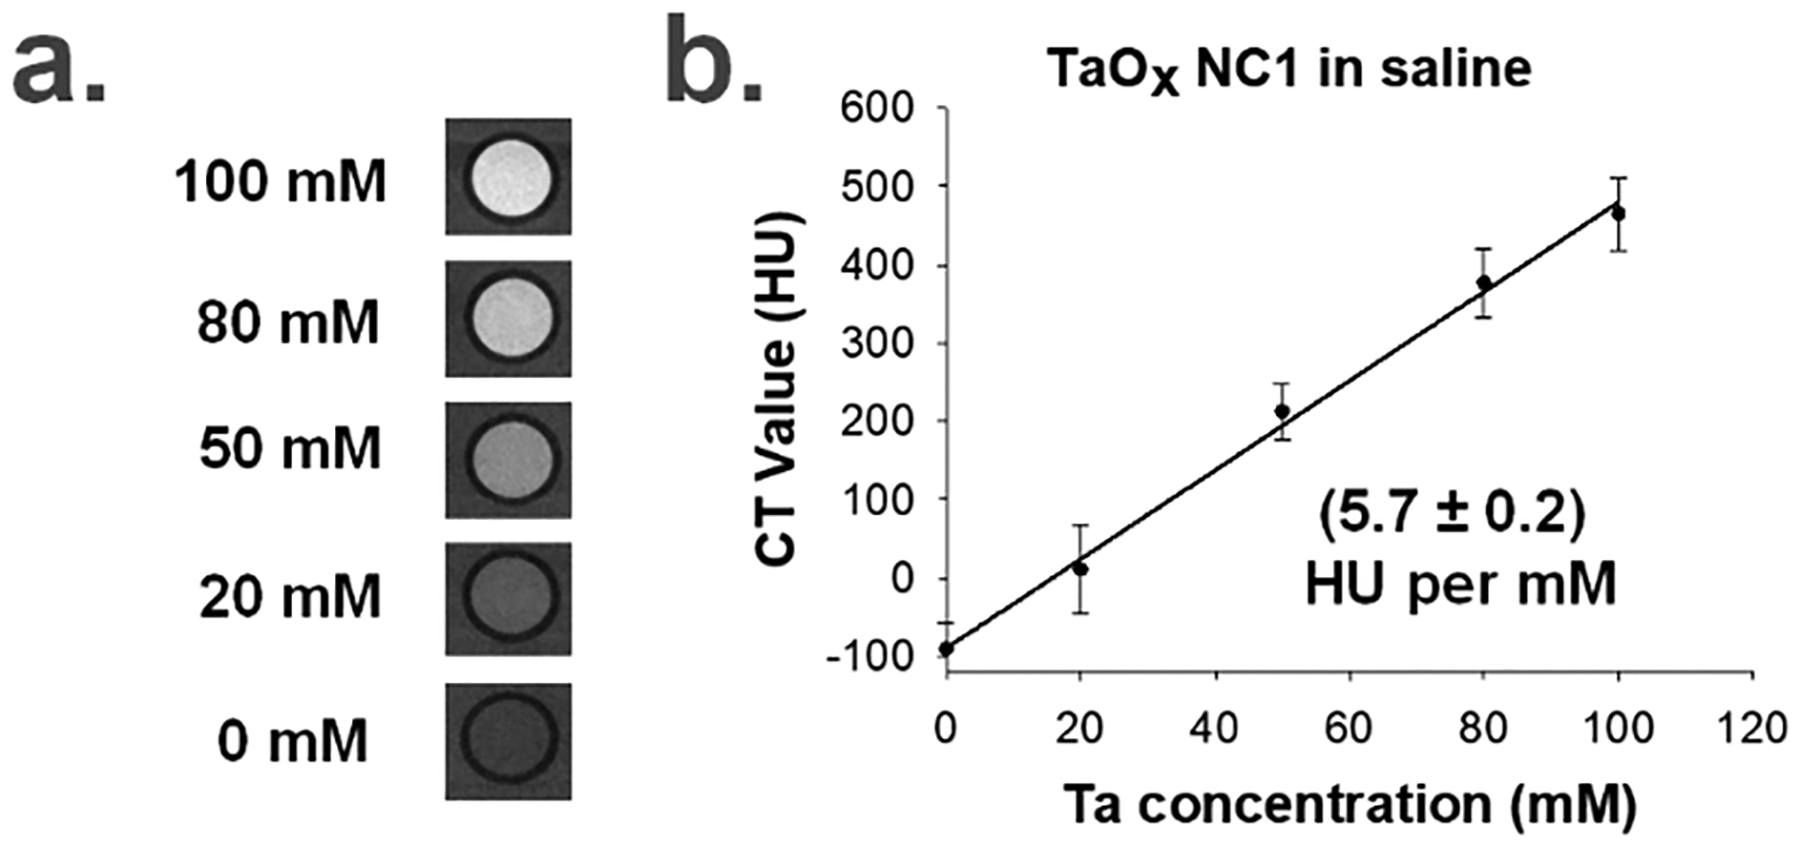
a.) Micro-CT phantom imaging of TaOx NC1 in saline at different Ta concentrations and b.) Linear fitting of CT values as a function of the concentration of Ta in TaOx NC1 in saline (Linear regression equation: Y = 5.69X – 89.58, R2 = 0.9962).
In vivo CT imaging of TaOx NCs following IV injection
In vivo biodistribution of the highly hydrophilic TaOx NC1 was measured, and serial micro-CT imaging was performed over 72 h in mice following intravenous injection of either 296 mg kg−1 or 592 mg kg−1 TaOx NC1, delivered in 200 microliters, at 100 mM or 200 mM Ta concentration, respectively. Following IV injection, NC1 is visible in the vasculature, and remains in circulation for at least 3 h before final accumulation by the liver and spleen over a period of 24–72 h (Figure 5). The time frame for vascular contrast enhancement is roughly equivalent to that measured for commercially available preclinical iodine-containing NPs, evaluated by Mannheim et. al.52 The HU values in the vasculature were maximal immediately post injection and decreased over time while that for the liver and the spleen increased gradually and peaked at 24 h and 72 h respectively (Figure 6), again, similar to that observed with iodine-containing NPs.52 The mice were healthy and did not show any adverse effects such as weight loss, loss of appetite or abnormal behaviour during the entirety of the study. Procedural details for the in vivo experiment are provided in ESI† (Section 6).
Figure 5.
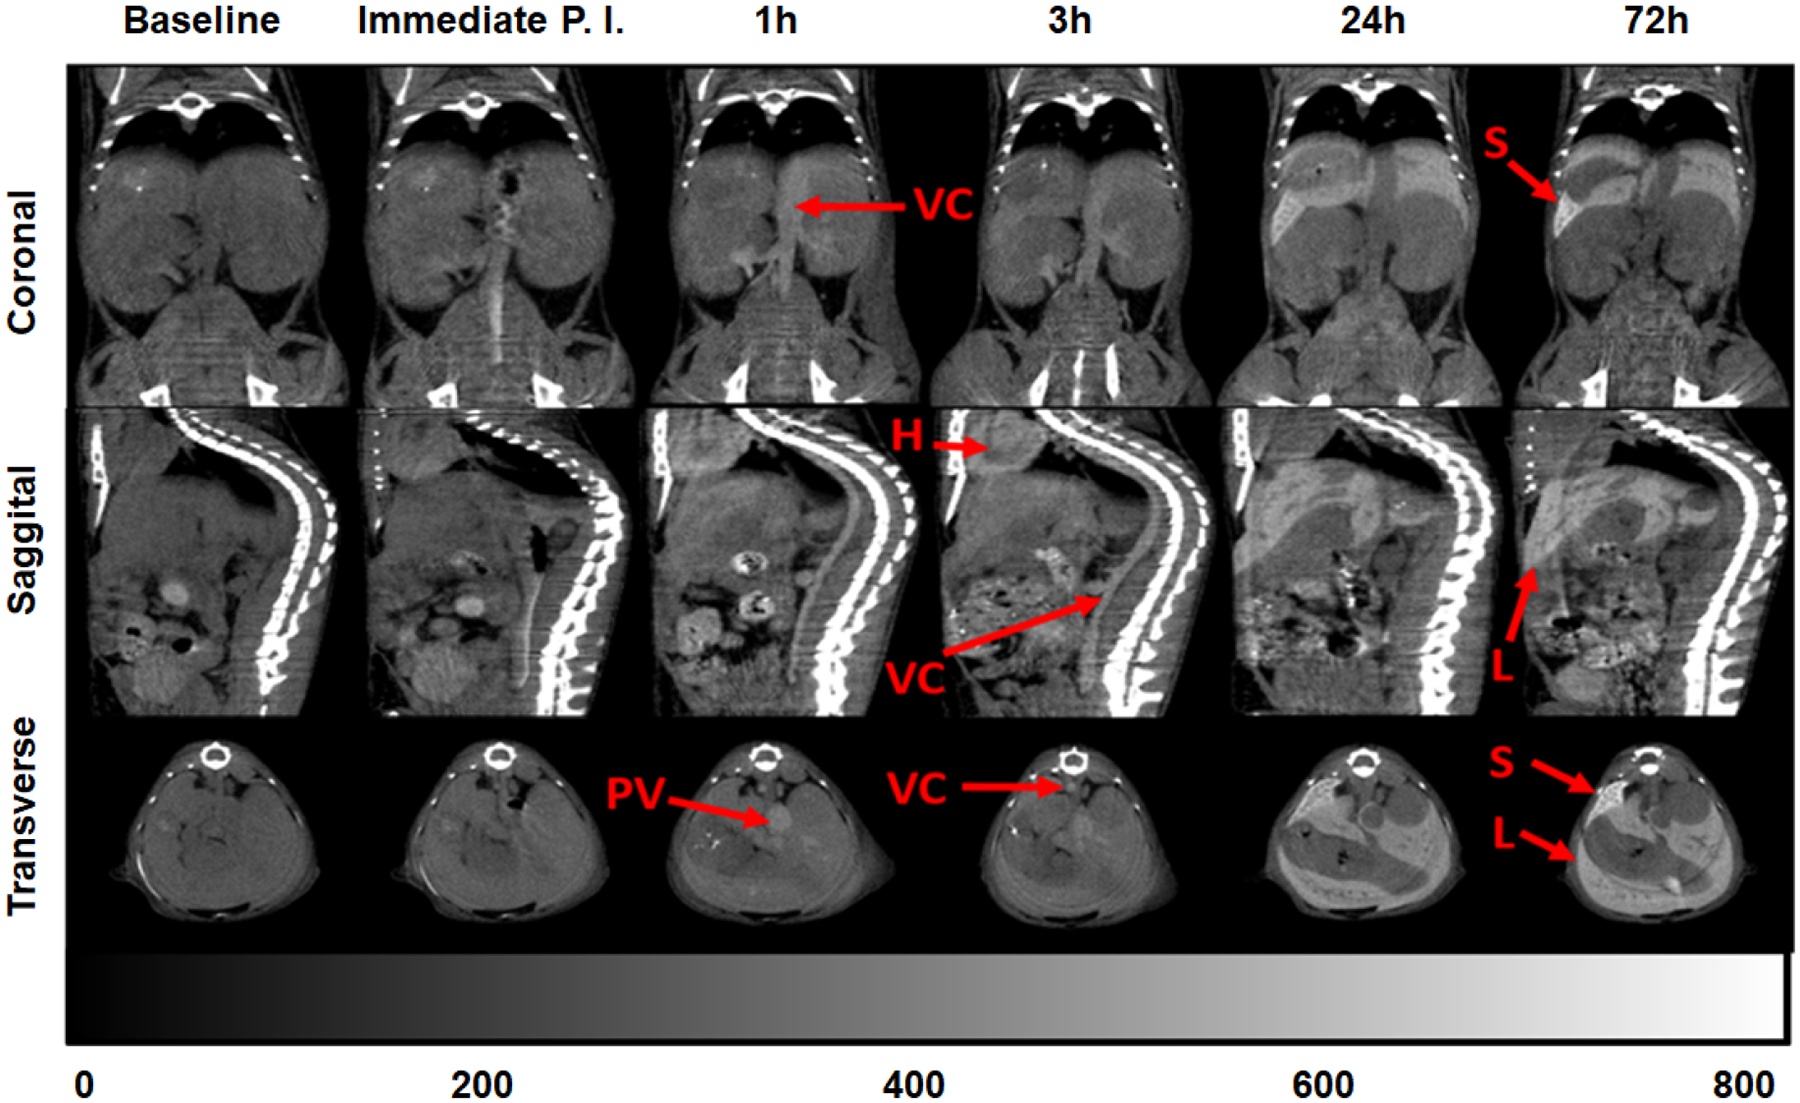
In vivo X-ray micro-CT imaging. a.) Orthogonal views (Coronal, Sagittal, Transverse) of the same representative BALB/c mouse at serial scan time points (0 h baseline, immediate post-injection, 1, 3, 24, 72 h post-injection) of a single, bolus dose (217 μL, 592.3 mg kg−1, IV) 200 mM TaOx NC1. Hounsfield Unit (HU) scale bar shows hyperintensity of vena cava (VC), spleen (S), heart (H), liver (L) and portal vein (PV).
Figure 6.
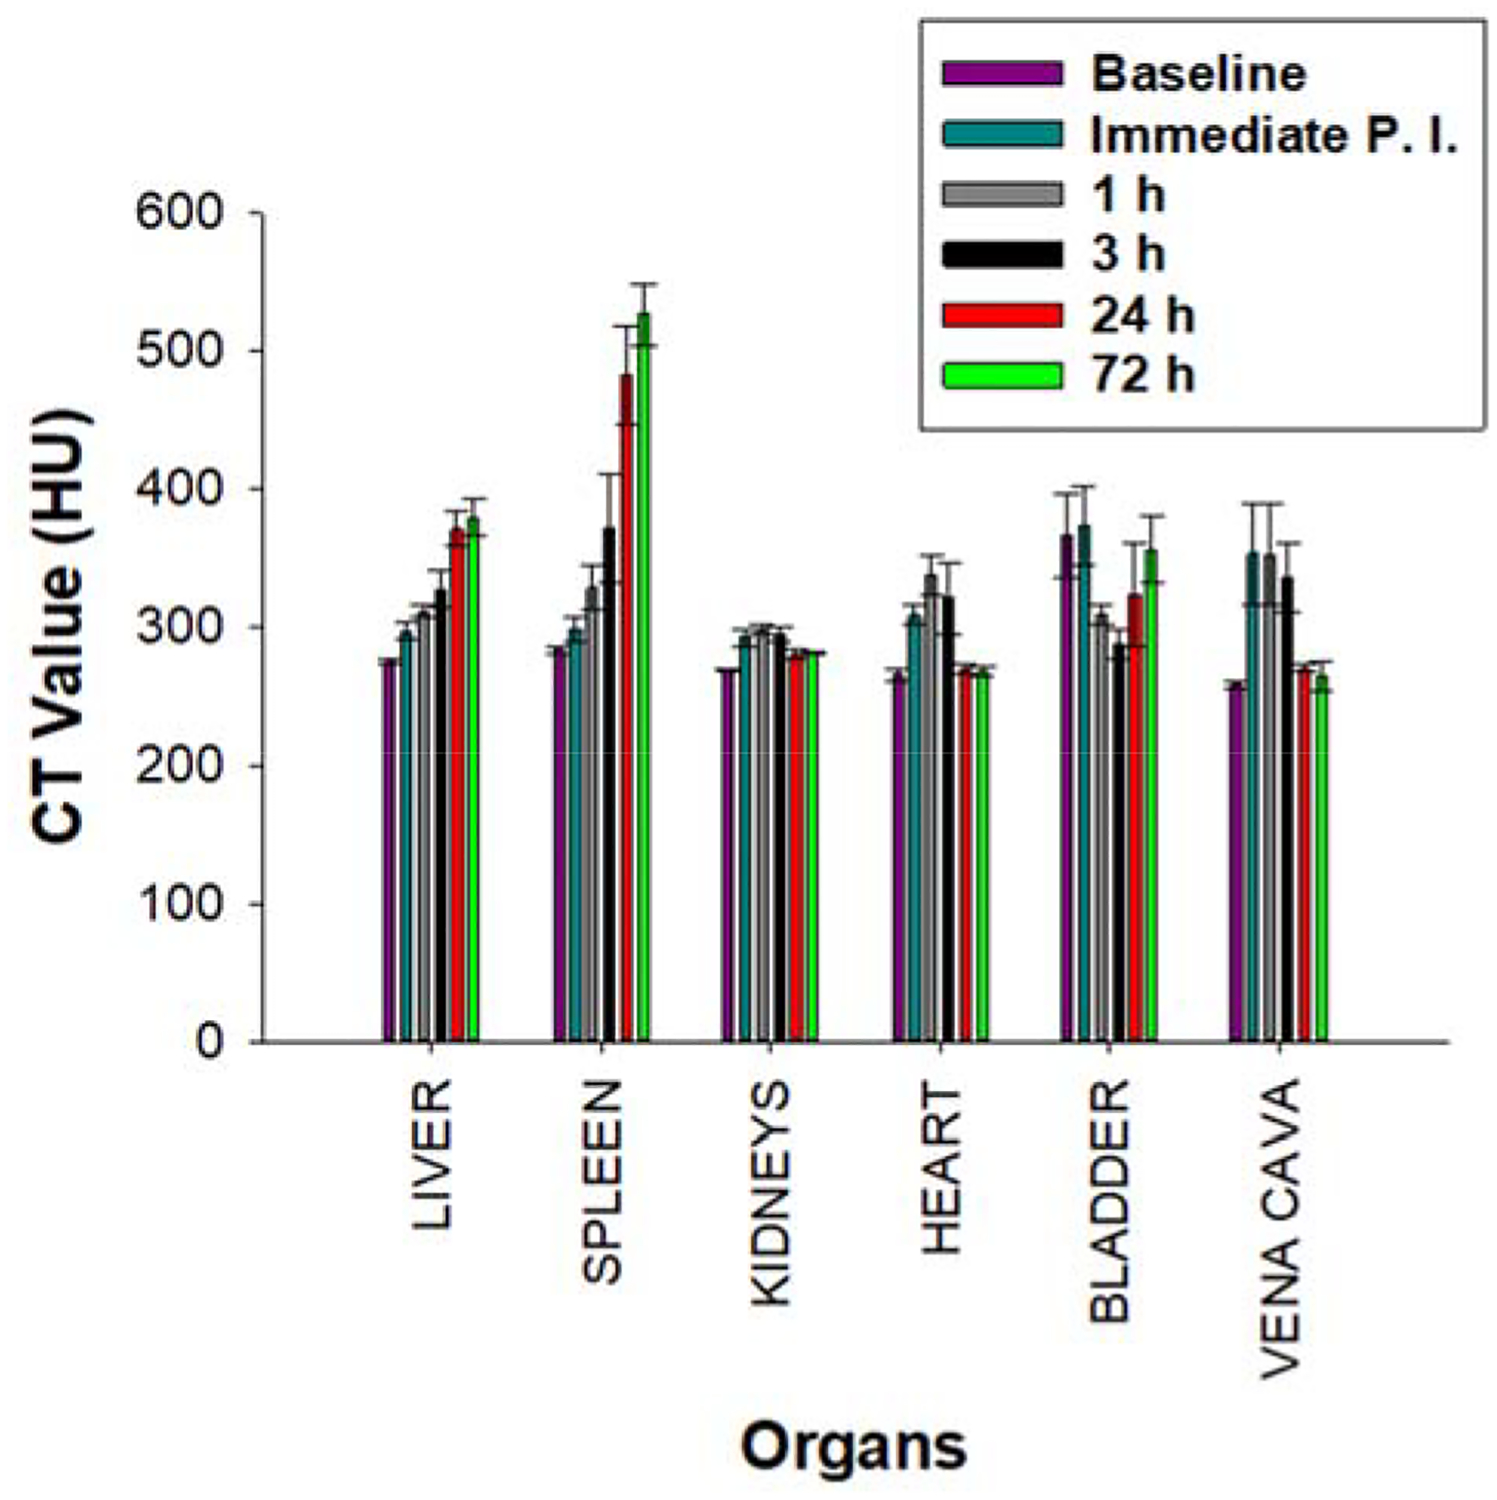
Time course CT enhancement in various organs. CT values (HU) of different organs across various time points, before (baseline) and after a single, bolus dose (217 μL, 592.3 mg kg−1, IV) of 200 mM TaOx NC1.
In vivo biodistribution, histopathology and clinical chemistry of TaOx NCs
After 72h, the mice were sacrificed and various organs (heart, liver, kidney and spleen) were collected and evaluated for biodistribution of the TaOx NC1. Sections of the heart, liver, kidney and spleen were digested in a 4:1 mixture of HNO3 and HF and evaluated for Ta content using ICP-OES. Maximal Ta content was observed in the liver and spleen (Figure S32, ESI†), consistent with the NC distribution and time-dependent CT enhancement as observed in Figure 6. Detailed histological analysis at 72 h of tissue sections excised from the liver, spleen, kidney, heart and bladder showed no adverse effects in mice injected with 296 mg kg−1 TaOx NC1, while mice injected with 592 mg kg−1 TaOx NC1 had multiple hepatic and splenic insults as highlighted by the arrows in Figure 7. The liver and spleen necrosis observed from the histopathology from mice injected with 592 mg kg−1 TaOx NC1 was corroborated with clinical pathology data that indicated higher alanine aminotransferase (ALT) and aspartate aminotransferase (AST) activity suggesting hepatocellular damage (ESI†, Figure S33). Clinical pathology data from mice injected with saline (control) or 296 mg kg−1 TaOx NC1 showed no clinically significant differences. This compares favorably with the standard clinical iodine-based CT contrast agents, which generally deliver 240–370 mg kg−1 iodine to patients.17,53 These results further suggest a safe upper limit of Ta concentration below 592 mg kg−1 TaOx NC1.
Figure 7.
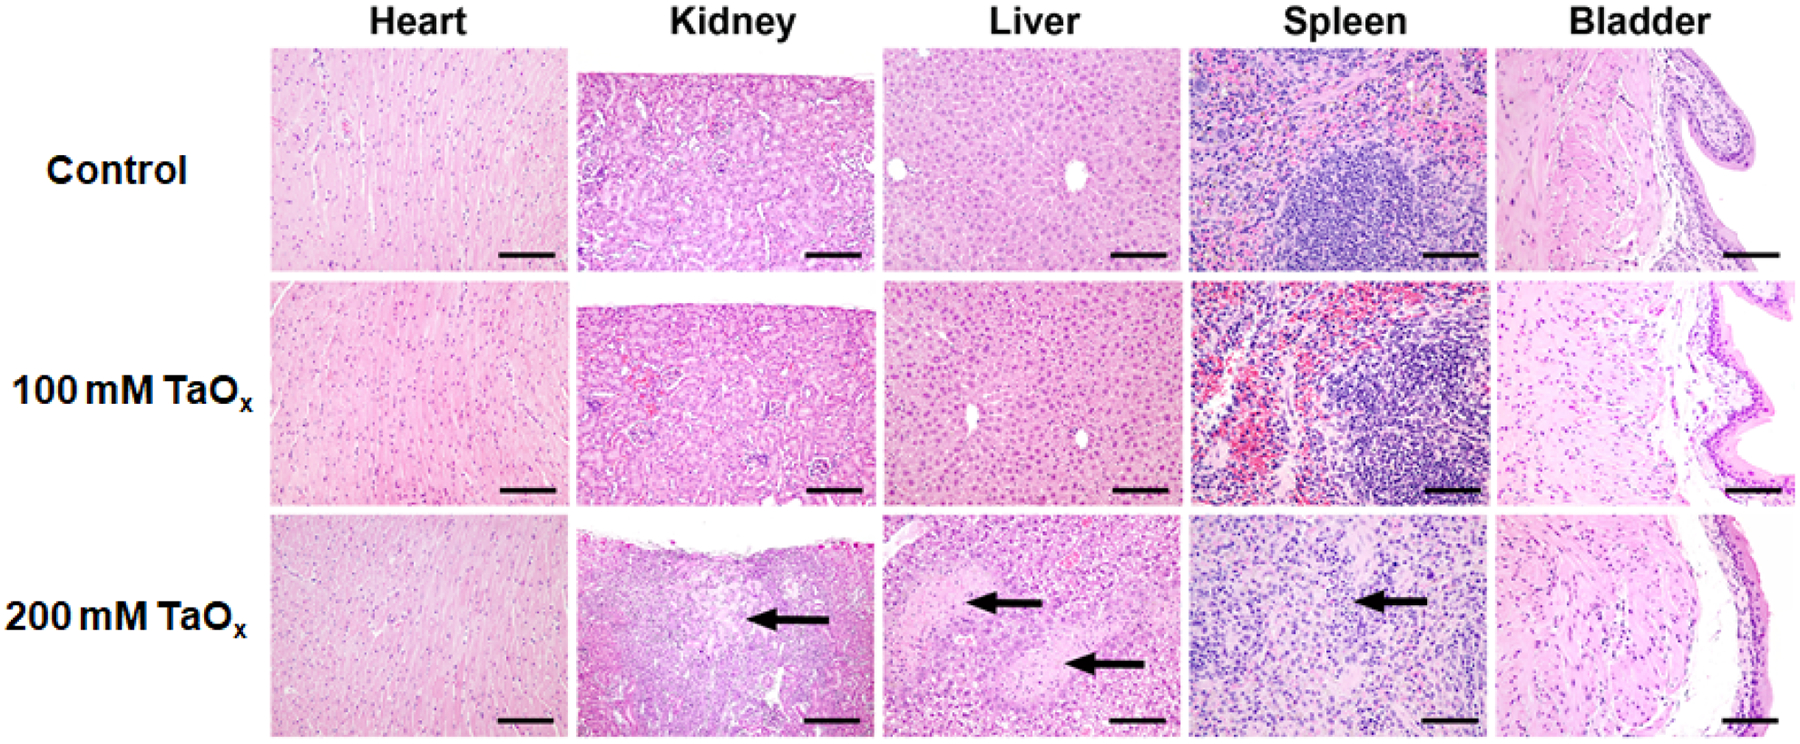
Histological changes in heart, kidney, liver, spleen and bladder of mice that received a single bolus dose of saline (control), 100 mM TaOx NC1 (220 μL, 296.2 mg kg−1 in saline) and 200 mM TaOx NC1 (217 μL, 592.3 mg kg−1 in saline) followed by dissection 72 hours post injection. Sections were stained in H&E and observed under a light microscope at 20X magnification. Arrows point towards regions of renal infarct and necrosis in regions of liver and the spleen. The scale bar is 50 μm.
Imaging the ductal tree in mammary glands following injection of TaOx NCs.
Here we demonstrate the ability of TaOx NC1 to be administered locally and reveal in exquisite detail the continuous non-anastomosed branched structure of a murine ductal tree. Remarkably, ductal tree visualization in mice with TaOx NC1 is significantly superior to that with Isovue-300, an iodine-containing CA used in the clinic for diagnostic ductography.37 While Isovue-300 quickly diffused out of the injected ductal tree immediately after injection,37 TaOx NC1 remains for more than 5 d within the ductal tree enabling repeated imaging of the entire ductal tree network (Figure 8). Moreover, we recently showed in an aggressive mouse model of breast cancer the efficacy of intraductal injection of 70% EtOH in preventing tumor formation.37 The addition of 60 mM TaOx NC1 in ethanol enabled us to visualize the filling of entire ductal tree during treatment. In future studies, TaOx NC1 could be used for clinical evaluation of this local ablation preventative therapy in high-risk individuals.
Figure 8.
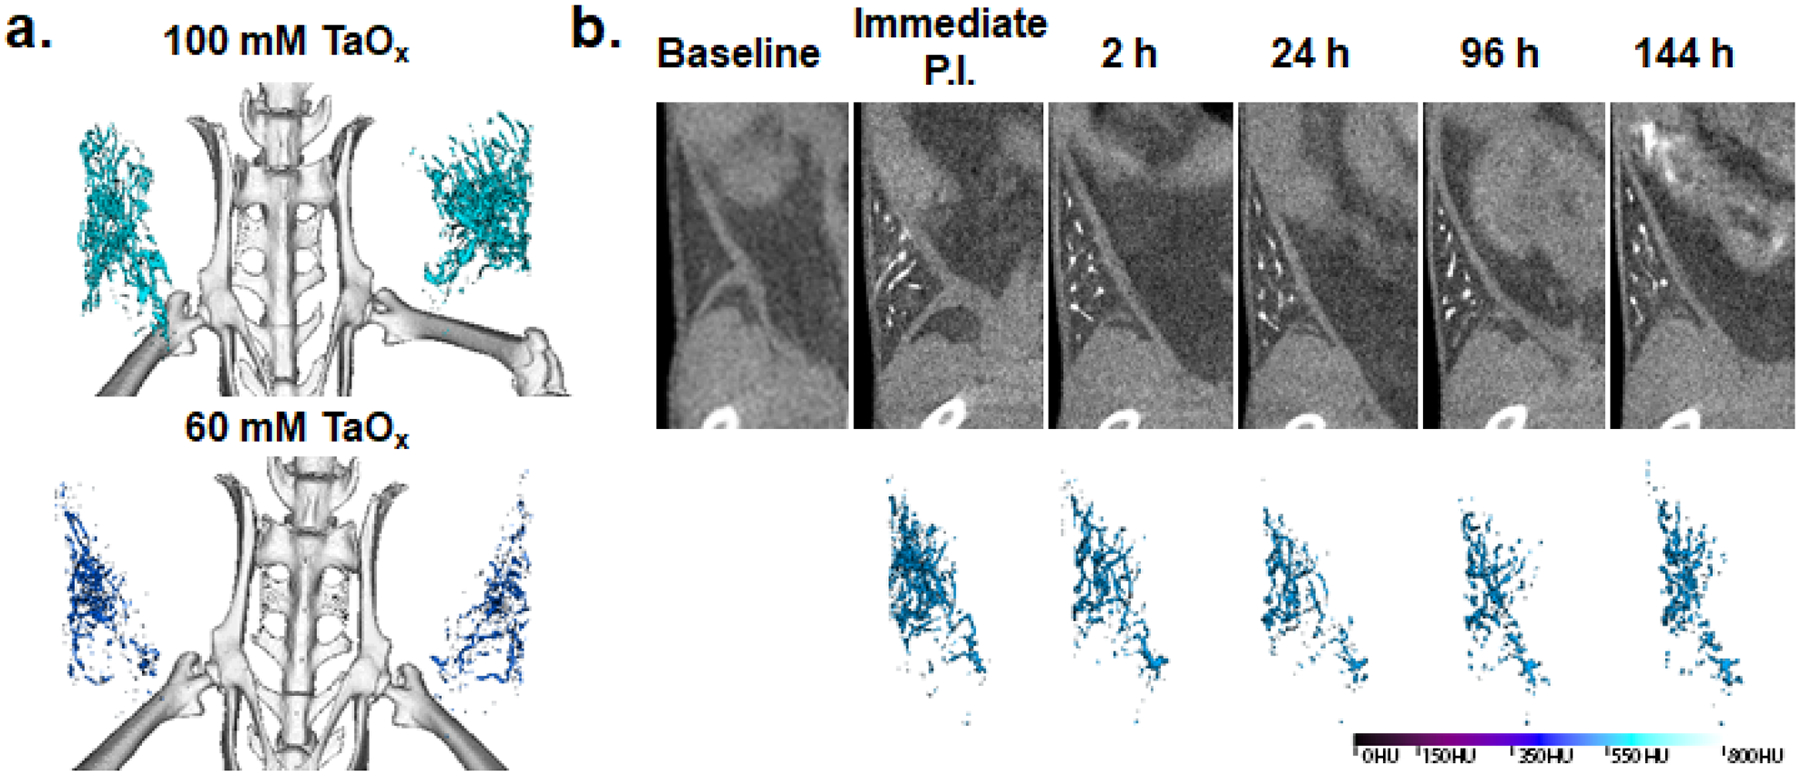
In vivo X-ray micro-CT imaging of mammary ductal tree. a.) 3D reconstruction of ductal trees of abdominal pair of mammary glands of independent 9 week-old FVB female mice immediately after intraductal administration of 40 mL per gland of 100 mM (upper panel) or 60 mM (lower panel) of TaOx NC1 b.) Ventral view (upper pane) and 3D reconstruction of the same representative FVB mouse at serial scan time points [baseline, immediate post-injection (immediate P.I.), 2, 24, 96, 144 h post-injection) of a single intraductal administration of 40 μL of 60 mM TaOx NC1. Hounsfield unit (HU) histogram range standardized from 0 HU to 800 HU. The color of the 3D reconstruction of each injected ductal tree shows the average voxel intensity in HU of the rendered object.
Design, Synthesis and Characterization of Polymer Encapsulated TaOx NPs
We next focused on the design of a NP CT contrast agent that has a core-shell structure wherein multiple CT-dense NCs constitute the NP core, while FDA approved polymers such as PLGA or biocompatible alternatives such as mesoporous silica comprise the shell. This work builds on well-established technology of encapsulating bismuth,54,55 iron oxide,56,57 gadolinium oxide,58 and several heavy metal NCs within PLGA or silica.59,60 The salient features of this methodology are: 1.) facile encapsulation of multiple highly radiopaque TaOx NCs in FDA approved and biocompatible polymers; 2.) reproducible and easy scale up procedure and 3.) high encapsulation efficiency within the polymer matrix, resulting in higher per volume Ta content.
Design rationale and synthesis of TaOx@PLGA NPs
We have previously reported the encapsulation of hydrophobic NCs in PLGA using an oil-in-water emulsification technique.55 An identical procedure was adopted to synthesize TaOx@PLGA NPs as shown in Scheme 2a. The technique generates an oil-in-water emulsion wherein the hydrophobic TaOx NC3 and the polymer PLGA comprises the oil layer (Dichloromethane, DCM) and the water-soluble emulsifier and surfactant, poly(vinyl alcohol) (PVA) consists the water layer (Section 7, Schemes S6, S7, ESI†).
Scheme 2.
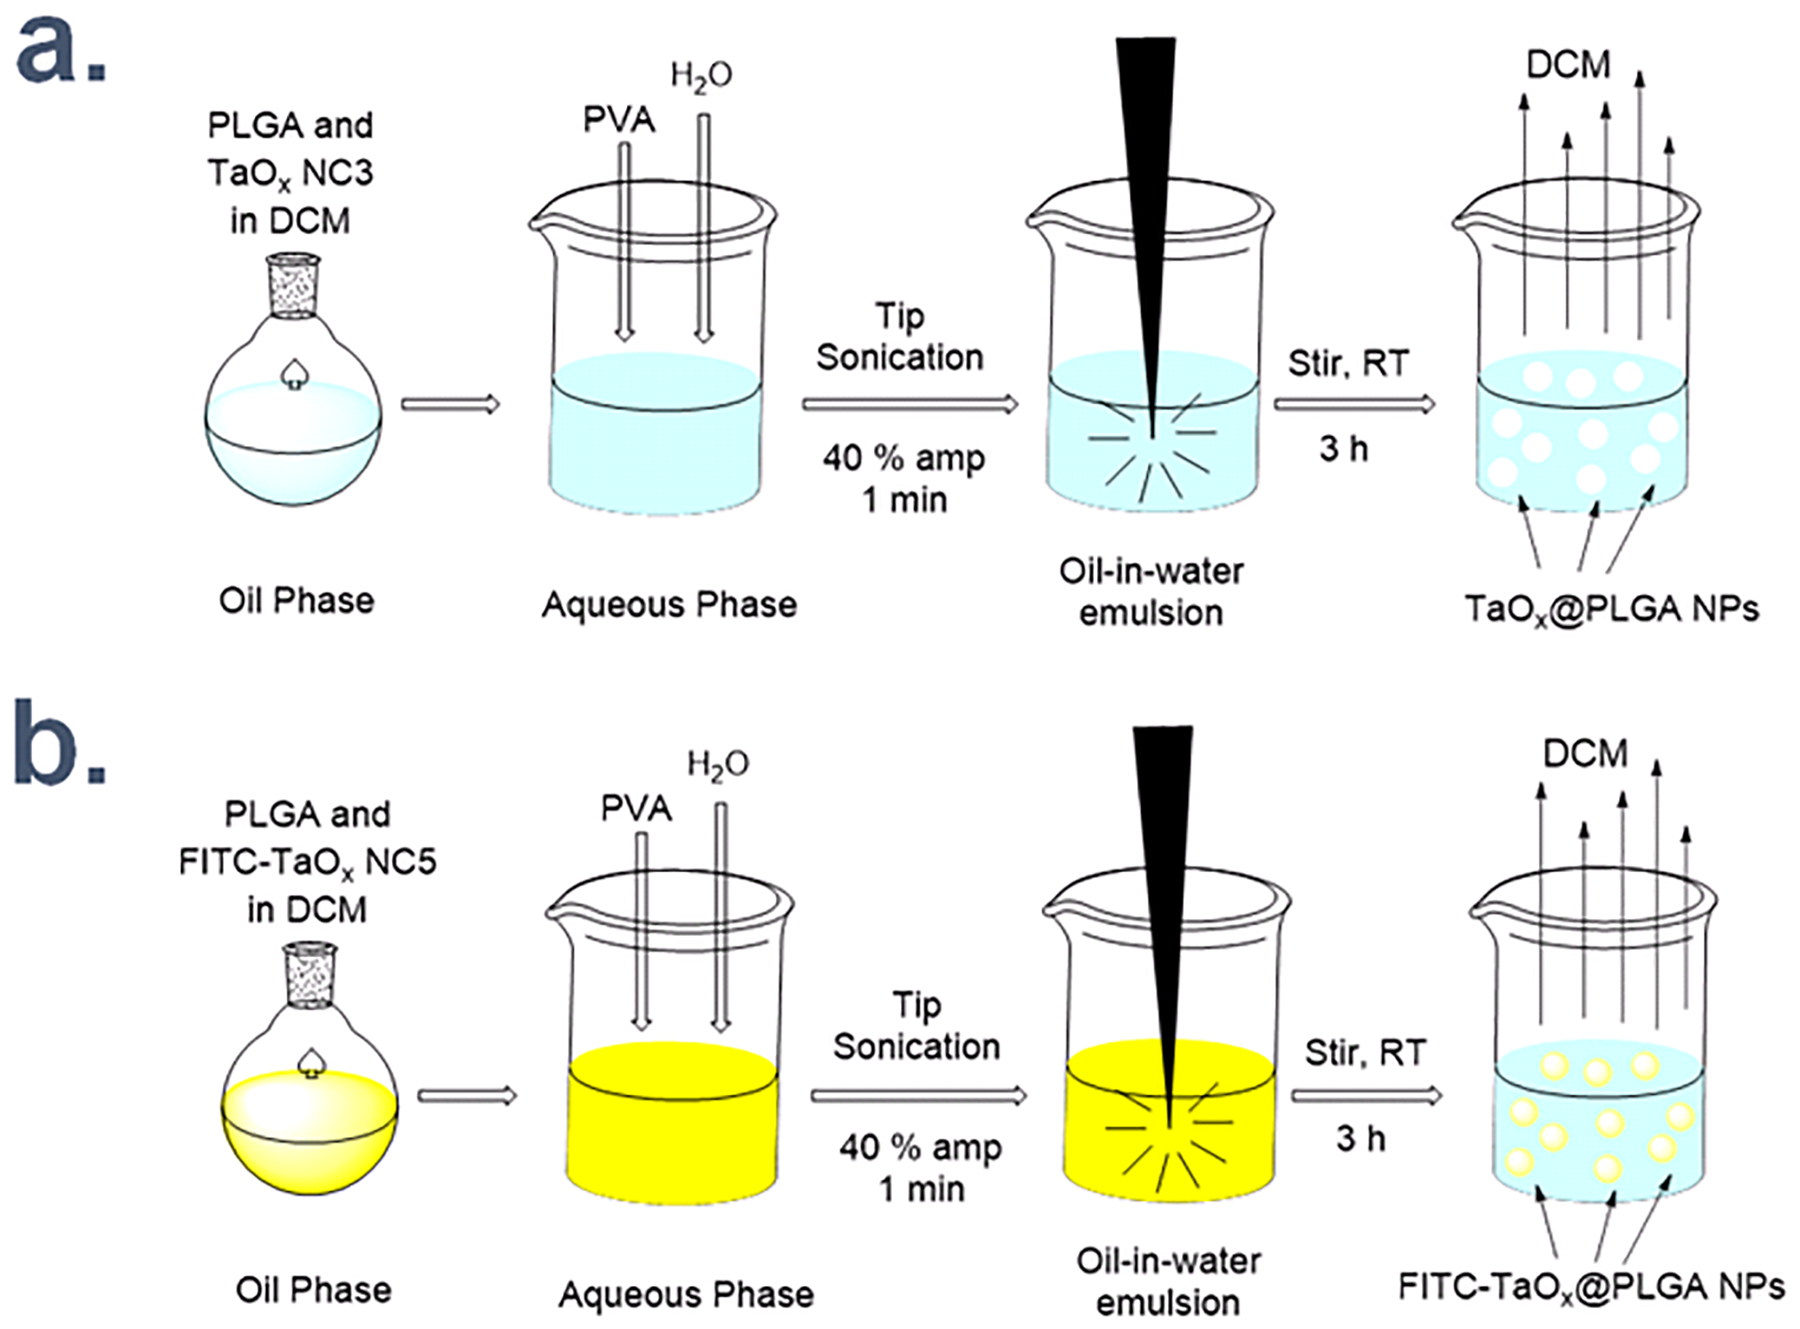
Schematic representation for synthesis of (a.) TaOx@PLGA NPs and (b.) FITC-TaOx@PLGA NPs.
This procedure involves the initial dropwise addition of the oil in water over continuous vortex, followed by tip-sonication to generate an emulsion. The emulsion is diluted and stirred for 3h at RT to remove the low boiling point solvent DCM resulting in hardened NPs. The critical step in this procedure is the formation of a homogenous suspension of the NCs and the polymer in the oil layer. As such, hydrophobic NCs are best when using this strategy. FITC-TaOx@PLGA NPs, with the FITC-TaOx NC5 as the core, were also fabricated by simply replacing the hydrophobic TaOx NC3 with the fluorescently labeled TaOx NC5 in the oil layer (DCM) (Scheme 2b), allowing us to track the cellular uptake and internalization of the NPs by fluorescence microscopy. Importantly, the reaction steps were carried out in the dark to avoid photo bleaching.
Characterization of TaOx@PLGA NPs
Table 2 lists the hydrodynamic size, polydispersity index (PDI) and zeta potential for all the six TaOx@PLGA NP types. The average size for the TaOx@PLGA NPs and the FITC-TaOx@PLGA NPs was ~ 210–230 nm with a low PDI of 0.1–0.2. The terminal acid functionality in PLGA and the use of PVA as a stabilizer contributed towards the negative zeta potential observed for these NPs. SEM and TEM images (insets) for TaOx@PLGA NPs (Figure 9a, b and Figure S34, ESI†) and FITC-TaOx@PLGA NPs (Figure 9c, d and Figure S37, ESI†) revealed smooth spheres with efficient and uniform encapsulation of TaOx NCs and no visible aggregation. The presence of Ta and Si were confirmed using EDS spectra (TaOx@PLGA NPs; Figure S35, ESI†; FITC-TaOx@PLGA NPs; Figure S39, ESI†). The fluorescence spectra of the FITC-TaOx@PLGA NPs suspended in PBS matched closely with that of free FITC (Figure 7g). The FTIR characterization of TaOx@PLGA NPs (Figure S36, ESI†) and FITC-TaOx@PLGA NPs (Figure S40, ESI†) indicates that the synthesis procedure did neither alter the chemical composition of the PLGA polymer nor impact the silane coating on the TaOx NCs embedded within the polymer shell. Common peaks include the sharp peak centered at 1760 cm−1 corresponding to the C=O group in the starting polymer and identical distribution of peaks in the alkyl C-H bend range (1350–1480 cm−1) and alkoxy C-O stretching range (1050–1150 cm−1). Also buried within the broad peak centred at about 1100 cm−1 is a strong band for Si-O-Si stretching vibration that proves the presence and retention of a silane coating on the TaOx NCs. The Ta content for the TaOx@PLGA variants was found to be within 45–56% using ICP-OES, the highest among all reported TaOx NPs to date (Table 2).
Table 2.
Characterization of various TaOx NP formulation
| NP Type | NC Type | Polymer Type | Ta (%)a | Dhb (nm) | PDIb | Zeta Potentialb (mV) |
|---|---|---|---|---|---|---|
| TaOx@PLGA | TaOx NC3 | PLGA-ACID | 56 | 217.0 ± 3.3 | 0.19 ± 0.04 | −20.05 ± 0.59 |
| FITC-TaOx@PLGA | TaOx NC5 | PLGA-ACID | 45 | 226.5 ± 1.7 | 0.14 ± 0.08 | −12.23 ± 0.71 |
| MSNP | n/a | Silica | n/a | 134.8 ± 10.3 | 0.11 ± 0.03 | −27.5 ± 6.3 |
| TaOx@MSNP-OH | TaOx NC2 | Silica | 43 | 86.9 ± 3.9 | 0.14 ± 0.03 | −15.2 ± 2.5 |
| TaOx@MSNP-Phos | TaOx NC2 | Silica | 45 | 83.4 ± 2.7 | 0.17 ± 0.02 | −17.9 ± 3.9 |
| FITC-TaOx@MSNP | TaOx NC4 | Silica | 39 | 85.7 ± 5.4 | 0.19 ± 0.07 | −17.5 ± 2.3 |
Ta content reported using ICP-OES;
Size, PDI and Zeta potential reported using DLS
Figure 9.
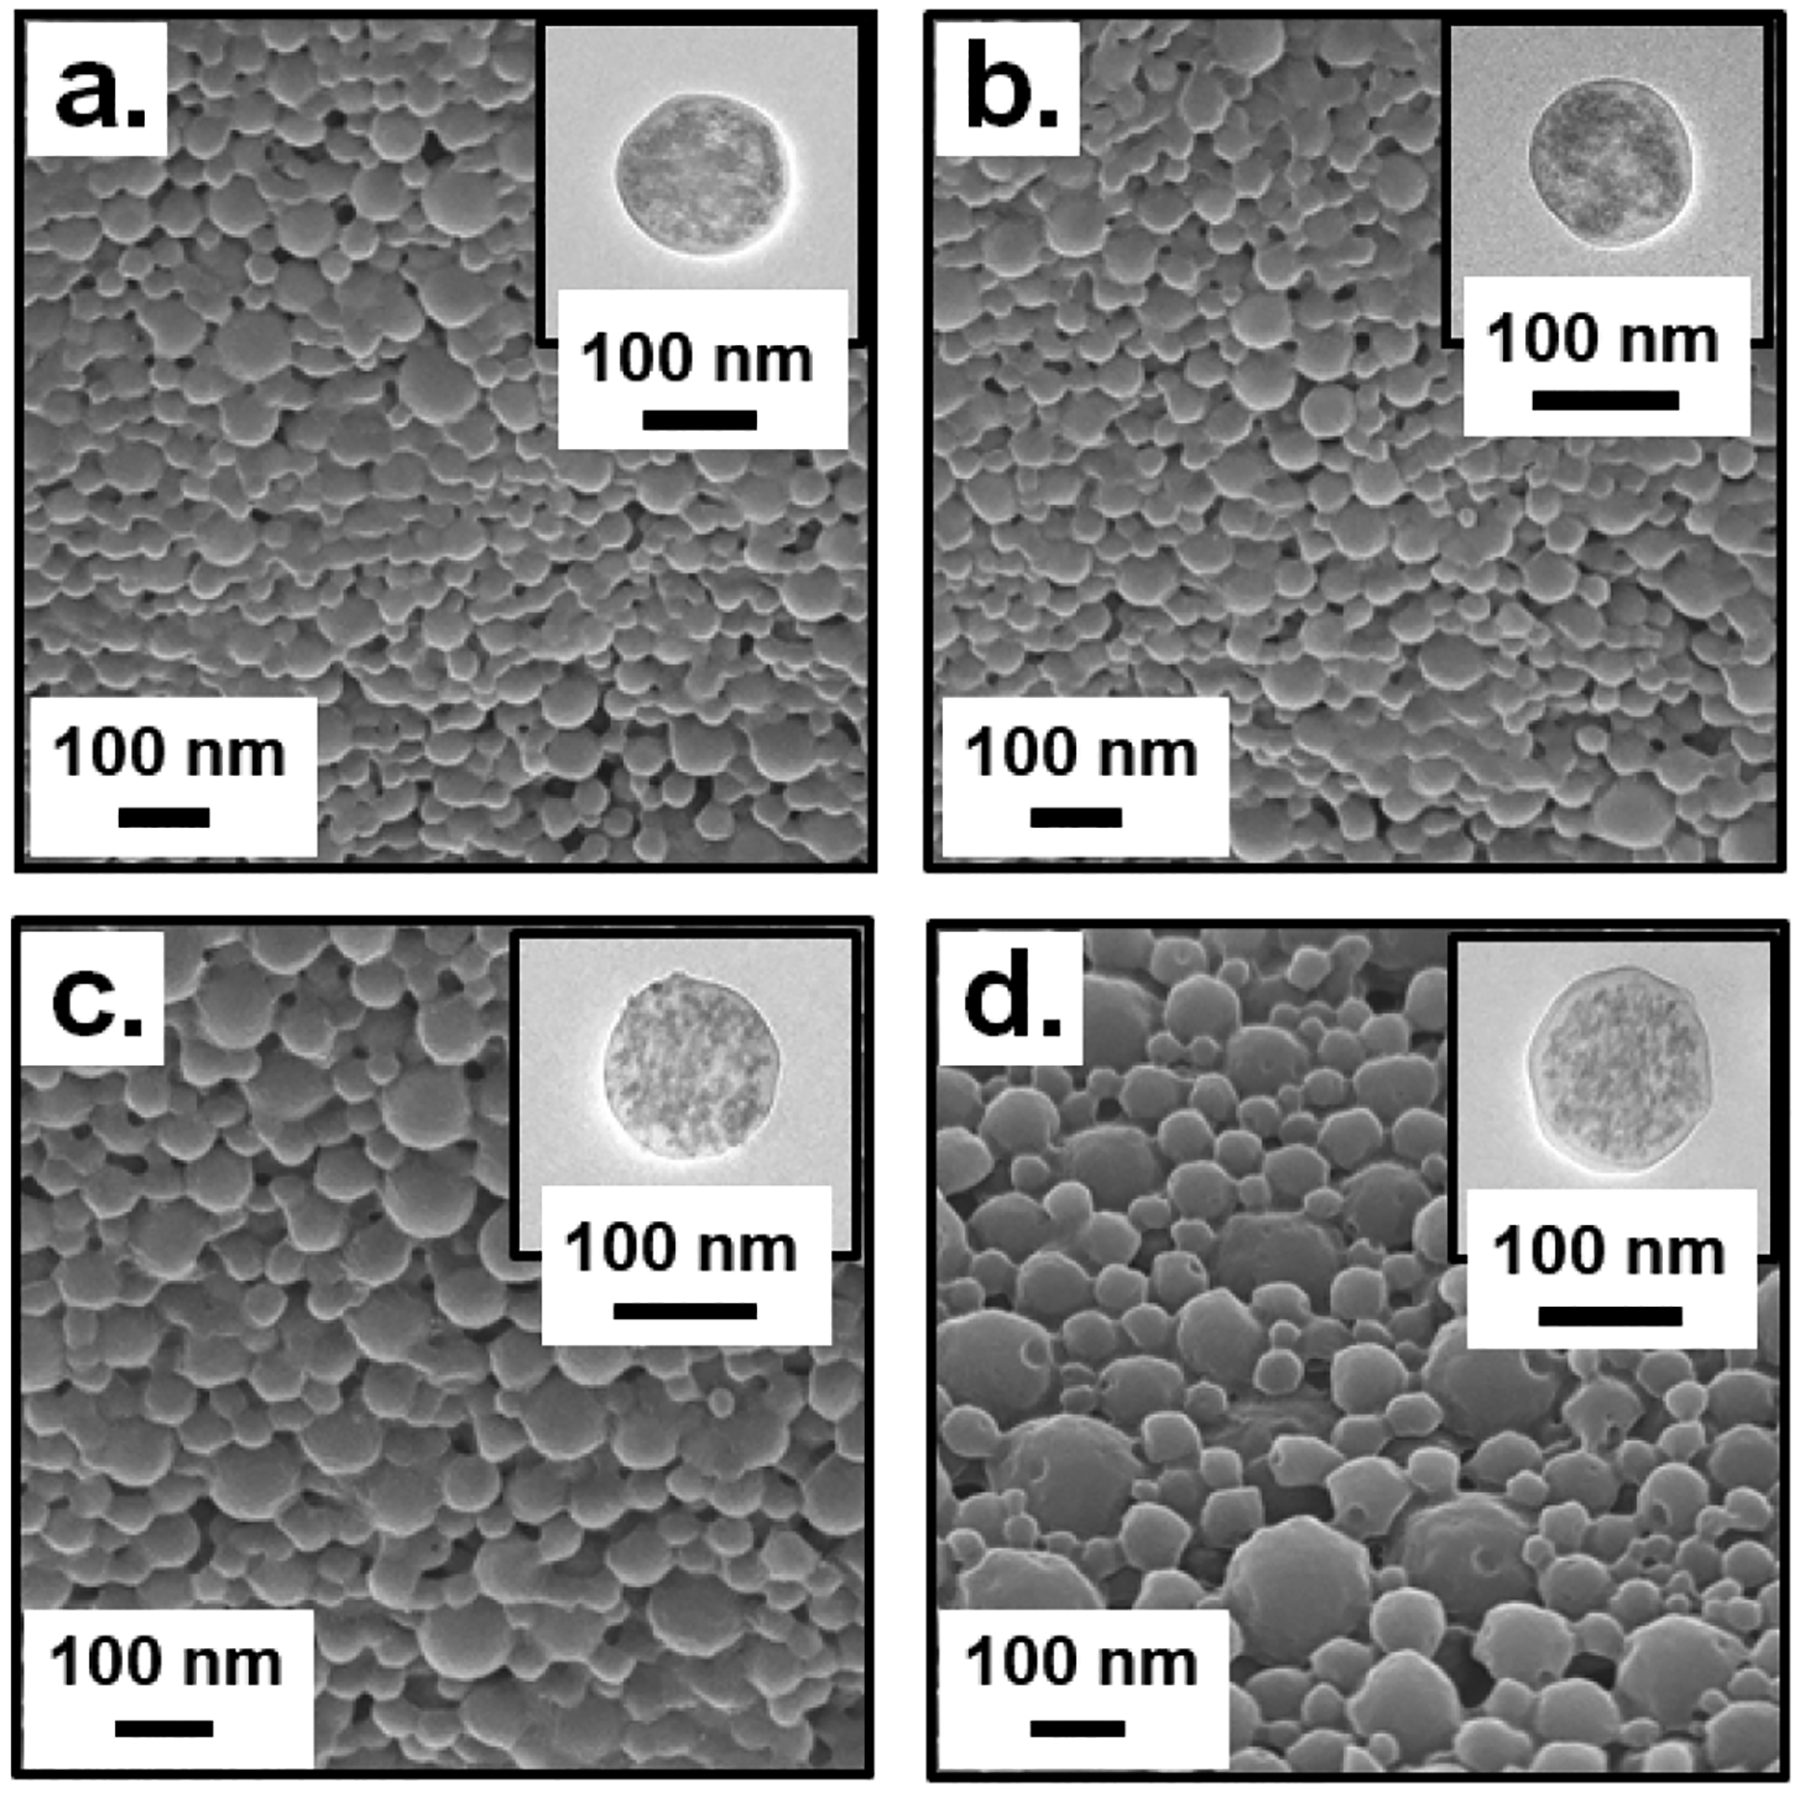
SEM and TEM (inset) characterization for a-b.) TaOx@PLGA NPs; c-d.) FITC-TaOx@PLGA NPs.
Design rationale and synthesis of TaOx@MSNPs
MSNPs are versatile nanocarriers for various drugs, macromolecules and imaging agents due to favorable properties such as tuneable pore size, facile surface functionalization and a stimuli responsive mechanism for loading/release of cargo at the target site.61,62 The robust, template driven synthesis63 allows for in situ seeding or post-synthesis surface modification with CAs for MRI,64,65 PET,66,67 optical,68–71 and ultrasound imaging72,73 as has been demonstrated by various recent examples.74 The high pore volume and surface area, extensive cargo loading capability and bioavailability, together with the ability to co-localize CAs for various imaging modalities, can transform these unique materials with no inherent contrast, into diagnostic tools with potential applications in theranostics.75 To create CT-visible MSNPs, we performed in-situ encapsulation of radiopaque TaOx NCs within the MSNPs.
Among the various types of MSNPs, MCM-41 (mobil crystalline materials or mobil composition of matter) have been widely explored for drug delivery due to their ease of synthesis and a high surface area that has immense potential for loading various agents of interest.76 Typically, the synthesis of MCM-41 involves a highly water soluble cationic surfactant, such as cetyltrimethylammonium bromide (CTAB) that acts as a template to facilitate the formation of MSNPs. The base-assisted sol-gel reaction to form the MSNPs is ensued by the addition of a silica pre-cursor, e.g. tetraethyl orthosilicate (TEOS) resulting in the formation of these hexagonal materials with a pore size within 2.5 to 6 nm. This reaction typically occurs at high temperature and the MSNPs are recovered by centrifugation. In order to remove the trapped surfactant template an acid-assisted dialysis procedure is carried out to isolate template-free porous MSNPs. The synthetic protocol to fabricate TaOx embedded MSNPs is shown in Scheme 3 and the full synthetic procedure is detailed in the ESI† (Section 9). The use of water as the reaction solvent and the remaining steps suggests that any hydrophilic NC precursor could be easily incorporated within the MSNPs. The moderately hydrophilic TaOx NC2 was selected to be the MSNP core as this had the highest Ta content of the hydrophilic TaOx NC variants we synthesized. Briefly, to a pre-formed solution containing CTAB and triethanolamine (base) in water, an aqueous suspension of TaOx NC2 was added and the resulting suspension was heated to 80 ˚C for 1 h. This step leads to the formation of ellipsoidal micelles with an inner core consisting of a hydrophobic tail. The consequent addition of the oil-like monomer TEOS under vigorous stirring leads to formation of an emulsion-like system. Subsequently, the reaction mixture is heated at 80 ˚C for 2 h during which the TEOS is solubilized on the hydrophobic core resulting in micelle enlargement and a shape change from an ellipsoid to a sphere. As TEOS is hydrolyzed, positively charged, hydrophilic TEOS monomers are released into the aqueous media and to the negatively charged CTAB micelles leading to formation of a silica shell around it. Once the hydrolysis of TEOS is complete, the micelles decrease in size, agglomerating with nearby micelles to undergo NP growth with a mesoporous structure. Subsequent centrifugation and acid-mediated dialysis of the crude reaction mixture against water leads to isolation of TaOx embedded MSNPs. Synthesis of empty MSNPs simply omits the NCs during MSNP synthesis and is detailed in the ESI† (Scheme S8).
Scheme 3.
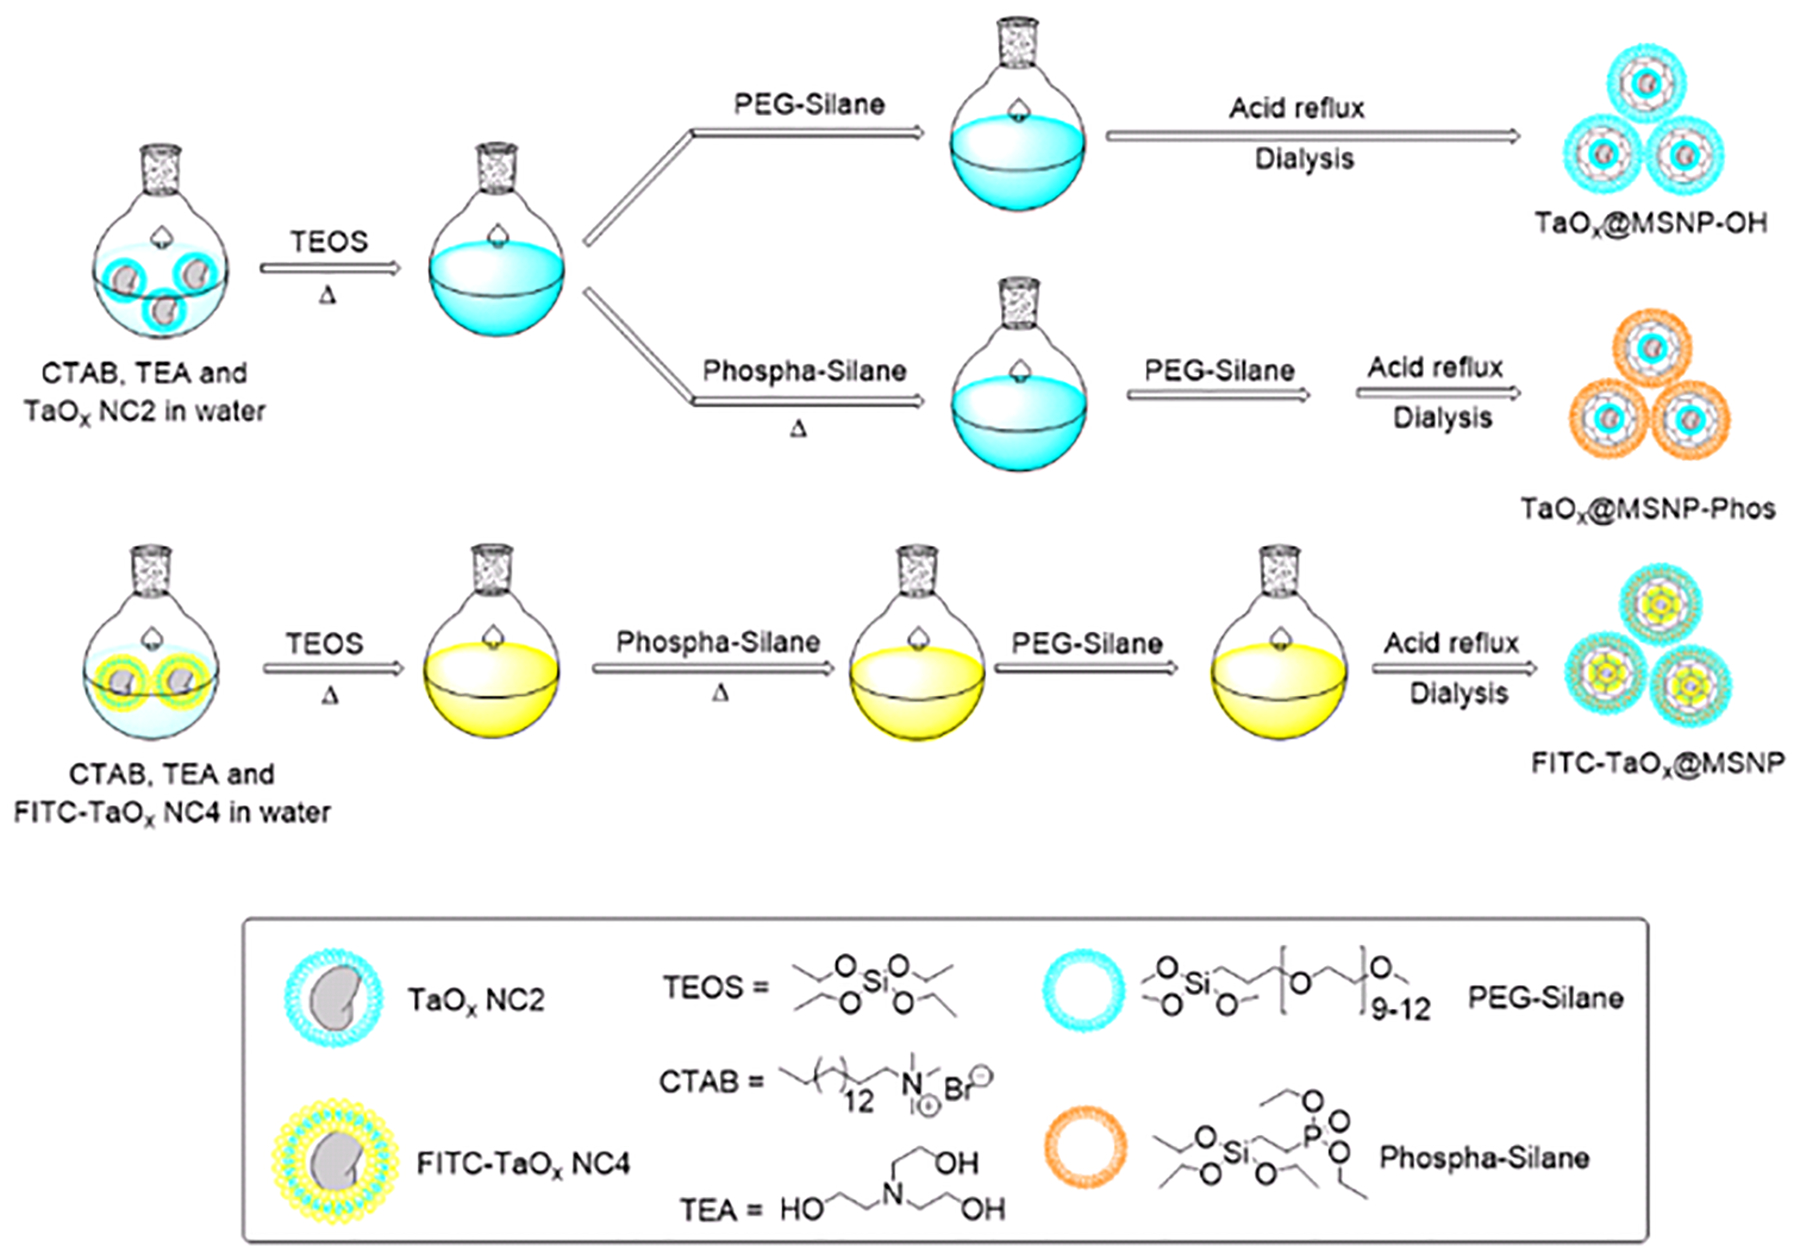
Schematic representation for the synthesis of various TaOx embedded MSNPs.
To enhance the dispersibility of the MSNPs in aqueous media, the inherent reactivity of the surface siloxane groups was employed. For example, introduction of PEG-Silane after the addition of TEOS lead to the formation of TaOx@MSNP-OH, that consisted of surface-appended hydroxyl groups (SI Scheme S9). Alternately, the addition of (2-Diethylphosphatoethyl) triethoxysilane or Phospha-silane, a commercially available silane moiety with a phosphonate end group, resulted in the synthesis of TaOx@MSNP-Phos, bearing phosphonate groups on the surface (Scheme S10, ESI†). The current methodology provides quick access to a range of functionalities that can be appended on the MSNP surface using well-established silane chemistry. Kim et. al. have recently reported a “ring opening click” reaction using various heterocyclic silanes to react with the surface hydroxyl groups of porous silica nanostructures and introduce functional groups such as –NH2 and –SH for subsequent coupling with targeting or biocompatibility agents.77 Such novel reactions could be easily extended to the family of TaOx@MSNPs reported in this work, providing access to nanomaterials with a range of applications in targeted drug delivery and imaging. To further demonstrate the utility of the methodology in terms of its ability to encapsulate various types of NCs, as well as to track the cellular uptake and internalization of the resulting NPs, FITC-TaOx@MSNPs comprising the fluorescent and hydrophilic FITC-labeled TaOx NC4 as the core were also fabricated by using a similar protocol. The respective reaction sequence is shown in Scheme 3 and is detailed in the ESI† (Section 9.5, Scheme S11).
Characterization of TaOx@MSNPs
The three types of TaOx@MSNPs and empty MSNPs were extensively characterized similarly as we did for the PLGA particles. All four MSNP variants formed stable suspensions in water with Table 2 listing hydrodynamic size and zeta potential. The average size of the empty MSNPs was ~ 120–140 nm with a PDI within 0.10–0.15. TaOx@MSNPs had a decrease in average size to 85–90 nm with a consequent increase in PDI within 0.15–0.20. As observed for the TaOx@MSNP-OH particles, crude NPs prior to removal of the CTAB template registered a wide PDI within 0.3–0.4 and a smaller hydrodynamic size of 40–45 nm. On removal of CTAB and further purification using dialysis, the NP size increased to 85–90 nm with a narrow PDI of 0.15–0.20. This trend was observed across all the three MSNP types and suggests that the removal of CTAB leads to enlargement of pores in solution that results in NP swelling and consequent increase in hydrodynamic size. There were also stark differences in the zeta potentials of the raw and clean MSNPs. For raw MSNPs, a positive zeta potential of + 35 mV was noted, however the removal of CTAB shifted the zeta potential to −27 mV. The change in zeta potential was in accordance with the alteration in surface functional groups; the presence of a positively charged ammonium bromide tail within the CTAB moiety results in positive zeta potential for raw MSNPs whereas removal of CTAB and the presence of –OH and the phosphonate surface groups leads to negative zeta potential. The SEM and TEM (inset) characterization for all four MSNP variants showed a homogenous spherical morphology (empty MSNPs; Figure S41, ESI†; TaOx@MSNP-OH; Figure 10a, b and Figure S44, ESI†; TaOx@MSNP-Phos; Figure 10c, d and Figure S47, ESI† and FITC-TaOx@MSNP; Figure 10e, f and Figure S50, ESI†) with no apparent agglomeration. The TEM images of the MSNPs offer a closer look at the intricate network of the pores within the MSNPs. For the various TaOx@MSNP types, encapsulation of individual TaOx NCs within the MSNP core was clearly visible in the TEM images. It is evident upon close inspection of the NPs that the TaOx NCs acted as a core seed for the generation of a mesoporous structure around it.
Figure 10.
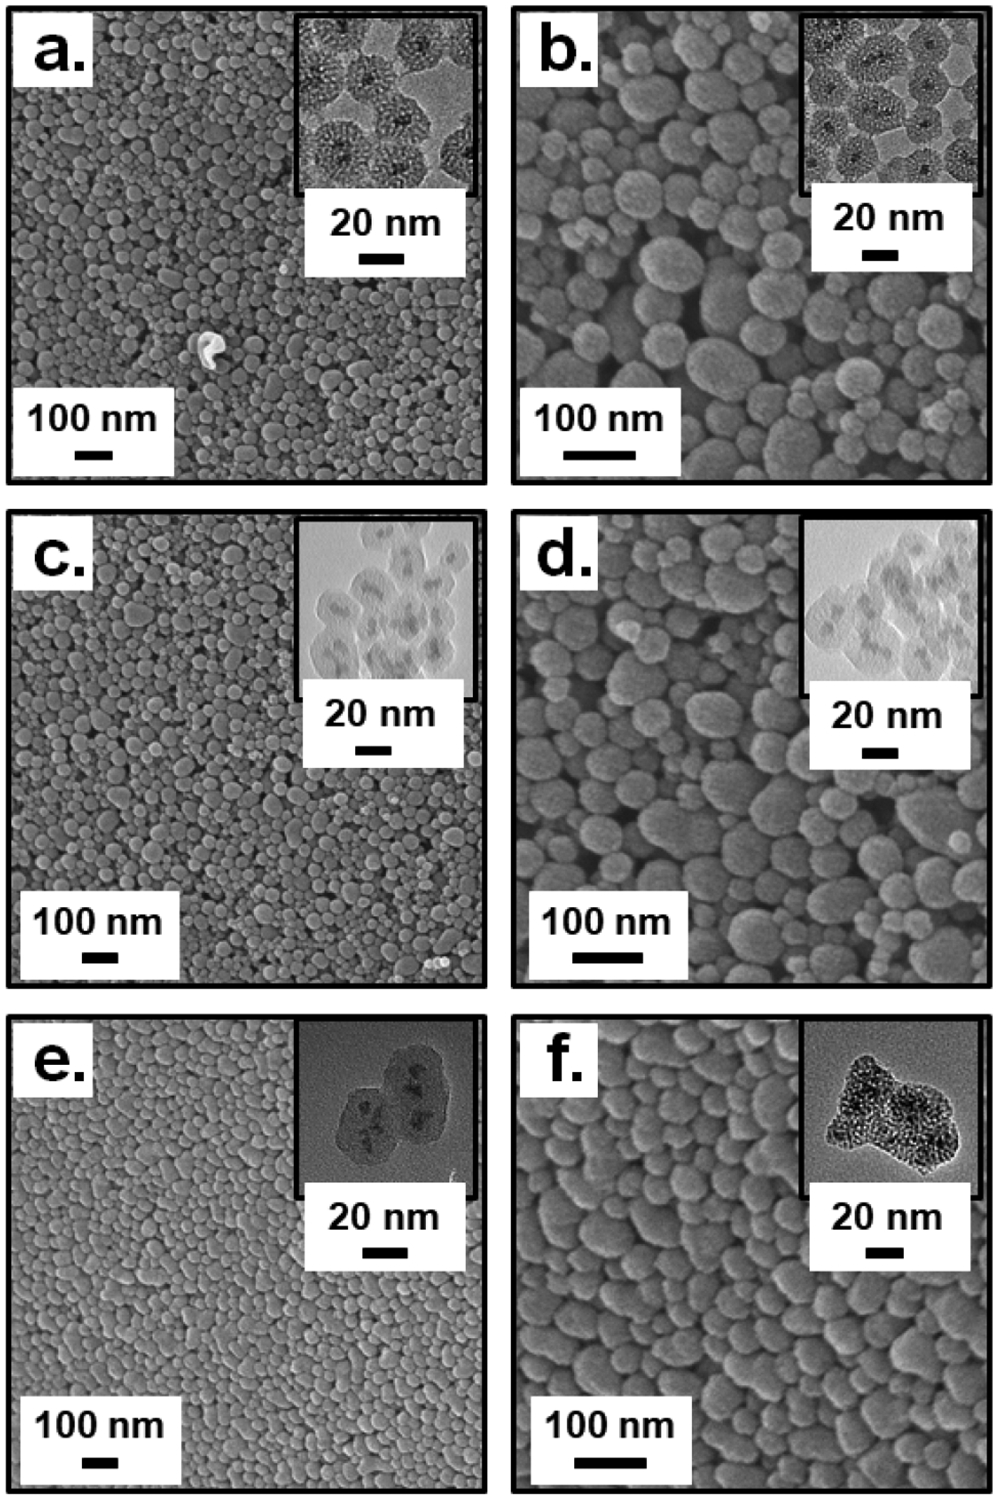
SEM and TEM (inset) characterization for a-b.) TaOx@MSNP-OH; c-d.) TaOx@MSNP-Phos and e-f.) FITC-TaOx@MSNP.
Encapsulation of iron oxide,78,79 gadolinium oxide,80 and gold NPs81,82 within MSNPs has also been reported, however, most of these NCs were hydrophobic and required aqueous phase transfer prior to encapsulation. We initially attempted this strategy and carried out the phase transfer of hydrophobic NCs by heating a solution of the NCs in chloroform with a solution of CTAB in water at the boiling point of the organic phase.83 However, this procedure was not efficient, as incomplete phase transfer of the NCs was observed leading to low yields and poor encapsulation within the MSNPs (unpublished results). The use of a partially hydrophilic TaOx NC2, as reported in this work, allowed us to circumvent the need for phase transfer, resulting in efficient encapsulation of the TaOx NCs in the MSNP matrix. Further, any excess, non-encapsulated TaOx NCs could be easily recovered during the purification step as the MSNPs were isolated as a residue during centrifugation leaving behind the excess NCs in the aqueous wash layer, which can be subsequently recovered following a simple dialysis step.
The EDS spectra for all MSNP types confirmed the presence of Ta, Si and P (Empty MSNPs; Figure S42, ESI†; TaOx@MSNP-OH; Figure S45, ESI†; TaOx@MSNP-Phos; Figure S48, ESI† and FITC-TaOx@MSNP; Figure S52, ESI†). The fluorescence spectra of the FITC-TaOx@MSNP suspended in PBS matched closely with that of free FITC (Figure S51, ESI†). The silane composition of the MSNPs, as well as the various surface chemistries, were verified by FTIR (empty MSNPs; Figure S41; TaOx@MSNP-OH; Figure S44; TaOx@MSNP-Phos; Figure S47 and FITC-TaOx@MSNP; Figure S50, ESI†). The FTIR spectra of empty MSNPs and the three TaOx@MSNP variants show the presence of Si-O-Si stretching vibration evident by a strong and broad band at 1096 cm−1. This band is akin to the network of Si-O-Si bonds that are fundamental to the MSNP structure (Figure S43, S46, S49 and S53, ESI†). Masked within that broad peak lies the sharp band at 1100 cm−1; representative of the Si-O-Si stretching vibrations due to the PEG-Silane coating on the TaOx NCs. In addition, the characteristic P=O stretching for the phospha-silane precursor, at 1233 cm−1 appears as a small, shoulder band masked by the broad Si-O-Si band for both the TaOx@MSNP-Phos (Figure S49, ESI†) and FITC-TaOx@MSNP (Figure S53, ESI†). A close inspection of the FTIR spectra of various TaOx@MSNP variants also reveals peaks that are representative of various surface functional groups; such as a network of H-bonded hydroxyl groups (broad bands at 3300–3400 cm−1). Further, the repeating PEG units (broad band ~1100 cm−1, superimposed with the asymmetric C-O-C stretching of the repeating -O-CH2-O-CH2-O- groups) and amine groups (IR peaks ~1634 cm−1 corresponding to the N-H bend) are also representative of varied surface functionalities. The TaOx NCs embedded within the MSNPs, resulted in high (39–45%) Ta content, with the highest Ta content observed for TaOx@MSNP-Phos NPs (Table 2).
Dissolution of TaOx NPs under lysosomal conditions
The dissolution of various TaOx NP formulations under lysosomal and cytosolic conditions were evaluated similarly as described earlier for NCs (detailed in Section 11 of the ESI†). The Ta dissolution for both the NP variants at pH 7.4 was low (< 3.5 %), comparable to TaOx NCs. Similarly, low dissolution (< 4%) was measured at pH 5.5 over the four weeks study period as shown in Figure 11 (Figure S54, ESI†). The low Ta dissolution can be traced back to the inert nature of the TaOx NCs that is not compromised during the encapsulation procedure.
Figure 11.
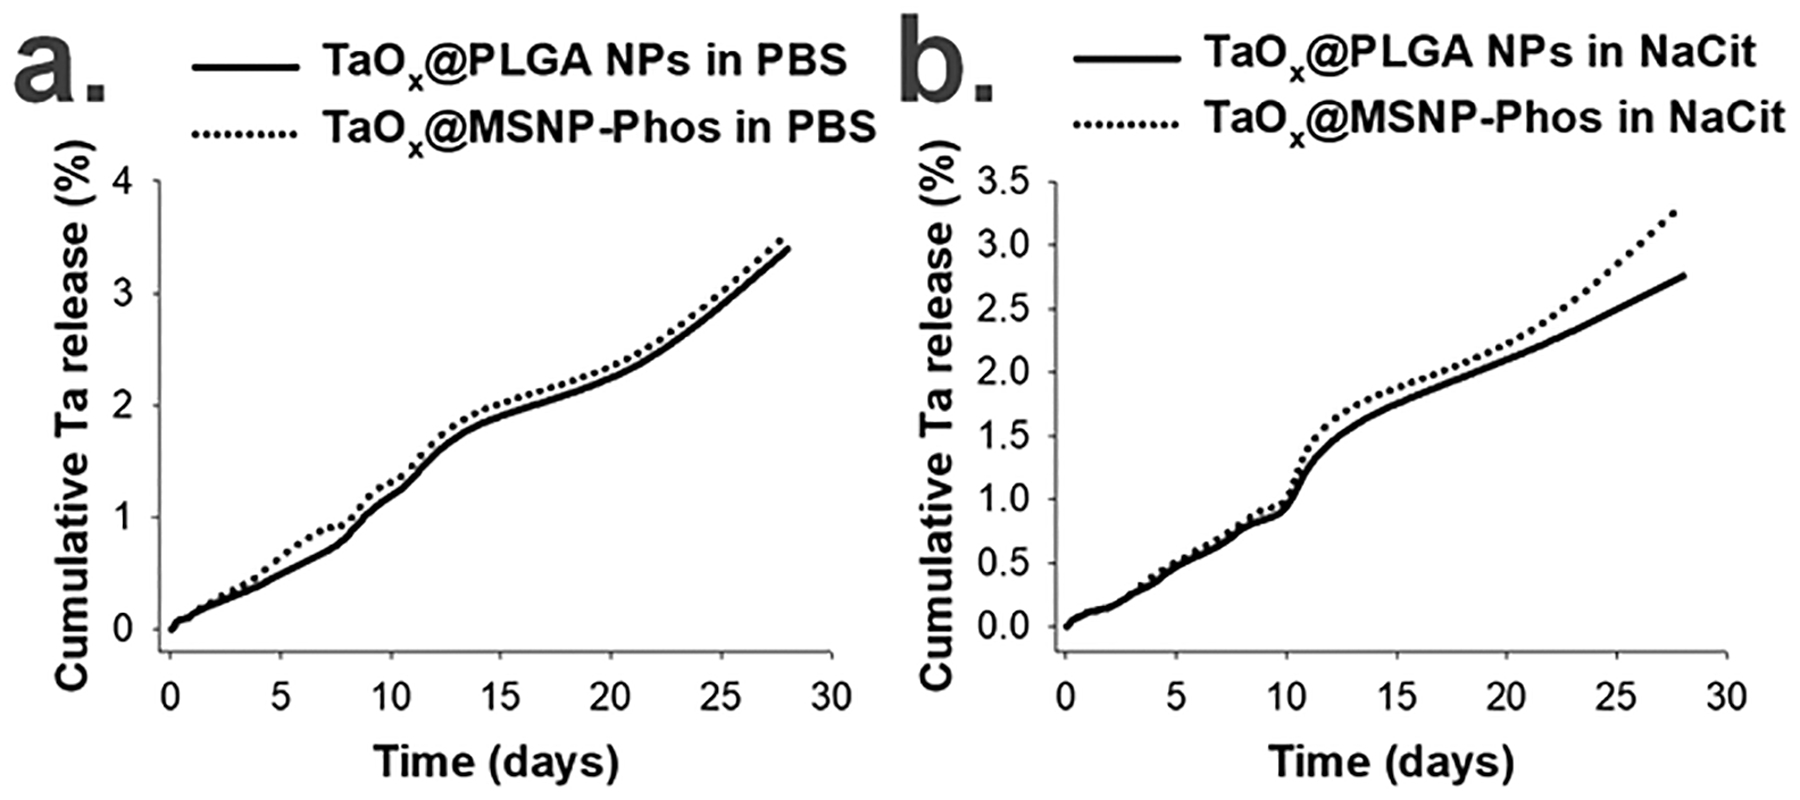
Ta dissolution from TaOx@PLGA NPs and TaOx@MSNP-Phos in (a.) PBS (pH 7.4) and (b.) sodium citrate (NaCit, pH 5.5) over 4 weeks using ICP-OES (n = 3, S.D. < 0.5).
In vitro viability and cell labeling by FITC-labeled TaOx NPs
To evaluate the cytocompatibility of various TaOx NPs, MTT colorimetric cell viability assays were carried out using RAW 264.7 macrophage cells and HEK 293 cells following 24 h incubation with varied NP concentrations (Section 12, ESI†). Two types of NPs, TaOx@PLGA NPs and TaOx@MSNP-OH, were selected as representative examples. High cytocompatibility, up to 1.2 mg mL−1 Ta, was measured in both cell lines (Figure 12a, b), similar to TaOx NCs.
Figure 12.
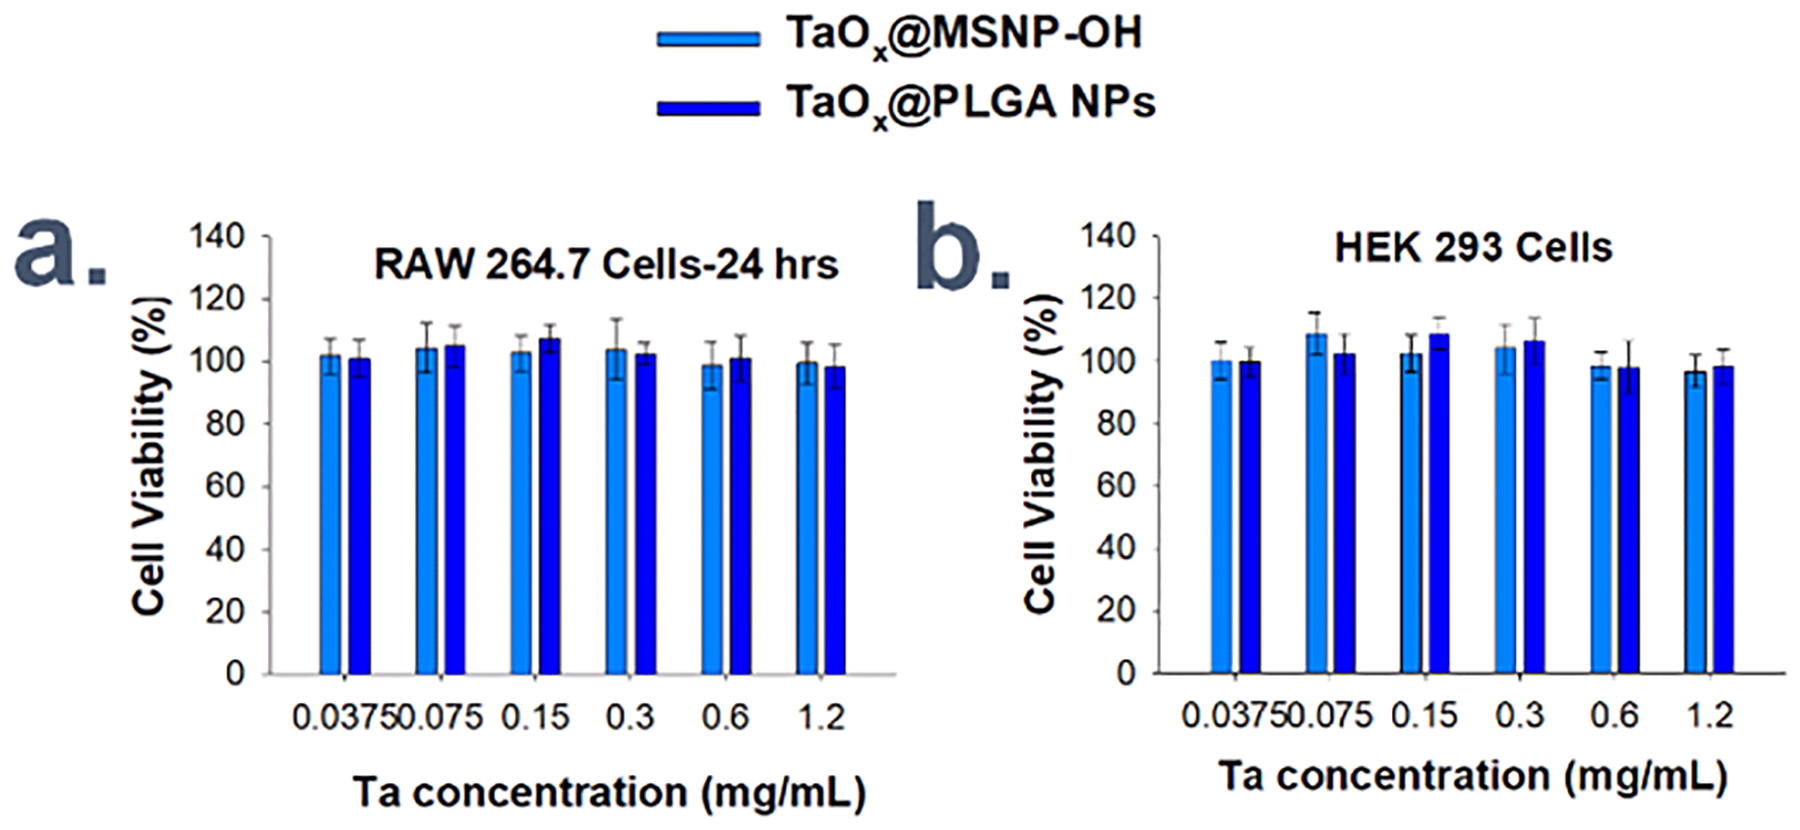
MTT cytotoxicity assay for different concentrations of TaOx@PLGA NPs and TaOx@MSNP-OH types incubated with cultured a.) RAW 264.7 macrophage cells and b.) HEK 293 fibroblast cells for 24 h each.
In vivo CT imaging of TaOx NPs:
To evaluate their CT potential in an in vivo setting mimicking the accumulation of NPs in a site such as a tumour, a series of experiments were performed where two concentrations of TaOx@PLGA NPs and TaOx@MSNP-Phos were injected intramuscular (IM) as a single bolus bilaterally in the right and left leg muscle in BALB/c mice (Section 13, ESI†). Concentrations of each NP were 27.4 mg kg−1 in saline (50 mM Ta) or 13.7 mg kg−1 in saline (25 mM Ta) for TaOx@PLGA NPs and 36.8 mg kg−1 in saline (50 mM Ta) or 18.4 mg kg−1 in saline (25 mM Ta) for TaOx@MSNP-Phos. Following IM injection of equimolar concentrations of TaOx@PLGA NPs and TaOx@MSNP-Phos, equivalent contrast enhancement is observed at the injection sites for each NP (Figure 13a). Different concentrations of both NP types (25 and 50 mM Ta in saline) were also injected IM as single, bolus injections bilaterally in the left and right leg, respectively (one male BALB/c mouse per NP formulation). On CT, the concentration variation at the site of injection is evident for both TaOx@PLGA NPs (Figure 13b) and TaOx@MSNP-Phos NPs (Figure 13c). To highlight the concentration difference, the CT images have been color coded (Figure 13; purple 25-mM Ta and blue-50 mM). The intelligent design and facile synthesis of the TaOx embedded NPs using inexpensive, readily available and FDA approved biocompatible materials serves as a stepping stone towards the development of CT CAs for dual energy and multi-color CT.
Figure 13.
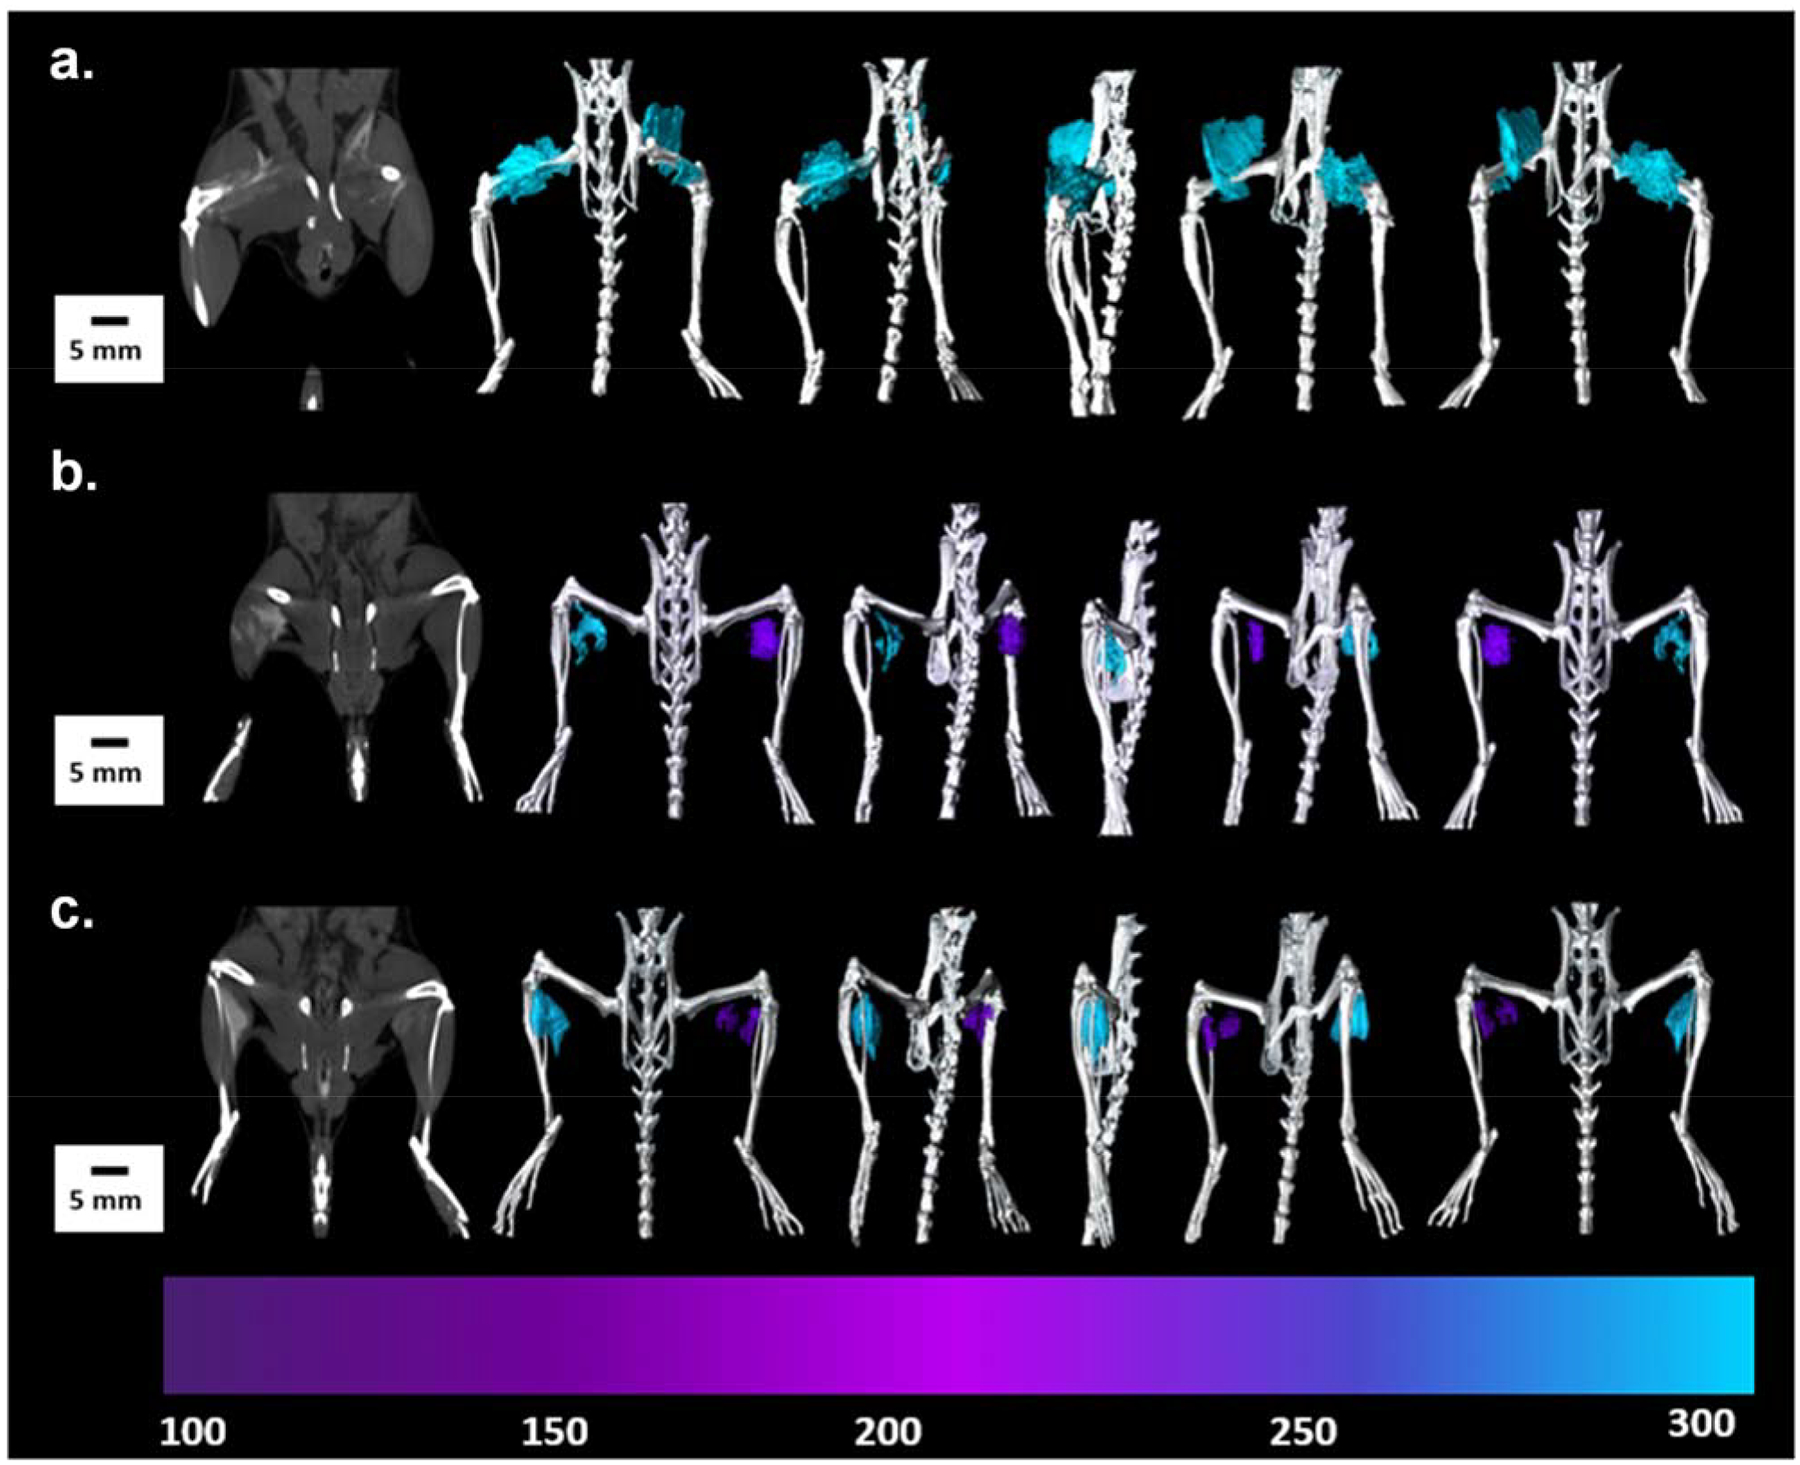
Immediate post injection micro-CT 3D image rendering of BALB/c mice a.) Single, 50 μL bolus of 50 mM TaOx@PLGA NPs and TaOx@MSNP-Phos; HU color map shows hyperintensity of the TaOx @MSNPs (left Leg) and TaOx@PLGA NPs (right leg); injections were administered between the superficial gluteal muscle and biceps femoris muscle. b.) single 50 μL bolus doses of TaOx@PLGA NPs, 50 mM and 25 mM Ta each; and c.) single 50 μL bolus doses of TaOx@MSNP-Phos, 50 mM and 25 mM Ta each. HU color maps shows hyperintensity of the 50 mM Ta dose (left leg) and 25 mM Ta dose (right leg). Injections were administered bilaterally (IM) between the gastrocnemius muscle and caudal tibial muscle.
Conclusions
In summary, we report hydrophilic and hydrophobic fluorescently labeled TaOx NCs with the highest Ta content reported to date. Cells maintain high in vitro cell viability (up to 2.4 mg Ta mL−1), and exhibit inconsequential Ta dissolution under both cytosolic and lysosomal conditions. Extremely hydrophilic TaOx NC1 produced high in vivo CT contrast in the vasculature following IV injection, with a prolonged blood circulation time, with no significant toxicity measured for the 100 mM Ta dose. Intraductal injection into the mammary pads of TaOx NC1 provides unprecedented in vivo imaging of ductal trees in rodents. Next, we successfully encapsulated TaOx NCs within PLGA and MSNPs to form TaOx@PLGA NPs and TaOx@MSNPs, respectively. These novel NP formulations had high Ta content, and cells incubated with these NPs maintained high in vitro cell viability (up to 1.2 mg Ta mL−1) and limited Ta dissolution. Both TaOx@PLGA NPs and TaOx@MSNPs produced effective CT contrast following a locally administered IM bolus in mice, mimicking the accumulation of such materials for drug delivery in a tumor, for example. To our knowledge, this is the first report detailing the encapsulation of individual TaOx NCs in biocompatible and FDA approved polymers resulting in NPs that can be used as versatile CAs for molecular imaging by CT.
Supplementary Material
Acknowledgements
This work has been supported by a MSU Foundation Strategic Partnership Grant and NIH grants R21 CA185163 (ES), R21 EB017881 (ES) and R21 CA226579 (LS). We are grateful to Dr. Per Askeland, Abigail Vanderberg and Dr. Richard J Staples, respectively for help with acquiring XPS, SEM and XRD images and various insightful discussions.
Footnotes
Electronic Supplementary Information (ESI) available: Detailed synthesis of NCs and NPs, in vitro, in vivo characterization and ESI figures. See DOI: 10.1039/x0xx00000x
Conflicts of interest
There are no conflicts to declare.
Notes and references
- 1.Yu SB and Watson AD, Chem. Rev, 1999, 99, 2353–2377. [DOI] [PubMed] [Google Scholar]
- 2.Yeh BM, FitzGerald PF, Edic PM, Lambert JW, Colborn RE, Marino ME, Evans PM, Roberts JC, Wang ZJ, Wong MJ and Bonitatibus PJ, Adv. Drug Deliv. Rev, 2017, 113, 201–222. [DOI] [PMC free article] [PubMed] [Google Scholar]
- 3.Hsieh J, Computed Tomography: Principles, Design, Artifacts, and Recent Advances, SPIE, Bellingham, WA, 3rd edn, 2015. [Google Scholar]
- 4.Pan D, Misra S and Kim S, in Nanomedicine, CRC Press, Boca Raton, FL, 2014, pp. 131–150. [Google Scholar]
- 5.Lusic H and Grinstaff MW, Chem. Rev, 2013, 113, 1641–1666. [DOI] [PMC free article] [PubMed] [Google Scholar]
- 6.Gaikwad HK, Tsvirkun D, Ben-Nun Y, Merquiol E, Popovtzer R and Blum G, Nano Lett, 2018, 18, 1582–1591. [DOI] [PMC free article] [PubMed] [Google Scholar]
- 7.Chen H, Rogalski MM and Anker JN, Phys. Chem. Chem. Phys, 2012, 14, 13469–13486. [DOI] [PMC free article] [PubMed] [Google Scholar]
- 8.Owen M, in Textbook of Veterinary Diagnostic Radiology, W.B. Saunders, 2018, pp. 96–109. [Google Scholar]
- 9.McCollough CH, Leng S, Yu L and Fletcher JG, Radiology, 2015, 276, 637–653. [DOI] [PMC free article] [PubMed] [Google Scholar]
- 10.Ai K, Liu Y, Liu J, Yuan Q, He Y and Lu L, Adv. Mater, 2011, 23, 4886–91. [DOI] [PubMed] [Google Scholar]
- 11.Liu Y, Ai K and Lu L, Acc. Chem. Res, 2012, 45, 1817–1827. [DOI] [PubMed] [Google Scholar]
- 12.Shilo M, Reuveni T, Motiei M and Popovtzer R, Nanomedicine, 2012, 7, 257–269. [DOI] [PubMed] [Google Scholar]
- 13.Pan D, Schirra CO, Wickline SA and Lanza GM, Contrast Media Mol. Imaging, 2014, 9, 13–25. [DOI] [PMC free article] [PubMed] [Google Scholar]
- 14.Cormode DP, Naha PC and Fayad ZA, Contrast Media Mol. Imaging, 2014, 9, 37–52. [DOI] [PMC free article] [PubMed] [Google Scholar]
- 15.Liu Y, Liu J, Ai K, Yuan Q and Lu L, Contrast Media Mol. Imaging, 2014, 9, 26–36. [DOI] [PubMed] [Google Scholar]
- 16.Cole LE, Ross RD, Tilley JM, Vargo-Gogola T and Roeder RK, Nanomedicine, 2015, 10, 321–341. [DOI] [PubMed] [Google Scholar]
- 17.Butts MD, Torres AS, FitzGerald PF, Colborn RE, Bonitatibus PJ, Yeh BM, Roberts JC and Lee BD, Invest. Radiol, 2016, 51, 786–796. [DOI] [PMC free article] [PubMed] [Google Scholar]
- 18.Bonitatibus PJ, Torres AS, Goddard GD, Fitzgerald PF and Kulkarni AM, Chem. Commun, 2010, 46, 8956–8958. [DOI] [PubMed] [Google Scholar]
- 19.Oh MH, Lee N, Kim H, Park SP, Piao Y, Lee J, Jun SW, Moon WK, Choi SH and Hyeon T, J. Am. Chem. Soc, 2011, 133, 5508–5515. [DOI] [PubMed] [Google Scholar]
- 20.Torres AS, Bonitatibus PJ, Colborn RE, Goddard GD, FitzGerald PF, Lee BD and Marino ME, Invest. Radiol, 2012, 47, 578–587. [DOI] [PubMed] [Google Scholar]
- 21.Bonitatibus PJ, Torres AS, Kandapallil B, Lee BD, Goddard GD, Colborn RE and Marino ME, ACS Nano, 2012, 6, 6650–6658. [DOI] [PubMed] [Google Scholar]
- 22.Kashfi-Sadabad R, Gonzalez-Fajardo L, Hargrove D, Ahmadi B, Munteanu D, Shahbazmohamadi S, Jay M and Lu X, Part. Part. Syst. Charact, 2019, 36, 1970010. [Google Scholar]
- 23.Wang N, Li H, Wang J, Chen S, Ma Y and Zhang Z, ACS Appl. Mater. Interfaces, 2012, 4, 4516–4523. [DOI] [PubMed] [Google Scholar]
- 24.Yu H, Zhu S, Yang X, Wang X, Sun H and Huo M, PLoS One, 2013, 8, e66447. [DOI] [PMC free article] [PubMed] [Google Scholar]
- 25.Kim J, Bar-Ness D, Si-Mohamed S, Coulon P, Blevis I, Douek P and Cormode DP, Sci. Rep, 2018, 8, 12119. [DOI] [PMC free article] [PubMed] [Google Scholar]
- 26.Freedman JD, Lusic H, Snyder BD and Grinstaff MW, Angew. Chemie - Int. Ed, 2014, 53, 8406–8410. [DOI] [PMC free article] [PubMed] [Google Scholar]
- 27.Reisman A, Holtzberg F, Berkenblit M and Berry M, J. Am. Chem. Soc, 1956, 78, 4514–4520. [Google Scholar]
- 28.Villars P and Cenzual K, Eds., TaOx (TaO2 tf) Crystal Structure: Datasheet from “PAULING FILE Multinaries Edition – 2012” in SpringerMaterials, https://materials.springer.com/isp/crystallographic/docs/sd_1501245. [Google Scholar]
- 29.Villars P and Cenzual K, Eds., TaOx (TaO0.9 tf) Crystal Structure: Datasheet from “PAULING FILE Multinaries Edition – 2012” in SpringerMaterials, https://materials.springer.com/isp/crystallographic/docs/sd_1501243. [Google Scholar]
- 30.Jin Y, Li Y, Ma X, Zha Z, Shi L, Tian J and Dai Z, Biomaterials, 2014, 35, 5795–5804. [DOI] [PubMed] [Google Scholar]
- 31.Feng S, Yue X, Ma X, Tian J, Dai Z, Jin Y and Liang X, Bioconjug. Chem, 2015, 26, 2530–2541. [DOI] [PubMed] [Google Scholar]
- 32.Liu Z, Song X, Yang K, Liang C, Song G, Yi X, Ji C and Dong Z, Biomaterials, 2016, 112, 257–263. [DOI] [PubMed] [Google Scholar]
- 33.Song G, Chen Y, Liang C, Yi X, Liu J, Sun X, Shen S, Yang K and Liu Z, Adv. Mater, 2016, 28, 7143–7148. [DOI] [PubMed] [Google Scholar]
- 34.Song G, Chao Y, Chen Y, Liang C, Yi X, Yang G, Yang K, Cheng L, Zhang Q and Liu Z, Adv. Funct. Mater, 2016, 26, 8243–8254. [DOI] [PMC free article] [PubMed] [Google Scholar]
- 35.Zhang S, Meng H, Yang X, Xu W, Ma X, Xu M, Jin Y and Tian J, Cancer Lett, 2017, 397, 61–71. [DOI] [PubMed] [Google Scholar]
- 36.Chen Y, Song G, Dong Z, Yi X, Chao Y, Liang C, Yang K, Cheng L and Liu Z, Small, 2017, 13, 1–10. [DOI] [PubMed] [Google Scholar]
- 37.Kenyon E, Westerhuis JJ, Volk M, Hix J, Chakravarty S, Claucherty E, Zaluzec E, Ramsey L, Madaj Z, Hostetter G, Eagleson B, Shapiro E, Moore A and Sempere LF, Breast Cancer Res, 2019, 21, 129. [DOI] [PMC free article] [PubMed] [Google Scholar]
- 38.Aillon KL, Xie Y, El-Gendy N, Berkland CJ and Forrest ML, Adv. Drug Deliv. Rev, 2009, 61, 457–466. [DOI] [PMC free article] [PubMed] [Google Scholar]
- 39.Shang L, Nienhaus K and Nienhaus GU, J. Nanobiotechnology, 2014, 12, 5. [DOI] [PMC free article] [PubMed] [Google Scholar]
- 40.V Jokerst J, Lobovkina T, Zare RN and Gambhir SS, Nanomedicine, 2011, 6, 715–728. [DOI] [PMC free article] [PubMed] [Google Scholar]
- 41.Suk JS, Xu Q, Kim N, Hanes J and Ensign LM, Adv. Drug Deliv. Rev, 2016, 99, 28–51. [DOI] [PMC free article] [PubMed] [Google Scholar]
- 42.Hackley VA and Clogston JD, in Characterization of Nanoparticles Intended for Drug Delivery, ed. McNeil SE, Humana Press, Totowa, NJ, 2011, pp. 35–52. [Google Scholar]
- 43.Lecuyer S, Quemerais A and Jezequel G, Surf. Interface Anal, 1992, 18, 257–261. [Google Scholar]
- 44.Walkey CD, Olsen JB, Guo H, Emili A and Chan WCW, J. Am. Chem. Soc, 2012, 134, 2139–2147. [DOI] [PubMed] [Google Scholar]
- 45.Sabella S, Carney RP, Brunetti V, Malvindi MA, Al-Juffali N, Vecchio G, Janes SM, Bakr OM, Cingolani R, Stellacci F and Pompa PP, Nanoscale, 2014, 6, 7052–7061. [DOI] [PMC free article] [PubMed] [Google Scholar]
- 46.Zhang H, Chen B and Banfield JF, J. Phys. Chem. C, 2010, 114, 14876–14884. [Google Scholar]
- 47.Misra SK, Dybowska A, Berhanu D, Luoma SN and Valsami-Jones E, Sci. Total Environ, 2012, 438, 225–232. [DOI] [PubMed] [Google Scholar]
- 48.Peretyazhko TS, Zhang Q and Colvin VL, Environ. Sci. Technol, 2014, 48, 11954–11961. [DOI] [PubMed] [Google Scholar]
- 49.Gwak GH, Lee WJ, Paek SM and Oh JM, Colloids Surfaces B Biointerfaces, 2015, 127, 137–142. [DOI] [PubMed] [Google Scholar]
- 50.Avramescu M-L, Rasmussen PE, Chénier M and Gardner HD, Environ. Sci. Pollut. Res, 2017, 24, 1553–1564. [DOI] [PMC free article] [PubMed] [Google Scholar]
- 51.FitzGerald PF, Colborn RE, Edic PM, Lambert JW, Torres AS, Bonitatibus PJ and Yeh BM, Radiology, 2016, 278, 723–733. [DOI] [PMC free article] [PubMed] [Google Scholar]
- 52.Mannheim JG, Schlichthaerle T, Kuebler L, Quintanilla-Martinez L, Kohlhofer U, Kneilling M and Pichler BJ, Contrast Media Mol. Imaging, 2016, 11, 272–284. [DOI] [PubMed] [Google Scholar]
- 53.Bae KT, Radiology, 2010, 256, 32–61. [DOI] [PubMed] [Google Scholar]
- 54.Swy ER, Schwartz-Duval AS, Shuboni DD, Latourette MT, Mallet CL, Parys M, Cormode DP and Shapiro EM, Nanoscale, 2014, 6, 13104–13112. [DOI] [PMC free article] [PubMed] [Google Scholar]
- 55.Chakravarty S, Unold J, Shuboni-Mulligan DD, Blanco-Fernandez B and Shapiro EM, Nanoscale, 2016, 8, 13217–13222. [DOI] [PMC free article] [PubMed] [Google Scholar]
- 56.Nkansah MK, Thakral D and Shapiro EM, Magn. Reson. Med, 2011, 65, 1776–1785. [DOI] [PMC free article] [PubMed] [Google Scholar]
- 57.Blanco-Fernandez B, Chakravarty S, Nkansah MK and Shapiro EM, Acta Biomater, 2016, 45, 276–285. [DOI] [PMC free article] [PubMed] [Google Scholar]
- 58.Bennewitz MF, Williams SS, Nkansah MK and Shapiro EM, J. Nanosci. Nanotechnol, 2013, 13, 3778–3783. [DOI] [PubMed] [Google Scholar]
- 59.Bennewitz MF, Lobo TL, Nkansah MK, Ulas G, Brudvig GW and Shapiro EM, ACS Nano, 2011, 5, 3438–3446. [DOI] [PMC free article] [PubMed] [Google Scholar]
- 60.Shapiro EM, Magn. Reson. Med, 2015, 73, 376–389. [DOI] [PMC free article] [PubMed] [Google Scholar]
- 61.Li Z, Barnes JC, Bosoy A, Stoddart JF and Zink JI, Chem. Soc. Rev, 2012, 41, 2590–2605. [DOI] [PubMed] [Google Scholar]
- 62.Croissant JG, Fatieiev Y, Almalik A and Khashab NM, Adv. Healthc. Mater, 2018, 7, 1700831. [DOI] [PubMed] [Google Scholar]
- 63.Wu S-H, Mou C-Y and Lin H-P, Chem. Soc. Rev, 2013, 42, 3862. [DOI] [PubMed] [Google Scholar]
- 64.Zheng X-Y, Pellico J, Khrapitchev AA, Sibson NR and Davis JJ, Nanoscale, 2018, 10, 21041–21045. [DOI] [PubMed] [Google Scholar]
- 65.Ren S, Yang J, Ma L, Li X, Wu W, Liu C, He J and Miao L, ACS Appl. Mater. Interfaces, 2018, 10, 31947–31958. [DOI] [PubMed] [Google Scholar]
- 66.Denk C, Svatunek D, Mairinger S, Stanek J, Filip T, Matscheko D, Kuntner C, Wanek T and Mikula H, Bioconjug. Chem, 2016, 27, 1707–1712. [DOI] [PubMed] [Google Scholar]
- 67.Ni D, Jiang D, Ehlerding EB, Huang P and Cai W, Acc. Chem. Res, 2018, 51, 778–788. [DOI] [PMC free article] [PubMed] [Google Scholar]
- 68.Lee C-H, Cheng S-H, Wang Y-J, Chen Y-C, Chen N-T, Souris J, Chen C-T, Mou C-Y, Yang C-S and Lo L-W, Adv. Funct. Mater, 2009, 19, 215–222. [Google Scholar]
- 69.Lee JE, Lee N, Kim H, Kim J, Choi SH, Kim JH, Kim T, Song IC, Park SP, Moon WK and Hyeon T, J. Am. Chem. Soc, 2010, 132, 552–557. [DOI] [PubMed] [Google Scholar]
- 70.Martins Estevão B, Miletto I, Marchese L and Gianotti E, Phys. Chem. Chem. Phys, 2016, 18, 9042–9052. [DOI] [PubMed] [Google Scholar]
- 71.Shi S, Chen F, Goel S, Graves SA, Luo H, Theuer CP, Engle JW and Cai W, Nano-Micro Lett, 2018, 10, 65. [DOI] [PMC free article] [PubMed] [Google Scholar]
- 72.Wang X, Chen H, Zheng Y, Ma M, Chen Y, Zhang K, Zeng D and Shi J, Biomaterials, 2013, 34, 2057–2068. [DOI] [PubMed] [Google Scholar]
- 73.Chen F, Ma M, Wang J, Wang F, Chern S-X, Zhao ER, Jhunjhunwala A, Darmadi S, Chen H and Jokerst JV, Nanoscale, 2017, 9, 402–411. [DOI] [PMC free article] [PubMed] [Google Scholar]
- 74.Singh RK, Patel KD, Leong KW and Kim H-W, ACS Appl. Mater. Interfaces, 2017, 9, 10309–10337. [DOI] [PubMed] [Google Scholar]
- 75.von Baeckmann C, Guillet-Nicolas R, Renfer D, Kählig H and Kleitz F, ACS Omega, 2018, 3, 17496–17510. [DOI] [PMC free article] [PubMed] [Google Scholar]
- 76.Ciesla U and Schüth F, Microporous Mesoporous Mater, 1999, 27, 131–149. [Google Scholar]
- 77.Kim D, Zuidema JM, Kang J, Pan Y, Wu L, Warther D, Arkles B and Sailor MJ, J. Am. Chem. Soc, 2016, 138, 15106–15109. [DOI] [PubMed] [Google Scholar]
- 78.Sun K, Gao Z, Zhang Y, Wu H, You C, Wang S, An P, Sun C and Sun B, J. Mater. Chem. B, 2018, 6, 5876–5887. [DOI] [PubMed] [Google Scholar]
- 79.Chen W, Cheng C-A and Zink JI, ACS Nano, 2019, 13, 1292–1308. [DOI] [PubMed] [Google Scholar]
- 80.Zeleňák V, Zeleňáková A, Kapusta O, Hrubovčák P, Girman V and Bednarčík J, RSC Adv, 2019, 9, 3679–3687. [DOI] [PMC free article] [PubMed] [Google Scholar]
- 81.Carrasco S, Benito-Peña E, Navarro-Villoslada F, Langer J, Sanz-Ortiz MN, Reguera J, Liz-Marzán LM and Moreno-Bondi MC, Chem. Mater, 2016, 28, 7947–7954. [Google Scholar]
- 82.Ramya AN, Joseph MM, Maniganda S, Karunakaran V, T. T. S and Maiti KK, Small, 2017, 13, 1700819. [DOI] [PubMed] [Google Scholar]
- 83.Kim J, Kim HS, Lee N, Kim T, Kim H, Yu T, Song IC, Moon WK and Hyeon T, Angew. Chemie Int. Ed, 2008, 47, 8438–8441. [DOI] [PubMed] [Google Scholar]
Associated Data
This section collects any data citations, data availability statements, or supplementary materials included in this article.


