

Abstract
Fourier transform infrared (FTIR) spectroscopy has long been a powerful tool for structural analysis of membrane proteins. However, because of difficulties in resolving contributions from individual residues, most of the derived measurements tend to yield average properties for the system under study. Isotope editing, through its ability to resolve individual vibrations, establishes FTIR as a method that is capable of yielding accurate structural data on individual sites in a protein.
Introduction
The electromagnetic spectrum between visible and microwave radiation is known as infrared light. Its wavelength range (750 nm–1 mm) corresponds to energies that overlap the vibrational transitions in molecules. These transitions, in turn, provide a wealth of information about the sample in question — for example, couplings between vibrational modes due to proximity; frequency shifts caused by hydrogen bonding or the particular electrostatic properties of the environment; and the orientation of a particular group relative to the laboratory frame. This, together with the sensitivity of modern spectrometers makes Fourier transform infrared (FTIR) spectroscopy a popular tool for molecular analysis.
In applying FTIR spectroscopy to the study of biological samples two problems are frequently encountered. The first is the water stretching and bending modes at ca. 3200–3700 cm−1 and 1600–1630 cm−1, respectively,1 which dominate the IR spectra of any dilute biological sample. When studying water-soluble proteins, it is possible to overcome this problem partially through the use of highly concentrated specimens, short sample path lengths, and/or use of D2O. In contrast, membrane proteins are particularly suited for examination by FTIR spectroscopy. Here, water opacity is much less of a problem because the lipid bilayer is the dominant solvent of the protein. Hence, after the removal of bulk water, membrane proteins can readily be studied by FTIR in their native environment — the lipid membrane.
The second problem that limits the usefulness of IR spectroscopy as a tool for the structural study of biological macromolecules is spectral resolution. In other words, the width of a single vibrational mode is often significantly larger than the differences between individual vibrations. Therefore, traditional IR spectroscopy yields information that pertains to the average properties of a protein or that which is obtained because of coupling between numerous modes. The advent of isotope editing in IR spectroscopy of proteins has alleviated this problem to an extent, because of the ability of isotopomers to shift the vibrational frequency to a ‘transparent’ region of the spectrum. If we assume that the vibrational mode between atoms a and b behaves as a harmonic oscillator, its frequency, will change upon isotope editing of atom a to c and b to d as follows:
whereby m a, m b, m c and m d are the masses of atoms a, b, c and d. Atoms a ↔ c and b ↔ d are isotopomeric pairs.
Note that the above equation indicates that the frequency shift is highly dependent on relative, not absolute, mass change. For example, the amide A vibrational mode (mostly the N—H stretch) at ca. 3300 cm−1 will shift −890 cm−1 upon deuteration (14N— 1H → 14N— 2H) but only −7 cm−1 upon isotope labeling of the nitrogen (14N— 1H → 15N— 1H). This is due to a relative change of 100% with regard to the hydrogen atom mass in the first case, versus a relative change of 7% with regard to the nitrogen atom mass, in the second case. Thus, because of its ability to isolate an individual vibration, isotope-edited FTIR spectroscopy is a powerful tool that can yield precise information regarding the labeled site. Moreover, it does so with minimal interference, because isotopomeric species are normally completely silent with respect to the chemical nature (e.g., structural perturbation) of the examined protein.
Here, I review some of the recent results from studies that used isotope-edited infrared spectroscopy of membrane proteins. Because of length restrictions I am unable to cover all the relevant studies. The data are presented such that studies that utilize similar spectroscopic tools are grouped together, rather than those that study similar biological systems.
Secondary structure
In proteins, the most prominent absorptions of infrared light are those of the peptidic backbone, and are therefore called the amide modes. The most dominant amongst these is the amide I mode, which has been studied extensively [1] and shown to be dominated by the C O stretching motion. The absorption of the amide I mode occurs between 1600 and 1700 cm−1 (6.25–5.88 μm), and its frequency has long been used as a marker for the secondary structure of the protein in question: modes centered around 1655 cm−1 correspond mostly to α-helical structures, whereas a central mode centered around 1630 cm−1 and a minor mode at ca. 1690 cm−1 correspond mostly to β-sheet secondary structure elements (for reviews, see [1, 2, 3, 4]).
Because of its ability to derive secondary structure information, traditional FTIR spectroscopy is an alternative to circular dichroism (CD) spectroscopy. FTIR is particularly well suited to the study of membrane proteins because it does not suffer from the differential absorption flattening observed in CD spectra of membrane proteins [5].2 Furthermore, the advent of site-specific isotopic incorporation in peptides has enabled the first rapid site-specific secondary structure measurement [6].
The procedure for using isotope-edited IR spectroscopy to determine secondary structure involves labeling the protein of interest with an amino acid bearing an isotope-labeled carboxylic group (13C 16O or 13C 18O), measuring the FTIR spectrum of the resultant protein in the amide I region (1560–1700 cm−1), and determining the frequency of the isotope-edited peak. The −40 cm−1 shift that results from 13C 16O incorporation yields an isotope-edited mode present as a shoulder on the natural (unlabeled) 12C 16O peak (see Figure 1 ). Furthermore, the natural abundance of 13C (1.1%) maintains that in any protein with 90 amino acids or more, the contribution of non-labled 13C is as much, or more than that of the label. To overcome the above shortcomings, we often utilize the 13C 18O label [7, 8]. The frequency shift of −65 cm−1 places the isotope-edited absorption band so that it is nearly base-line resolved from the much larger 12C 16O mode, and the natural abundance of the 13C 18O label (1.1% × 0.2% = 0.0026%) is negligible.
Figure 1.

FTIR spectra of the influenza A M2 transmembrane domain (25 amino acids) reconstituted in lipid bilayers [23]. The spectra shown are of samples with no label (gray line), a single 13C 16O label (dashed line) or a single 13C 18O label (black line). The location of the unlabeled and labeled peaks are shown.
Based on the nature of the label, one determines the frequency from which it ‘originated’, and its corresponding secondary structure. For example, a 13C 16O isotope-edited peak at 1615 cm−1 indicates that the site is helical, because without isotopic labeling it would resonate at 1655 cm−1, which is typical of α-helical segments [1, 2]. In large proteins, it is useful to compare the results with spectra of an unlabeled protein to verify that the suspected peak originates from the isotopically labeled amino acid. Finally, we note that in the above procedure, any coupling differences between isotope and non-isotope bands are neglected, thereby assuming similar frequency shifts regardless of the secondary structure.
Examples
Site-specific analysis of secondary structures is particularly useful in proteins that are composed from different secondary structure elements. For example, work from two groups on the HIV-1 gp41 fusion protein has been able to identify topological elements in the protein that might change upon interaction with the lipid bilayer. Because the fusion protein has been shown to contain both α-helical and β-sheet elements, both Waring and co-workers [9•, 10] and Shai and co-workers [11•] have labeled the amino terminal residues of the protein with 13C 16O. This enabled both groups to assign a β-sheet secondary structure to the N-terminal domain of the protein, although there is still some disagreement as to whether the β-sheet is composed of parallel [11•] or anti-parallel [9•] strands.
Axelsen and co-workers have used internal reflection spectroscopy to analyze a hexapeptide containing 13C 16O labels, that partitions into the lipid bilayer [12••]. Excitonic model simulations and comparisons with the measured spectra enabled the authors to show conclusively that the peptide forms an anti-parallel β-sheet in the membrane, and that the spectra are modulated by the vibrational couplings both in individual strands and between them. Barry and co-workers [13••], on the other hand, have analyzed a significantly larger protein: the lactose permease (LacY), which contains 417 amino acid residues. The authors performed a ‘reaction-induced difference FTIR’, in which a reaction is initiated by changing the sample conditions and the resulting difference in the FTIR spectra is recorded. By using LacY uniformly labeled with 13C and 15N the authors were able to assign peaks in the difference spectra at 1765–1730 cm−1 to carboxylic groups as well as to assign additional spectral features to contributions of other side chain moieties such as lysine, arginine, histidine and the amidic residues. Future studies employing site-specific labeling strategies may enable the exact pinpointing of residues responsible for the derived spectral features in the reaction-induced difference spectra.
Structure and orientation
The absorption of light is proportional to the squared scalar product of the electric field vector and the dimensionless transition dipole moment of the vibrational mode. Thus, polarized spectroscopy of a macroscopically aligned sample can determine the orientation of a particular chromophore if the geometry of the transition dipole moment in relation to the chromophore's principal axis is known. Because it is very easy to macroscopically align membrane proteins by depositing them in membrane stacks, this methodology has been used extensively in infrared spectroscopy to determine the average tilt angle of helices based on a simple linear dichroism experiment (see Figure 2 for a schematic representation). Specifically, the measurement of the absorption ratio between parallel and perpendicular polarized light (relative to the membrane plane) can yield the orientation of the molecule in question (for review see [14, 15, 16]).
Figure 2.

Schematic representation of the effect of helix geometry upon the dichroisms of three arbitrary vibrations shown in blue, yellow and green. In the left model, the three different vibration transition dipole moments are all equally aligned with respect to the z axis and hence exhibit the same dichroism. However, tilting the helix by the angle β in the middle structure now results in the green mode having the highest dichroism because it is the least tilted with respect to the z axis. Finally, rotation about the helix director by the angle ω reverses the dichroism ratio, causing the blue mode to exhibit the highest dichroism.
One limitation complicating the above approach is sample disorder, which results in the fact that the measured dichroism is no longer solely a function of the orientation of the sample, but also of its level of order. Although it is possible to model this disorder using different distribution functions [17, 18, 19], it remains essential to experimentally determine the sample disorder to deconvolve the orientational information from the measured dichroism. Without disorder deconvolution, FTIR dichroism will only yield an order parameter, which is of little use for high-resolution structural analysis.
Recent studies have used X-ray reflectivity to independently measure the membrane mosaicity, and as such have presented a simple route for deriving accurate orientational information directly from FTIR dichroism measurements [20••]. The above methods, in combination with isotopic labeling, enable one to derive accurate orientational restraints for a membrane protein in its native environment [21, 22••]. These restraints can later be used to obtain highly reliable structural models of the protein in question (e.g. [7, 23, 24, 25, 26, 27••]).
Examples
Two studies from the Arkin group [26, 27••] demonstrate the utility of site-specific FTIR spectroscopy in deriving accurate orientational restraints for membrane proteins. In analyzing the transmembrane helical bundle formed by the T-cell receptor CD3-ζ component, the authors employed 11 different peptides, each containing a 13C 18O label in a unique position. The site-specific dichroism for each of the peptides was used to derive an orientational restraint for each of the respective carbonyl groups. These restraints were then implemented as orientational refinement energy terms in molecular dynamics simulations, leading to a structure for the protein complex that correlated well with evolutionary conservation information [28]. The data were sufficiently accurate to detect a kink in the transmembrane helices that resulted in asymmetrical water accessibility to the amino and carboxy termini of the helical bundle. This pattern of water accessibility was later confirmed by 2D IR studies, as elaborated below [29••].
In a similar effort, 10 different peptides, each with a uniquely inserted 13C 18O label, were used to study the trimerizing MHC class II-associated invariant chain transmembrane domain structure [26]. The dichroisms of the isotope-edited modes were obtained for each of the labels and were used to derive a structure of the transmembrane helical bundle as in the case of CD3-ζ (see above). Once again, the structure correlated well with experimental data, placing key residues such as Gln47 and Thr50 in the core of the bundle.
A different type of study was recently conducted [30••] to experimentally measure the strength of the glycine hydrogen bond predicted to be present in transmembrane helices [31] (see Figure 3 ). The study employed two different peptides, corresponding to the dimeric and the (mutant) monomeric transmembrane domains of the human glycophorin A [32]. Gly79 was exchanged for a glycine in which the two Cα hydrogens were replaced with deuteriums. This enabled the authors to selectively measure the glycine CD2 stretching frequency and to determine the effects of hydrogen bond formation thereupon. The results of the study show a 6 cm−1 difference between the peak of the monomeric and the dimeric glycine CD2 stretching mode, indicating that in the dimeric form the methylene group is hydrogen bonded to the C O group in the opposing helix, as predicted [31]. Using an empirical correlation obtained from a large number of compounds [33], the authors were able to derive the enthalpy of the bond as 0.88 kcal/mol [30••].
Figure 3.

Structure of the bond predicted to take place in the transmembrane domain of human glycophorin A [31] and measured experimentally using isotope-edited FTIR [30••].
Mechanistic insights
FTIR spectroscopy has long been a particularly powerful tool for analyzing protein function and mechanism of action. This is because vibrational modes may be influenced by factors such as hydrogen bonding, solvation and bond deformation, thereby serving as excellent probes of the local structure in areas of interest. The ability to spectroscopically select a certain site in the protein to observe, through isotopic labeling, makes this technique particular powerful. This normally means that the most challenging part in the experimental scheme is the introduction of the label at the location of choice (see Conclusions section).
Examples
The light-driven H+ pump bacteriorhodopsin (BR) has been a popular system for biophysical investigation. Its photocycle in particular has been studied in detail, in the context of the high-resolution structure of the protein [34]. Recent studies from the Braiman [35•], Kandori [36•] and Rothschild [37••] groups (amongst others) utilizing isotope-edited FTIR demonstrate the advantageousness of the method. Rothschild and co-workers have studied the influence of incorporating selenomethionine in a cell-free expression system on the spectral properties of BR [37••]. To show that the particular modes at 1284 cm−1 were due to the incorporated selenomethionine and not to tyrosine, they compared the spectra with those obtained from proteins that were labled with selenomethionine and l-tyrosine-[ring]-d4. This enabled the authors to show conclusively that the introduced selenomethionine is responsible for the modes at 1284 cm−1.
The groups of Kandori [35•] and Braiman [36•] have used arginine labels to study the BR photocycle. Kandori and co-workers labeled BR with [η(1,2)-15N]-arginine and were able to identify perturbations in the arginine hydrogen bonding [35•]. Moreover, analysis of the different states in the BR photocycle enabled the authors to show that in the photocycle intermediate L this perturbation is relaxed. Braiman and co-workers used the same selective arginine label as well as a uniformly 15N-labled arginine in their study [36•] and were able to assign a prominent mode at 1555 cm−1 as the perturbed arginine C—N stretch in the BR photocycle intermediate M. Comparison with model compounds has indicated that this perturbed mode might occur due to light-induced deprotonation of the arginine guanidino moiety.
2D IR spectroscopy
One of the most exciting advances in the field of infrared spectroscopy has been the development of multidimensional methods (see for review [38]). In analogy to multidimensional NMR, 2D IR spectroscopy can be used to simplify the interpretation of complex single dimensional spectra, providing information about the coupling (and by inference, the distance and angles) between individual vibrations. In addition, 2D IR has the ability to probe the dynamics of molecules in time regimes that are inaccessible to most other methods, providing information on the dynamics of structures and environments down to the femtosecond regime (see Figure 4 ).
Figure 4.
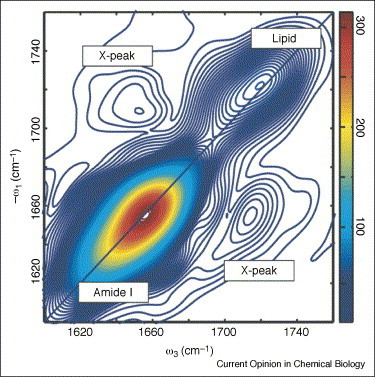
2D IR spectrum of the transmembrane helical bundle formed by the T-cell receptor CD3-ζ component reconstituted in lipid bilayers. The spectrum exhibits cross peaks between the amide I band of the protein and the lipid head-group ester carbonyl, providing proof that peptide backbone and membrane head-groups are strongly coupled.
Examples
Because multidimensional IR spectroscopy is a very recent technique, its application to the study of proteins in general, and membrane proteins in particular has been limited. However, two recent studies from the Zanni group on the transmembrane domain of CD3-ζ demonstrate the promise that the approach possesses. In the first study of a membrane protein by 2D IR [39••] the authors measured the homogeneous and inhomogeneous linewidths of the single 13C 18O labled site and compared that with the entire peptide amide I (arising from the 12C 16O modes). This study was later extended to 11 different 13C 18O residues along the entire length of the transmembrane peptide [29••]. The analysis pointed to the fact that although all sites exhibit the same homogeneous broadening, they differed substantially in their inhomogeneous linewidths. Comparison of experiments with simulations indicate water accessibility of the protein backbone as the primary cause that affects the dynamical behavior of the different sites. The differential water accessibility correlated well with the structural model of the protein [27••].
Exposure to solvent
Amide H+/D+ exchange is another example of the use of isotopes in FTIR spectroscopy. This method can readily determine the percentage of a membrane protein that is in direct contact with the aqueous solvent [40••]. The principle of the method is that amide H+/D+ exchange will not take place in the hydrophobic milieu of the lipid bilayer. Thus, monitoring the reduction of the amide II mode (mostly the amide N—H deformation mode) at ca. 1540 cm−1, which is caused by exposure of the sample to D2O, will yield an accurate assessment of the number of residues that are accessible to the solvent (see Figure 5 for an example).
Figure 5.

FTIR spectra of the transmembrane domain of SARS coronavirus E protein reconstituted in phospholipid bilayers [47] in the amide I and amide II regions. The spectra were obtained after flushing air saturated with H2O (solid line) or D2O (dotted line) over the sample. Both spectra were normalized so as to adjust the absorption of the amide I mode (1658 cm−1) to 1.0 OD. Note the reduction that takes place in the amide II mode (1545 cm−1) upon D2O exchange.
Examples
Simple hydropathy algorithms predict the topology of a membrane protein, and by inference, the number of residues that span the membrane. However, in numerous membrane proteins, large aqueous cavities and vestibules result in many of the residues in the transmembrane helices undergoing H+/D+ exchange as well. Lancaster and co-workers [41•] have recently studied Wolinella succinogenes quinol:fumarate reductase focusing on the role of a key carboxylic residue (Glu-C180) in the function of the protein. Usng site-directed mutagenesis along with H+/D+ exchange the authors were able to show that Glu-C180, located in the transmembrane segment of the protein, undergoes protonation and deprotonation as evidenced by peak changes at 1733–1741 cm−1. Goormaghtigh and co-workers [40••] used H+/D+ exchange to study structural dynamics in the gastric H+,K+ ATPase. In their analysis, using attenuated total internal reflection spectroscopy, the authors showed that the H+/D+ exchange kinetics are intimately correlated with the molecular movements of the protein. Because these movements may be correlated with the catalytic cycle of the protein, they provide insight into the kinetics and structural transitions that the enzyme undergoes.
In a demonstration of technique sensitivity, Vogel and co-workers [42••] have used microscope FTIR spectroscopy to observe nanogram quantities of the serotonin and acetylcholine receptors in fully hydrated protein films. From H+/D+ exchange analysis the authors were able to determine the secondary structure of the proteins and to show that the water-accessible percentage of both proteins is similar, as predicted in previous studies.
Conclusions
From the numerous examples of experiments now using isotope-edited FTIR, it is clear that it is a powerful technique that is particularly applicable to the study of membrane proteins, and that it can provide rich information on the structure and mechanism of the protein in question. One obvious limitation that must be considered is the ability to label the target protein. Two categories of proteins should therefore be considered for FTIR analysis: those that can, and those that cannot be made synthetically. Inserting a label into a synthetic protein is trivial — it is simply introduced at will during the synthesis. The problem with this approach is that ‘straight-forward’ chemical synthesis is limited to proteins smaller than 60–70 residues. However, chemical ligation can be used to extend this upper limit significantly [43], as shown by the recent total synthesis of functional mechanosensitive channels from Escherichia coli and Mycobacterium tuberculosis, containing 136 and 151 residues, respectively [44••]. Isotopic labeling of proteins that cannot be made synthetically is much more of a challenge. Approaches that have been used to address this technical obstacle are metabolic labeling of unique amino acids [35•, 36•, 37••] and tRNA engineering [45, 46].
References and recommended reading
Papers of particular interest, published within the annual period of review, have been highlighted as:
• of special interest
•• of outstanding interest
Acknowledgements
Work in the author's laboratory was supported in part by grants from the Israel Science Foundation (784/01), DFG and the NIH (1R21AI064797-01). I thank MT Zanni, E Bennett and E Arbely for helpful comments on the manuscript and MT Zanni and P Mukherjee for Figure 4.
Footnotes
It is convenient to represent vibrational spectra as a function of frequency. However, infrared spectra are traditionally presented in wavenumbers because of historical difficulties in accurately determining the speed of light.
The reason that differential absorption flattening affects CD spectroscopy far more than it does FTIR, is that Rayleigh scattering decreases with the strong power of the wavelength. Hence, scattering in CD at 220 nm is 5.5 × 10⁵ stronger than at 6 μm, which is used in FTIR spectroscopy.
References
- 1.Krimm S., Bandekar J. Vibrational spectroscopy and conformation of peptides, polypeptides, and proteins. Adv Protein Chem. 1986;38:181–364. doi: 10.1016/s0065-3233(08)60528-8. [DOI] [PubMed] [Google Scholar]
- 2.Braiman M.S., Rothschild K.J. Fourier transform infrared techniques for probing membrane protein structure. Annu Rev Biophys Biophys Chem. 1988;17:541–570. doi: 10.1146/annurev.bb.17.060188.002545. [DOI] [PubMed] [Google Scholar]
- 3.Surewicz W.K., Mantsch H.H., Chapman D. Determination of protein secondary structure by Fourier transform infrared spectroscopy: a critical assessment. Biochemistry. 1993;32:389–394. doi: 10.1021/bi00053a001. [DOI] [PubMed] [Google Scholar]
- 4.Tatulian S.A. Attenuated total reflection Fourier transform infrared spectroscopy: a method of choice for studying membrane proteins and lipids. Biochemistry. 2003;42:11898–11907. doi: 10.1021/bi034235+. [DOI] [PubMed] [Google Scholar]
- 5.Wallace B.A., Teeters C.L. Differential absorption flattening optical effects are significant in the circular dichroism spectra of large membrane fragments. Biochemistry. 1987;26:65–70. doi: 10.1021/bi00375a010. [DOI] [PubMed] [Google Scholar]
- 6.Tadesse L., Nazarbaghi R., Walters L. Isotopically enhanced infrared spectroscopy: a novel method for examining the secondary structure at specific sites in conformationally heterogeneous peptides. J Am Chem Soc. 1991;113:7036–7037. [Google Scholar]
- 7.Torres J., Adams P.D., Arkin I.T. Use of a new label, 13C 18O, in the determination of a structural model of phospholamban in a lipid bilayer. Spatial restraints resolve the ambiguity arising from interpretations of mutagenesis data. J Mol Biol. 2000;300:677–685. doi: 10.1006/jmbi.2000.3885. [DOI] [PubMed] [Google Scholar]
- 8.Torres J., Kukol A., Goodman J.M., Arkin I.T. Site-specific examination of secondary structure and orientation determination in membrane proteins: the peptidic 13C 18O group as a novel infrared probe. Biopolymers. 2001;59:396–401. doi: 10.1002/1097-0282(200111)59:6<396::AID-BIP1044>3.0.CO;2-Y. [DOI] [PubMed] [Google Scholar]
- 9•.Gordon L.M., Mobley P.W., Lee W., Eskandari S., Kaznessis Y.N., Sherman M.A., Waring A.J. Conformational mapping of the N-terminal peptide of HIV-1 gp41 in lipid detergent and aqueous environments using 13C-enhanced Fourier transform infrared spectroscopy. Protein Sci. 2004;13:1012–1030. doi: 10.1110/ps.03407704. [DOI] [PMC free article] [PubMed] [Google Scholar]; An example of determining the local secondary structure of a protein composed of different secondary structure elements.
- 10.Gordon L.M., Mobley P.W., Pilpa R., Sherman M.A., Waring A.J. Conformational mapping of the N-terminal peptide of HIV-1 gp41 in membrane environments using (13)C-enhanced Fourier transform infrared spectroscopy. Biochim Biophys Acta. 2002;1559:96–120. doi: 10.1016/s0005-2736(01)00443-6. [DOI] [PubMed] [Google Scholar]
- 11•.Sackett K., Shai Y. The HIV fusion peptide adopts intermolecular parallel beta-sheet structure in membranes when stabilized by the adjacent N-terminal heptad repeat: a 13C FTIR study. J Mol Biol. 2005;350:790–805. doi: 10.1016/j.jmb.2005.05.030. [DOI] [PubMed] [Google Scholar]; Analysis of local secondary structure and its change as a function of time in a heterogeneous system.
- 12••.Paul C., Wang J., Wimley W.C., Hochstrasser R.M., Axelsen P.H. Vibrational coupling, isotopic editing, and beta-sheet structure in a membrane-bound polypeptide. J Am Chem Soc. 2004;126:5843–5850. doi: 10.1021/ja038869f. [DOI] [PMC free article] [PubMed] [Google Scholar]; Detailed analysis of coupling between individual vibrational modes in a model peptide.
- 13••.Patzlaff J.S., Zhang J., Brooker R.J., Barry B.A. An isotope-edited FT-IR study of a symporter, the lactose permease. Biochemistry. 2002;41:7366–7372. doi: 10.1021/bi025555g. [DOI] [PubMed] [Google Scholar]; An elegant demonstration of reaction induced difference FTIR analysis of a large membrane protein: the lactose permease.
- 14.Martin I., Goormaghtigh E., Ruysschaert J.M. Attenuated total reflection IR spectroscopy as a tool to investigate the orientation and tertiary structure changes in fusion proteins. Biochim Biophys Acta. 2003;1614:97–103. doi: 10.1016/s0005-2736(03)00167-6. [DOI] [PubMed] [Google Scholar]
- 15.Vigano C., Manciu L., Buyse F., Goormaghtigh E., Ruysschaert J.M. Attenuated total reflection IR spectroscopy as a tool to investigate the structure, orientation and tertiary structure changes in peptides and membrane proteins. Biopolymers. 2000;55:373–380. doi: 10.1002/1097-0282(2000)55:5<373::AID-BIP1011>3.0.CO;2-U. [DOI] [PubMed] [Google Scholar]
- 16.Goormaghtigh E., Raussens V., Ruysschaert J.M. Attenuated total reflection infrared spectroscopy of proteins and lipids in biological membranes. Biochim Biophys Acta. 1999;1422:105–185. doi: 10.1016/s0304-4157(99)00004-0. [DOI] [PubMed] [Google Scholar]
- 17.Fraser R.D.B. The interpretation of infrared dichroism in fibrous protein structures. J Chem Phys. 1953;70:1511–1515. [Google Scholar]
- 18.Fraser R.D.B. Interpretation of infrared dichroism in axially oriented polymers. J Chem Phys. 1958;28:1113–1115. [Google Scholar]
- 19.Kass I., Arbely E., Arkin I.T. Modeling sample disorder in site-specific dichroism studies of uniaxial systems. Biophys J. 2004;86:2502–2507. doi: 10.1016/S0006-3495(04)74305-2. [DOI] [PMC free article] [PubMed] [Google Scholar]
- 20••.Manor J., Khattari Z., Salditt T., Arkin I.T. Disorder influence on linear dichroism analyses of smectic phases. Biophys J. 2005;89:563–571. doi: 10.1529/biophysj.104.058842. [DOI] [PMC free article] [PubMed] [Google Scholar]; The authors present a method to accurately deconvolve sample disorder from simple IR dichroism analyses using X-ray reflectivity.
- 21.Arkin I.T., MacKenzie K.R., Brunger A.T. Site-directed dichroism as a method for obtaining rotational and orientational constraints for oriented polymers. J Am Chem Soc. 1997;119:8973–8980. [Google Scholar]
- 22••.Marsh D. Infrared dichroism of isotope-edited alpha helices and beta-sheets. J Mol Biol. 2004;338:353–367. doi: 10.1016/j.jmb.2004.02.061. [DOI] [PubMed] [Google Scholar]; A thorough theoretical analysis of site-specific dichroism in β-sheet and α-helical proteins.
- 23.Kukol A., Adams P.D., Rice L.M., Brunger A.T., Arkin T.I. Experimentally based orientational refinement of membrane protein models: a structure for the influenza A M2 H+ channel. J Mol Biol. 1999;286:951–962. doi: 10.1006/jmbi.1998.2512. [DOI] [PubMed] [Google Scholar]
- 24.Kukol A., Arkin I.T. vpu transmembrane peptide structure obtained by site-specific Fourier transform infrared dichroism and global molecular dynamics searching. Biophys J. 1999;77:1594–1601. doi: 10.1016/S0006-3495(99)77007-4. [DOI] [PMC free article] [PubMed] [Google Scholar]
- 25.Kukol A., Arkin I.T. Structure of the influenza C virus CM2 protein transmembrane domain obtained by site-specific infrared dichroism and global molecular dynamics searching. J Biol Chem. 2000;275:4225–4229. doi: 10.1074/jbc.275.6.4225. [DOI] [PubMed] [Google Scholar]
- 26.Kukol A., Torres J., Arkin I.T. A structure for the trimeric MHC class II-associated invariant chain transmembrane domain. J Mol Biol. 2002;320:1109–1117. doi: 10.1016/s0022-2836(02)00563-6. [DOI] [PubMed] [Google Scholar]
- 27••.Torres J., Briggs J.A., Arkin I.T. Multiple sitespecific infrared dichroism of CD3-zeta, a transmembrane helix bundle. J Mol Biol. 2002;316:365–374. doi: 10.1006/jmbi.2001.5267. [DOI] [PubMed] [Google Scholar]; The first multiple labeling study of a membrane protein using site-specific dichroism. The authors utilize data from 11 different 13C 18O labels to derive a model for the protein in lipid bilayers.
- 28.Torres J., Briggs J.A., Arkin I.T. Convergence of experimental, computational and evolutionary approaches predicts the presence of a tetrameric form for CD3-zeta. J Mol Biol. 2002;316:375–384. doi: 10.1006/jmbi.2001.5268. [DOI] [PubMed] [Google Scholar]
- 29••.Mukherjee P., Kass I., Arkin I.T., Zanni M.T. Picosecond dynamics of a membrane protein revealed by 2D IR. Proc Natl Acad Sci USA. 2006;103:3528–3533. doi: 10.1073/pnas.0508833103. [DOI] [PMC free article] [PubMed] [Google Scholar]; A detailed 2D FTIR study of a membrane protein in lipid bilayers. In this study, the authors report for the first time the dynamics of the system at picosecond resolution that was previously unapproachable.
- 30••.Arbely E., Arkin I.T. Experimental measurement of the strength of a bond in a lipid bilayer. J Am Chem Soc. 2004;126:5362–5363. doi: 10.1021/ja049826h. [DOI] [PubMed] [Google Scholar]; This study presents an experimental measurement of the strength of the bond using isotope-edited FTIR.
- 31.Senes A., Ubarretxena-Belandia I., Engelman D.M. The hydrogen bond: a determinant of stability and specificity in transmembrane helix interactions. Proc Natl Acad Sci USA. 2001;98:9056–9061. doi: 10.1073/pnas.161280798. [DOI] [PMC free article] [PubMed] [Google Scholar]
- 32.Lemmon M.A., Treutlein H.R., Adams P.D., Brunger A.T., Engelman D.M. A dimerization motif for transmembrane alpha-helices. Nat Struct Biol. 1994;1:157–163. doi: 10.1038/nsb0394-157. [DOI] [PubMed] [Google Scholar]
- 33.Rozenberg M., Loewenschuss A., Marcus Y. An empirical correlation between stretching vibration redshift and hydrogen length. Phys Chem Chem Phys. 2000;2:2699–2702. [Google Scholar]
- 34.Lanyi J.K. X-ray diffraction of bacteriorhodopsin photocycle intermediates. Mol Membr Biol. 2004;21:143–150. doi: 10.1080/09687680410001666345. [DOI] [PubMed] [Google Scholar]
- 35•.Xiao Y., Hutson M.S., Belenky M., Herzfeld J., Braiman M.S. Role of arginine-82 in fast proton release during the bacteriorhodopsin photocycle: a time-resolved FT-IR study of purple membranes containing 15N-labeled arginine. Biochemistry. 2004;43:12809–12818. doi: 10.1021/bi049238g. [DOI] [PubMed] [Google Scholar]; Analysis of dynamic behavior of a large protein using isotope-edited FTIR.
- 36•.Tanimoto T., Shibata M., Belenky M., Herzfeld J., Kandori H. Altered hydrogen bonding of Arg82 during the proton pump cycle of bacteriorhodopsin: a low temperature polarized FTIR spectroscopic study. Biochemistry. 2004;43:9439–9447. doi: 10.1021/bi049368p. [DOI] [PubMed] [Google Scholar]; Demonstration of site-specific labeling of a large membrane protein and the analysis that such a labeling strategy facilitates.
- 37••.Bergo V., Mamaev S., Olejnik J., Rothschild K.J. Methionine changes in bacteriorhodopsin detected by FTIR and cell-free selenomethionine substitution. Biophys J. 2003;84:960–966. doi: 10.1016/S0006-3495(03)74912-1. [DOI] [PMC free article] [PubMed] [Google Scholar]; An elegant demonstration of the power of isotope-edited FTIR to clarify spectral assignments in a large membrane system.
- 38.Zanni M.T., Hochstrasser R.M. Two-dimensional infrared spectroscopy: a promising new method for the time resolution of structures. Curr Opin Struct Biol. 2001;11:516–522. doi: 10.1016/s0959-440x(00)00243-8. [DOI] [PubMed] [Google Scholar]
- 39••.Mukherjee P., Krummel A.T., Fulmer E.C., Kass I., Arkin I.T., Zanni M.T. Site-specific vibrational dynamics of the CD3zeta membrane peptide using heterodyned two-dimensional infrared photon echo spectroscopy. J Chem Phys. 2004;120:10215–10224. doi: 10.1063/1.1718332. [DOI] [PubMed] [Google Scholar]; The first 2D IR study of a membrane protein.
- 40••.Vigano C., Smeyers M., Raussens V., Scheirlinckx F., Ruysschaert J.M., Goormaghtigh E. Hydrogen-deuterium exchange in membrane proteins monitored by IR spectroscopy: a new tool to resolve protein structure and dynamics. Biopolymers. 2004;74:19–26. doi: 10.1002/bip.20035. [DOI] [PubMed] [Google Scholar]; Detailed description of H+/D+ exchange and it utility as probe of solvent exposure in proteins.
- 41•.Haas A.H., Sauer U.S., Gross R., Simon J., Mantele W., Lancaster C.R. FTIR difference spectra of Wolinella succinogenes quinol:fumarate reductase support a key role of Glu C180 within the “E-pathway hypothesis” of coupled transmembrane electron and proton transfer. Biochemistry. 2005;44:13949–13961. doi: 10.1021/bi051011d. [DOI] [PubMed] [Google Scholar]; Analysis of side-chain exposure using H+/D+ exchange in a large membrane system.
- 42••.Rigler P., Ulrich W.P., Hovius R., Ilegems E., Pick H., Vogel H. Downscaling Fourier transform infrared spectroscopy to the micrometer and nanogram scale: secondary structure of serotonin and acetylcholine receptors. Biochemistry. 2003;42:14017–14022. doi: 10.1021/bi035113k. [DOI] [PubMed] [Google Scholar]; A powerful demonstration of the sensitivity of FTIR spectroscopy whereby the authors present spectra that are collected on nanogram amounts of large membrane proteins.
- 43.Kochendoerfer G.G., Clayton D., Becker C. Chemical synthesis approaches to the engineering of ion channels. Protein Pept Lett. 2005;12:737–741. doi: 10.2174/0929866054864256. [DOI] [PubMed] [Google Scholar]
- 44••.Clayton D., Shapovalov G., Maurer J.A., Dougherty D.A., Lester H.A., Kochendoerfer G.G. Total chemical synthesis and electrophysiological characterization of mechanosensitive channels from Escherichia coli and Mycobacterium tuberculosis. Proc Natl Acad Sci USA. 2004;101:4764–4769. doi: 10.1073/pnas.0305693101. [DOI] [PMC free article] [PubMed] [Google Scholar]; The authors present the total synthesis and functional characterization of two complete membrane proteins, thereby pushing the envelope of chemical synthesis to systems that were considered beyond the synthetic range. This expands the applicable range of isotope-edited FTIR considerably.
- 45.Mamaev S., Olejnik J., Olejnik E.K., Rothschild K.J. Cell-free N-terminal protein labeling using initiator suppressor tRNA. Anal Biochem. 2004;326:25–32. doi: 10.1016/j.ab.2003.11.002. [DOI] [PubMed] [Google Scholar]
- 46.Cremeens M.E., Fujisaki H., Zhang Y., Zimmermann J., Sagle L.B., Matsuda S., Dawson P.E., Straub J.E., Romesberg F.E. Efforts toward developing direct probes of protein dynamics. J Am Chem Soc. 2006;128:6028–6029. doi: 10.1021/ja061328g. [DOI] [PubMed] [Google Scholar]
- 47.Arbely E., Khattari Z., Brotons G., Akkawi M., Salditt T., Arkin I.T. A highly unusual palindromic transmembrane helical hairpin formed by SARS coronavirus E protein. J Mol Biol. 2004;341:769–779. doi: 10.1016/j.jmb.2004.06.044. [DOI] [PMC free article] [PubMed] [Google Scholar]