

Abstract
Mathematical models of infectious disease spread are important tools for assessing the threat of a novel pathogen and offer the best information for mitigating an outbreak. Here we present a metapopulation model of disease spread in Great Britain defined at the level of electoral wards. Using data from the United Kingdom 2001 census and the National Travel Survey to define the amount of travel performed by individuals between wards, we examine the effect of assumptions on the regularity of travel. Routine, daily commuter-type movements, characteristic of the working population are shown to lead to a slower epidemic spread compared to movements with random destinations. We demonstrate that routine movements slow down the epidemic spread compared to a standard metapopulation setting by up to 25%. We also show that spurious long distance movements present in the census data do not have a significant impact on the development of a potential epidemic in Great Britain.
Keywords: Mathematical model, Infectious disease, Structured population, Human movement
Introduction
Recent years have seen the threat from infectious diseases for Great Britain increase, be it from potential bioterrorist attacks or naturally occurring diseases. Smallpox was eradicated in 1979 (Fenner et al., 1988), but is still considered to pose the greatest bioterrorist risk due to the lethality and transmissibility of the virus. Influenza epidemics occur each winter, and another pandemic was widely expected to occur sooner or later (Webby and Webster, 2003); the recent pandemic of H1N1 influenza A from Mexico has illustrated how an outbreak of a novel pathogen will begin, and has highlighted the need for more targeted controls. Mathematical tools can be used to model the progression of such pandemics and, with the development of appropriate containment strategies, advise on mitigation of their impact on the general population (Anderson and May, 1991, Keeling and Rohani, 2007).
Great Britain is the third most densely populated island in the world and may therefore be particularly susceptible to pandemic threat. Spatial transmission of infectious diseases is facilitated by the large amount of commuter travel undertaken by the working population and other trips undertaken by the non-working population. Travel to work, as well as travel for other reasons, such as shopping and leisure, is not migratory for the most part. Instead, the vast majority of people return home at the end of each day. Previous models in general have not considered such behaviour (with notable exceptions (Keeling and Rohani, 2002)), and this study is designed to explore the impact of movements characteristic of returning travellers on epidemic spread.
Large-scale individual-based models (Ferguson et al., 2005, Ferguson et al., 2006, Riley, 2007) often incorporate long distance transmission by defining a kernel parameterised by the distribution of distances travelled. This allows the possibility that a single infectious individual is able to infect two individuals at the same time that are a considerable distance apart (albeit with a very low probability). Metapopulation models offer a compromise between individual-based models and homogenous mixing models, by splitting the population into distinct patches. Homogenous mixing is then assumed within patches which are coupled only weakly (MacArthur and Wilson, Levins, 1962, Rvachev and Longini, 1985). As such they provide a natural way of incorporating spatial structure and heterogeneity into infectious disease models, with a major advantage being that they are amenable to fast simulation and analysis (Watts et al., 2005).
Human travel patterns have previously been used to parameterise metapopulation models in order to capture long-range pandemic spread of disease. Several recent approaches have made use of airline data to build and analyse networks of movements between cities, and use known city sizes to inform metapopulation models at a global scale. This approach has been taken to model the spread of smallpox (Grais et al., 2003), pandemic influenza (Grais et al., 2003, Cooper et al., 2006, Viboud et al., 2006) and severe acute respiratory syndrome (SARS) (Colizza et al., 2007). Models specific to the United Kingdom have used demographic and commuter data from the census taken in 1991 to parameterise metapopulation models at the district scale and describe the spread of smallpox and compare and evaluate containment strategies (Hall et al., 2007).
In classical metapopulation models coupling is assumed to be constant (MacArthur and Wilson, Levins, 1962 Levins, 1962, Rvachev and Longini, 1985). But, the manner in which coupling is made between patches in a metapopulation setting is crucial for the speed and the extent of the epidemic (Keeling and Rohani, 2002). In reality, transmission occurs between individuals and the coupling between patches can only be through discrete movements of individuals. Movements, if explicitly modelled, are often assumed to be unidirectional, which is unrealistic for much of human travel. Recent studies have shown that regularity and return to the home are common features of human movement (Eagle and Pentland, 2009, González et al., 2009).
Here, we investigate the impact of routine movements to work in Great Britain, and contrast this with assuming that movements occur probabilistically. Movement where infected individuals travel to their destination patch and return to their home patch at the end of their journey will limit shedding of infection to just those two patches. We therefore hypothesise that if all movements were regular, where the same travel pattern is repeated each day, a slower epidemic spread will occur. Conversely, random movements within a defined spatial kernel are likely to aid dispersal to other patches resulting in faster spread.
To examine these hypotheses, we present and analyse a novel type of metapopulation setting which explicitly considers regular and random movements from home patches. We build a stochastic metapopulation model based on UK census data from 2001 and use this model to examine the relative impact of regular and non-regular movements on speed of spread. We also identify potential biases present in the census data and evaluate the effects they can have on model outcome. To this end, the paper is organised as follows. In the Methods section we introduce the model and describe the data used to inform it. The Results and discussion section describes the methodology by which we compare the impact of regular movements to irregular ones, the impact of long distance movements and present the main results from these analyses. Finally we discuss the implication of this study in the Conclusion section.
Methods
Model description
We divide the population of Great Britain into 10,026 patches corresponding to electoral wards. Within patches, we have a compartmental infection transmission model based on the Susceptible–Exposed–Infectious–Recovered (SEIR) framework with homogenous mixing (Anderson and May, 1991). We construct realistic infectious periods using multiple sequential infectious classes (Wearing et al., 2005), with the number of classes, n, being disease dependent. Each infectious class, c, has an associated rate of infection, β c, and rate of progression through the class, γ c. Defining n, γ c and β c gives us a flexible framework which we can use to model a variety of pathogens, although here we concentrate on smallpox and influenza.
The temporal unit of a day is spilt into daytime and evening, and individuals become infected by coming into contact with an infected individual either during the day, or in the evening. The force of infection (rate at which susceptibles become infected) during the day in patch i is denoted λ i D, and the rate in the evening is denoted λ i N. Both are dependent on the number of infected individuals and the population size in patch i at that time.
We want to consider two different types of individuals explicitly: those that commute and those that do not. Commuters (workers), denoted W ij, interact within their work ward j during the day and their home ward i at night. These interactions are pre-defined, remain the same throughout each realisation and are repeated each day, apart from weekends. On the other hand, non-workers interact with their home ward, i, at night, and do not have a fixed destination for daytime movement; instead they may travel to ward j on one day, followed by several days in their home ward, followed by a visit to ward k, for example. We model this behaviour by defining the matrix P ij which represents the expected proportion of non-workers that travels from ward i to ward j during the day. Then, the non-workers travelling from i to j ({V ij}) are redistributed on each day according to the probability P ij. In this manner, non-workers from ward i do not necessarily move to the same ward each day, but may move to any ward with a non-zero entry in row i of the P ij matrix. The expected number of non-workers travelling to ward j during the day is given by ΣiPijVi. Since a substantial portion of the non-working population interacts within their home wards during both the day and at night, the diagonal entries of P ij are non-zero, and tend to be large in comparison to off-diagonal entries.
Using these movement patterns and individuals locations, we define the rate of infection during the day to be:
and at night to be:
where subscript c denotes the infected class, and hence Wijc denotes the number of workers in infectious class c, travelling from i to j every working day; Vijc represents non-workers in infectious class c travelling between i and j on one particular day.
For efficient simulation of the infection and recovery process we use the ‘τ-leap method’ for updating stochastic ODEs (Gillespie, 2001) and choose the time-step τ to be a single day. On each day, the number of times an event occurs is assumed to be Poisson distributed with a mean given by the rate of change. So, for transition through infectious classes, c, (including recovery) and infection of workers, the probability of change is the following:
where δ is the proportion of the day spent in the destination ward and (1 − δ) is the proportion of the day spent in the home ward. Similarly for random movers:
In both of the infection steps, we allow for infection to reach individuals in patch i from patch j due to individuals meeting in patch k.
The choice of the length of day parameter δ is not necessarily the same for both commuters and random movers. Although our model allows for different day length by type of movement, for simplicity we choose them to be the same. Since the length of day controls the relative amount of time an individual spends in their home ward, the exact value will have an effect on the dynamics (see Supplementary Figure S3). The length of day δ is chosen to be 0.7 (16.8 h) for both commuters and random movers.
Weekends
We assume that at weekends all workers do not make their daily commute, but instead perform movements akin to those of non-workers, in other words, non-regular movements. This is done by considering all members of W ij as behaving like members of V i for 2 days. So, for 2 days, describing Saturday and Sunday, the evening force of infection remains the same as during the week, but during the day, all workers behave like non-workers and are redistributed each day according to the movement matrix PijWE.
Movement data
United Kingdom 2001 Census
A census has been taken in the United Kingdom every 10 years since 1801, with the most recent being taken in 2001 (Office for National Statistics, 2001a). We chose to define our patch model at the level of electoral wards for Great Britain. Ward population size varies widely, with the number of people per ward ranging from 116 to 35102, which we use directly to give us the number of individuals in ward i at night N i N (See Supplementary Fig. 1). The proportion of workers within wards also varies, with high densities of workers clustering around urban centres. In 2001 each individual in a household was asked to specify their work location as well as their home address. So, the number of people that work is available, but more importantly, the destination of workers is also known (Office for National Statistics, 2001b). These data give us W ij directly (see Supplementary Information).
United Kingdom National Travel Survey
Whilst the census data provides a good idea of how employed people commute on a day to day basis, it does not provide information about how non-workers move. We therefore complement the data from the census with information from the National Travel Survey(NTS) (Department for Transport, National Travel Survey, 2002), where data on personal travel is collected on a continuous basis and provides details of travel to work and other purposes. By considering the distributions of distance travelled measured in the NTS to that extracted from the census, we can improve our estimate of how people travel for non-work related purposes. In particular, non-work related travel shows a higher proportion of very short and long distance journeys compared to commuter movements, with the intermediate journeys being underrepresented. So, non-commuters are given a probability of moving from i to j on each day, denoted P ij. We define P ij initially to be W ij/ΣjWij as given by the 2001 census (see Supplementary Information). This is further weighted by the discrepancy between work and non-work related movements from the National Travel Survey. Data is also available specifically for weekend travel also, and shows some differences, making it necessary to separately parameterise weekend movements (see Supplementary Fig. 2a).
Seeding scenarios
Infection could enter Great Britain in a variety of ways. The most likely locations of importation will be airports, railway stations or naval ports. We would like to compare the initial seeding conditions on the development of the epidemic. We have tested a large number of initial seeding scenarios. Here we show a representative selection of five seeding wards: three urban wards, one rural ward and one small town ward; including wards in London, Glasgow and Heathrow. For simplicity we assume a single seeding event, infecting five initial cases, although we note that in the case of a world-wide pandemic we may expect a continual (and increasing) importation of infection.
Parametrisation
We consider parameters that capture transmission dynamics of smallpox and influenza. In the case of influenza, we have adapted the parameters from (Moser et al., 1979, Hayden et al., 1999, Ferguson et al., 2005) to fit our modelling framework. In a mean field setting these parameters would correspond to an R 0 value of 1.9. For smallpox we use the most recent estimates from a forthcoming review paper (Nishiura et al., personal communication). In a mean field setting these parameters used would give an R 0 value of 5. For detailed parameter values, see Supplementary Information S2.
Results and discussion
We performed extensive simulations and investigated the temporal and spatial features of the predicted epidemic. Figs. 2 a–d show the aggregated epidemic curves of the full model. Smallpox parameters result in a more protracted epidemic which infects a larger number of people than influenza parameters. Fig. 2e shows the spatial progression of an influenza-like epidemic of the infection at different times in the model realisation, when seeding the epidemic in central London (King's Cross). A spatial wave of infection can clearly been observed spreading out from London and moving north and west.
Fig. 2.
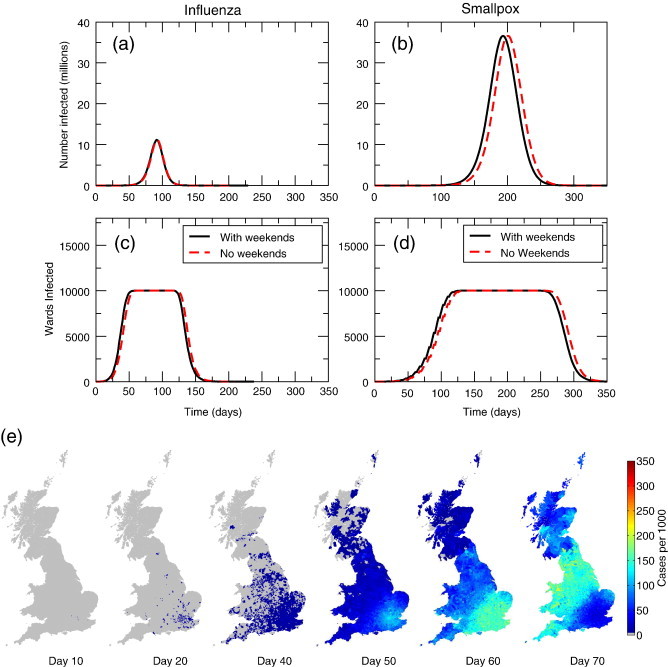
Epidemic curves for influenza parameters and smallpox parameters. (a) The influenza epidemic peaks at around 60 days, with weekend dynamics included in the model or not. (c) The smallpox epidemic peaks at around 180 days when we include weekends, and around 200 days when the weekends are not included. (e) Spatial spread of disease in commuter model. The epidemic is seeded in a central London ward and spreads quickly to the rest of the country, with highest numbers of infected people found in urban centres.
The effect of non-commuters
The most realistic model of disease spread contains all the ingredients above: behaviour characteristic of non-workers, workers and weekend type movements. We now turn to the question of the effect of non-regular movements have on epidemic spread. We can achieve this by manipulating the form that P ij takes and so reducing the proportion of people that travel to other wards. In particular we demand that:
When , so that all non-workers interact only within their own ward, and no external, random movements are performed. In this case the only coupling between wards is made by the working population. At the other extreme (H = 1) all non-workers move as in the full model, such that the coupling between wards is the strongest.
Fig. 3 shows that the presence of random movements has an effect on both the total number of individuals infected and the speed at which the epidemic progresses through the country. As the random, non-worker coupling is increased from none (H = 0), the final size of the epidemic increases monotonically. However, for both smallpox and influenza parameters, the impact is less than 1% between extremes. Notably, seeding at different locations has almost no effect on outcome in terms of final size (in Figs. 3c,d the curves for the different initial seeds overlap), due to the fact that all wards are eventually infected. Once infection reaches a region and takes off, the local final size is limited only by depletion of susceptible individuals and the relative force of infection within the wards.
Fig. 3.
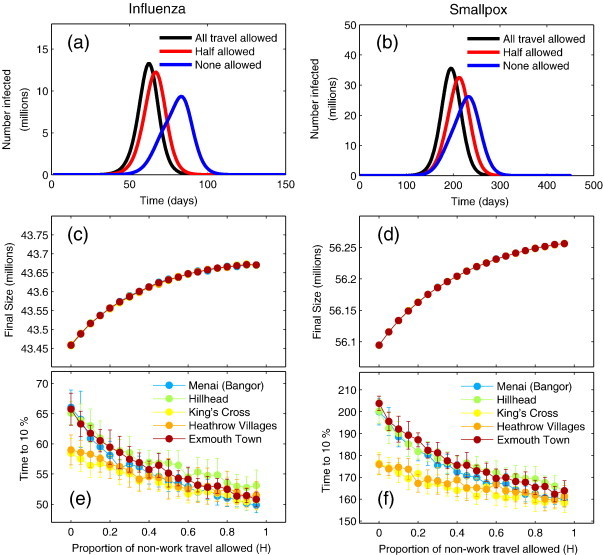
Impact of scaling the proportion of non-work travel. Non-work travel is estimated using the Census data and National Travel Survey data (see main text). (a) Epidemic curves for influenza parameters for all non-work travel allowed (black), 50% allowed (red) and none (blue). (b) Epidemic curves for smallpox. (c) Proportion of non-work travel allowed against final attack size for influenza. (d) Proportion of non-work travel allowed against final attack size for smallpox. (e) Proportion of non-work travel allowed against speed of epidemic characterised by the time taken to reach 10% of final size for influenza. (f) Proportion of non-work travel allowed against speed of epidemic spread for smallpox. Different colours represent different seeding scenarios in (c–f), the points represent the mean over 20 realisations of the model, and the error bars denote the standard deviation from the mean. Note that for (c) and (d) the error bars are smaller than the point size.
Despite the only slight reduction in final size, the speed of the epidemic, characterised by measuring the time taken to reach 10% of the (national) final size, is markedly increased by the reducing the movement of non-commuters. In the case of influenza and when non-commuters undertake the expected number of movements (H = 1), the time to 10% varies between 51 and 55 days, depending on seeding scenario. At the other extreme, when all non-commuters remain in their home wards (H = 0), it is seen to be between 57 and 65 days, depending on seeding scenario. The introduction of random movements increases the speed of spread by up to 25% for rural wards, and around 13% for urban wards. In the case of smallpox we see that the time to 10% varies between 150 days and 160 days depending on seeding scenario when non-commuters are allowed to move as expected. When non-commuters do not leave their home ward, the time to 10% varies between 175 days for the most central wards to 210 days for rural wards, a difference of 25%, similar to that predicted for influenza.
The magnitude of this effect is dependent on the seeding scenario. Epidemics seeded in highly connected wards, such as those in central London and that containing Heathrow Airport are less affected by changes to the number of random movements. This is due to the fact that spread is less reliant on random movements. However, for an epidemic seeded in a ward with a small number of commuters, a small number of non-workers moving will make a considerable impact on the time infection takes to reach adjacent wards. Conversely, when seeding in a ward which is highly connected with commuters, infection is likely to pass to adjacent wards quickly whether non-workers are moving or not.
The effect of random movements on the speed and attack size saturates when approaching large proportions of non-workers moving (near H = 1). Since only a small proportion of random movers is needed for quick initial dispersal one would expect that increasing the proportion of random movement from none to a small proportion would produce a much larger effect than increasing by the same proportion when a large number of random movements are already present.
Comparison to classic metapopulation coupling
Such a strong effect of the presence of random movers begs the question: What is the relative effect of workers to non-workers under the assumption that all individuals are allowed to perform some movements? To answer this question we vary the number of commuter-type movements compared to non-regular ones while keeping total number of movements between any pair of wards constant. This is achieved by manipulating the relative numbers of commuters to non-commuters, taking a proportion of the work population for a ward, W ij, and placing it in the non-working population V i, so that
and
Setting q p = 0, we have the ‘natural’ combination of both non-workers and workers, but at q p = 1, all workers behave as non-workers and move randomly. Similarly, we can convert a proportion of the non-working population to behave like commuters according to parameter q W, so that
and
In this fashion, when q W = 0 we have the same combination of non-workers and workers in the original model. At q W = 1, all non-workers behave as workers and perform regular daily commutes between fixed pairs of wards.
In Fig. 4 we show the results of varying both q p and q W. Extreme values on the x-axis (of graphs c–f) represent when the entire population are commuters (extreme right), and when the entire population moves randomly (extreme left). In the case of influenza, when the whole population is considered to be non-working, and all movements are irregular (q p = 1, q W = 0), the characteristic time to 10% of final size is around 47 days. At the other extreme, when all movements are regular (q p = 0, q W = 1), the time to 10% is around 60 days, representing a change of more than 25%. The final attack size varies from 42.7 million to 43.8 million between extremes, a difference of just above 2%.
Fig. 4.
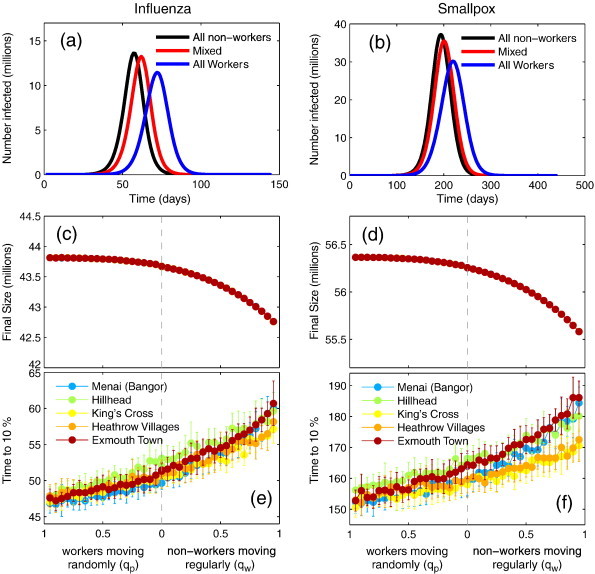
The impact of random versus regular movements. (a) Epidemic curves for the all random movers (black), the fully regular case (blue) and the intermediate case (blue) for influenza. (b) Epidemic curves for smallpox. (c) Final attack size against the proportion of non-workers moving regularly (left) and workers moving randomly (right) for influenza. (d) Final attack size against the proportion of non-workers moving regularly and workers moving randomly for smallpox. (e) Speed of epidemic against the proportion of random movers (left) and workers (right) for influenza. (f) Speed of epidemic against the proportion of random movers and workers for smallpox. Different colours represent different seeding scenarios in (c–f), the points represent the mean over 20 realisations of the model, and the error bars denote the standard deviation from the mean. Note that for (c) and (d) the error bars are smaller than the point size.
For smallpox parameters a similar pattern is observed, when all movements are considered to be regular, the time to 10% varies between 170 and 185 days depending on seeding scenario. At the other extreme, when all movements are irregular, the time to 10% is around 155 for all seeing scenarios. This constitutes a difference of almost 24% for the seeding wards where the largest difference is observed. The final attack size varies from 55.6 million to 56.4 million, a difference of 1.7%.
Since the spatial movement distributions of workers and non-workers differ (Fig. 1 ), changing the values of q p and q W will also modify the overall spatial distribution. To test whether our results are caused by this change, rather than they type of movement performed, we repeated the same experiment while demanding that P ij follows the same spatial distribution as W ij, by setting
Fig. 1.

Spatial variation in the distance travelled to work from the 2001 UK census. The colours depict the distance an average commuter travels to get to work. (a) Shows the average commute from a ward and (b) shows the average commute to a particular ward. The average commute in remote parts of the country, such as Scotland or Cornwall, tends to be longer.
We found that changes to the epidemic dynamics were small compared to the full model (see Supplementary Fig. 2b).
Again a strong saturation effect can be seen in Fig. 4 both in terms of final attack size and initial speed of spread. The saturation implies that introducing some random movement is enough to increase the speed and final size of the epidemic by a considerable amount. Further increases in random movement, have a smaller impact. The phenomenon of sensitivity to seeding ward is again observed, but not to the same extent as in Fig. 3. It is important to remember that the total number of interactions between wards is kept constant. What is varied is just the relative number of people behaving in a non-regular fashion.
Eliminating long distance commutes
Our modelling framework also permits us to examine the effect that spurious long distance movements have on the model dynamics. We perform this analysis for two reasons: first, to assess the sensitivity to potentially erroneous entries in the census, where a few individuals claim to commute hundreds of miles each day and second, to assess if some form of movement restrictions would have any impact on an epidemic and could act as a potential control mechanism. Each element of W ij and P ij has an associated physical distance, the Euclidean distance between ward i and ward j. We can then impose restrictions such that any movement, or potential movement above a certain distance, D, be disregarded, by setting both W ij and P ij for the relevant movements to zero. However, it is important to make sure that the individuals that are prevented from moving as a result of the distance cut-off are not simply removed from the population or confined to home but are allowed to travel elsewhere. We therefore redistribute those individuals, so that they perform movements to wards that are within the distance cut-off.
We consider the distance beyond which no movements were permitted as a variable, with Fig. 5 showing the impact that different cut-off distances have on the dynamics of the epidemic. For very low values of the distance cut-off (< 1 km) we see that the epidemic does not take off. In this case only within ward infection is possible, and the epidemic is not able to spread beyond the initial seeding ward. For distance cut-offs around 5 km, most wards are eventually reachable, but the speed of the spread is considerably reduced, as only neighbouring wards are generally accessible. Figs. 5 (a) and (b) shows the time evolution of the epidemic seeded in King's Cross (London). The multiple epidemic peaks for low values of distance cut-off correspond to epidemics within densely populated cities, such as London and Birmingham, and later on Liverpool, Glasgow and Edinburgh. With a cut-off beyond 200 km, these individual peaks are undetectable.
Fig. 5.
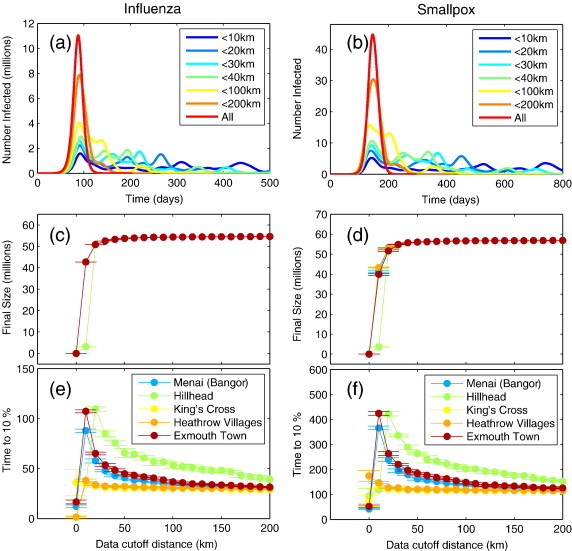
Impact of distance cut-off model dynamics. (a) Epidemic curves for several distance cut-offs for influenza (b) Epidemic curves for smallpox. (c) Final size as a function of distance cut-off for influenza. (d) Final size as a function of distance cut-off for smallpox. (e) Time to 10% of final size for influenza (f) time to 10% of final size for smallpox. Different colours represent different seeding scenarios in (c–f), the points represent the mean over 20 realisations of the model, and the error bars denote the standard deviation from the mean.
The sharp transition in the final size (Figs. 5 (c) and (d) for a cut-off of around 5 km reflects the fact that once local spread is not contained in the initial seed ward and the epidemic escapes to adjacent wards, all wards are eventually reached and the final attack size is only limited by depletion of susceptible individuals in each ward. This suggests that movement restrictions will have a limited control impact, echoing previous findings (Cooper et al., 2006). Corresponding, the speed of spread (see Figs. 5 (e) and (f)) decreases monotonically for as the cut-off increases from 5 km and 200 km. Beyond 200 km, the model behaviour becomes indistinguishable (on aggregate) from the full model. This result suggests that the tail of the travel distance distribution does not have a large impact. So, whether we believe that long distance commutes happen every day or not, is not important in the context of this model. This is due to the fact that the number of such movements in the data is very small (See Supplementary Fig. 2a).
Conclusion
In this paper we presented a metapopulation model of epidemic spread for a novel pathogen parametrised by the UK 2001 census data and the National Travel Survey. We characterised the epidemic spread through Great Britain by final attack size and early growth rate. The type of assumptions made when incorporating these data into models can be extremely important. By far the simplest assumption would be to couple census wards with data taken directly from the census, neglecting any non-work related travel. An important finding of this work is that the presence of irregular movements, in addition to regular commuter-type movements, increases the speed at which the epidemic spreads through the country. For both influenza and smallpox parameters and in certain seeding scenarios, the speed of spread can be increased by almost 25% when random movements are included to the level indicated by the NTS.
The true nature of human movement is hard to gauge and realistic movement patterns consist of a combination of non-work and routine movements (González et al., 2009). We have shown that neglecting either of these will result in a potentially misrepresentative model. Considering all movements as regular may underestimate the speed of spread by up to 17% and assuming that all movements are irregular will overestimate the speed of spread by up to 8% in comparison to our best guess.
Some simplifying assumptions had to be made to incorporate the data and make the model amenable to fast simulation and analysis. Since the data are aggregated to ward level, even though the homogenous mixing assumption is unrealistic, it provides a parsimonious first approximation. Networks of human contact are highly heterogeneous and their structure has strong implication for the spread of disease (Keeling and Eames, 2005), which will remain true within and between wards. Higher order structure implied by the presence of households, workplaces or schools will further alter disease dynamics. Nevertheless, our current model is capable of capturing the spatial spread of disease in Great Britain, despite these simplifying assumptions and has allowed us to explore the effect of plausible ranges of behaviour.
These results are essential for the development of realistic intervention strategies, such as vaccination for those contagious agents where a suitable vaccine exists or prophylactic antiviral treatment in the case of novel influenza. Our result showing that spread is faster when considering random movements implies that studies of control strategies which rely on standard assumptions may overestimate their impact. A slower assumed spread of infection is likely to make any testable control strategy appear to be more effective than in reality. Furthermore, if all movements are assumed to be regular, one can have more confidence in choosing wards for intervention. When random movements are introduced such a statement must necessarily become less strong due to the uncertainty of movement destinations. Thus, we suggest that the presence of random movements will need to be taken account of when designing realistic containment strategies.
Here, we have concentrated our efforts on modelling the United Kingdom due to the availability of high quality data, but the results of this study are likely to be applicable much more widely. The recent H1N1 influenza A pandemic originating in Mexico highlights the importance of this type of investigation and will guide model refinements. As data become more readily available, it will be possible to validate the predictive power of our model, evaluate containment strategies used and help design novel and more targeted interventions.
Acknowledgments
The authors would like to thank Ellen Brooks Pollock, Steve Leach, Ian Hall, Neil Ferguson, Joseph Egan and Judith Legrand for fruitful discussions. This work was funded by the Medical Research Council, the Department of Health for England and the Home Office Counter Terrorism and Intelligence Directorate through the Health Protection Agency, and EU Grant INFTRANS (FP6 STREP; Contract No. 513715).
Footnotes
Supplementary data associated with this article can be found, in the online version, at doi:10.1016/j.epidem.2009.11.002.
Contributor Information
Leon Danon, Email: l.danon@warwick.ac.uk.
Thomas House, Email: t.a.house@warwick.ac.uk.
Matt J. Keeling, Email: m.j.keeling@warwick.ac.uk.
Appendix A. Supplementary data
References
- Anderson R.M., May R.M. Oxford University Press; 1991. Infectious Diseases of Humans. [Google Scholar]
- Colizza V., Barrat A., Barthélemy M., Vespignani A. Predictability and epidemic pathways in global outbreaks of infectious diseases: the SARS case study. BMC Med. 2007;5:34. doi: 10.1186/1741-7015-5-34. [DOI] [PMC free article] [PubMed] [Google Scholar]
- Cooper B.S., Pitman R.J., Edmunds W.J., Gay N.J. Delaying the international spread of pandemic influenza. PLoS Med. 2006;3(6):e212. doi: 10.1371/journal.pmed.0030212. [DOI] [PMC free article] [PubMed] [Google Scholar]
- Department for Transport, National Travel Survey 2002–2004, Computer file (2006). Crown copyright material is reproduced with the permission of the Controller of HMSO and the Queen's Printer for Scotland.
- Eagle N., Pentland A. Eigenbehaviors: identifying structure in routine. Behav. Ecol. Sociobiol. 2009;63(7):1057–1066. [Google Scholar]
- Fenner F., Henderson D.A., Arita L., Jezek Z., Ladnyi L.D. World Health Organisation; Geneva: 1988. Smallpox and its Eradication. [Google Scholar]
- Ferguson N.M., Cummings D.A.T., Cauchemez S., Fraser C., Riley S., Meeyai A., Iamsirithaworn S., Burke D.S. Strategies for containing an emerging influenza pandemic in Southeast Asia. Nature. 2005;437(7056):209–214. doi: 10.1038/nature04017. [DOI] [PubMed] [Google Scholar]
- Ferguson N.M., Cummings D.A., Fraser C., Cajka J.C., Cooley P.C., Burke D.S. Strategies for mitigating an influenza pandemic. Nature. 2006;442(7101):448–452. doi: 10.1038/nature04795. [DOI] [PMC free article] [PubMed] [Google Scholar]
- Gillespie D. Approximate accelerated stochastic simulation of chemically reacting systems. J. Chem. Phys. 2001;115:1716. [Google Scholar]
- Grais R., Ellis J., Glass G. Forecasting the geographical spread of smallpox cases by air travel. Epidemiol. Infect. 2003;131(2):849–857. doi: 10.1017/s0950268803008811. [DOI] [PMC free article] [PubMed] [Google Scholar]
- Grais R.F., Ellis J.H., Glass G.E. Assessing the impact of airline travel on the geographic spread of pandemic influenza. Eur. J. Epidemiol. 2003;18(11):1065–1072. doi: 10.1023/a:1026140019146. [DOI] [PubMed] [Google Scholar]
- González M.C., Hidalgo C.A., Barabási A.L. Understanding individual human mobility patterns. Nature. 2009;453(7196):779–782. doi: 10.1038/nature06958. [DOI] [PubMed] [Google Scholar]
- Hall I.M., Egan J.R., Barrass I., Gani R., Leach S. Comparison of smallpox outbreak control strategies using a spatial metapopulation model. Epidemiol. Infect. 2007;135(07):12. doi: 10.1017/S0950268806007783. [DOI] [PMC free article] [PubMed] [Google Scholar]
- Hayden F.G., Treanor J.J., Fritz R.S., Lobo M., Betts R.F., Miller M., Kinnersley N., Mills R.G., Ward P., Straus S.E. Use of the oral neuraminidase inhibitor oseltamivir in experimental human influenza: randomized controlled trials for prevention and treatment. JAMA. 1999;282(13):1240–1246. doi: 10.1001/jama.282.13.1240. [DOI] [PubMed] [Google Scholar]
- Keeling M.J., Eames K.T. Networks and epidemic models. J. R. Soc. Interface. 2005;2(4):295–307. doi: 10.1098/rsif.2005.0051. [DOI] [PMC free article] [PubMed] [Google Scholar]
- Keeling M., Rohani P. Estimating spatial coupling in epidemiological systems: a mechanistic approach. Ecol. Lett. 2002;5(1):20–29. [Google Scholar]
- Keeling M.J., Rohani P. Modeling Infectious Diseases in Humans and Animals. Princeton University Press; Princeton, NJ: 2007. [Google Scholar]
- Levins R. Theory of fitness in a heterogeneous environment. i. the fitness set and adaptive function. Am. Nat. 1962;96(861):361–373. [Google Scholar]
- MacArthur, R.H., Wilson, E.O., 2001. The Theory of Island Biogeography, Princeton University Press, Princeton, NJ.
- Moser M.R., Bender T.R., Margolis H.S., Noble G.R., Kendal A.P., Ritter D.G. An outbreak of influenza aboard a commercial airliner. Am. J. Epidemiol. 1979;110(1):1–6. doi: 10.1093/oxfordjournals.aje.a112781. [DOI] [PubMed] [Google Scholar]
- Nishiura, H., Danon, L., J Egan, M. E., Ferguson, N., Flahault, A., Hall, I., House, T., Keeling, M. J., Kretzschmar, M., Leach, S., personal communication. Containing a smallpox outbreak following deliberate release.
- Office for National Statistics, 2001a Census: Standard Area Statistics (England and Wales); General Register Office for Scotland, 2001 Census: Standard Area Statistics (Scotland), Computer files (2003). Census output is Crown copyright and is reproduced with the permission of the Controller of HMSO and the Queen's Printer for Scotland.
- Office for National Statistics, 2001b Census: Special Workplace Statistics (England, Wales and Northern Ireland); General Register Office for Scotland, 2001 Census: Special Travel Statistics (Scotland), Computer files (2003). Census output is Crown copyright and is reproduced with the permission of the Controller of HMSO and the Queen's Printer for Scotland.
- Riley S. Large-scale spatial-transmission models of infectious disease. Science. 2007;316:1298–1301. doi: 10.1126/science.1134695. [DOI] [PubMed] [Google Scholar]
- Rvachev L.A., Longini I.M. A mathematical model for the global spread of influenza. Math Biosci. 1985;75(1):3–22. [Google Scholar]
- Viboud C., Bjornstad O.N., Smith D.L., Simonsen L., Miller M.A., Grenfell B.T. Synchrony, waves, and spatial hierarchies in the spread of influenza. Science. 2006;312:447–451. doi: 10.1126/science.1125237. [DOI] [PubMed] [Google Scholar]
- Watts D., Muhamad R., Medina D., Dodds P. Multiscale, resurgent epidemics in a hierarchical metapopulation model. Proc. Natl. Acad. Sci. U.S.A. 2005;102(32):11157–11162. doi: 10.1073/pnas.0501226102. [DOI] [PMC free article] [PubMed] [Google Scholar]
- Wearing H., Rohani P., Keeling M.J. Appropriate models for the management of infectious diseases. PLOS Med. 2005;2(7):e174. doi: 10.1371/journal.pmed.0020174. [DOI] [PMC free article] [PubMed] [Google Scholar]
- Webby R., Webster R. Are we ready for pandemic influenza? Science. 2003;302(5650):1519. doi: 10.1126/science.1090350. [DOI] [PubMed] [Google Scholar]
Associated Data
This section collects any data citations, data availability statements, or supplementary materials included in this article.