Abstract
This paper presents a method of controlling the arterial carbon dioxide tension of patients receiving mechanical ventilation. Controlling of the CO2 tension is achieved by regulating the ventilator initiated breath frequency and also volume per breath.
Keywords: Arterial carbon dioxide tension, automatic control, mechanical ventilation
I. Introduction
Modern lung ventilators are equipped with a variety of support techniques that provide the clinician various ways of artificially ventilating patients. Mandatory minute ventilation (MMV) is one such ventilation technique that interact with the patient in such a way that the delivery of a preset minimum minute volume (inhaled volume per minute) is guaranteed. The number of volume control breaths1. per minute automatically increases or decreases to ensure the delivery of the requested mandatory or minimum minute volume. The concept of MMV appears attractive in that it provides the ability to increase or decrease the number of volume control breaths in a given time span. Thus, if the patient is apneic, an appropriate number of volume control breaths are delivered, and as the patient resumes spontaneous ventilation, the number of volume control breaths decreases gradually. This support scheme provides flexibility for a patient to automatically take up the work load of breathing and for the machine to gradually wind down at the same time.
For a patient ventilated in MMV, the clinician selects the level of minimum minute ventilation and this setting remains unaltered until a change is requested by the clinician. In the event of an increase or decrease in arterial CO2 tension, the MMV setting may be decreased or increased respectively by the clinician to correct the disturbed arterial CO2 tension. Regulating the MMV setting to maintain an acceptable arterial CO2 tension could be performed automatically. This paper deals with such an automatic ventilation scheme that maintains the arterial CO2 tension less than a specified level determined by a clinician.
II. Respiratory Dead Space
During respiration not all inhaled air reaches the alveoli, as part of it remains in the conducting portion of the airway. The region of the respiratory system where gas exchange does not take place is termed the respiratory dead space. By examining the CO2 content of the exhaled air, Bohr formulated the following relationship [1]:
 |
where  is the dead space,
  is the tidal volume (i.e., volume inhaled per breath),
  is the arterial CO2 tension, and
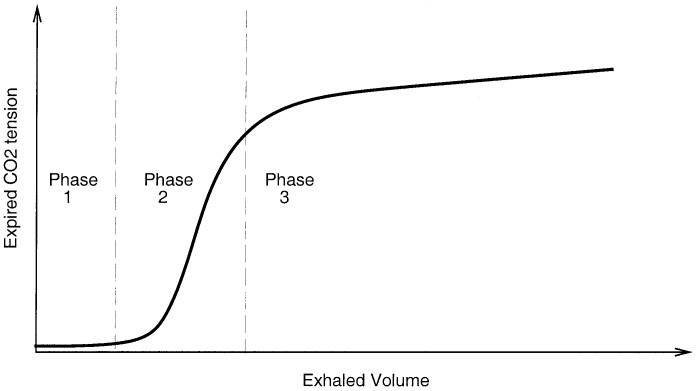
  is the average CO2 tension in exhaled air. A typical trace of exhaled CO2 tension against exhaled volume (i.e., SBT-CO2 plot2.) consists of three phases [1]: phase 1 comprising the CO2-free gas from the airways, phase 2 a transition phase characterized by a S-shaped up-swing in the tracing representing the washout of airway with alveolar gas, and phase3 comprising CO2-bearing gas from the alveoli (see Fig. 1). The initial volume of expirate which includes the volume of fresh air down to the alveolar/fresh air interface represents the airway dead space. Airway dead space is, therefore, defined as the volume of air that does not reach the sites of gas exchange (i.e., alveolus). On the SBT-CO2 plot this corresponds to an exhaled volume in phase 2. The exact location of this position on the SBT-CO2 plot is reported in [2] and [3], and here it is taken as the exhaled volume corresponding to the point of inflection on the SBT-CO2 curve. Alveolar tidal volume is the part of inhaled volume that reach the alveoli
 |
where  is alveolar tidal volume and
  is airway dead space. However, not all inhaled air that reaches the gas exchanging zone takes part in the mixing process. This fractional volume in alveoli that does not contribute to gas exchange is termed alveolar dead space. Combination of alveolar dead space and airway dead space defines the total dead space of the respiratory system
 |
where  is alveolar dead space. The effective alveolar ventilation is the difference between alveolar tidal volume and alveolar dead space
 |
where  is the effective alveolar ventilation.
Fig. 1. Three phases of SBT-CO2 plot.
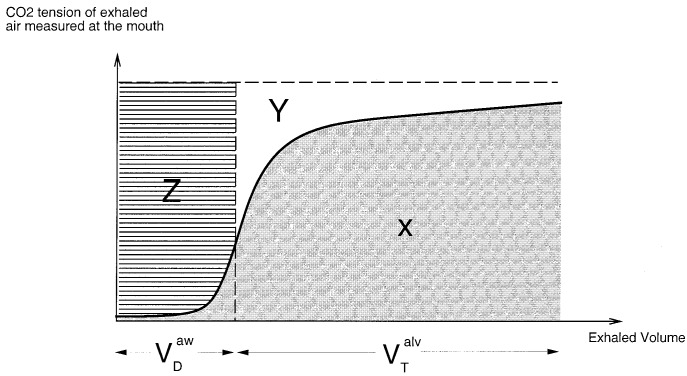
The alveolar dead space can be related to areas of SBT-CO2 plot (see Fig. 2). In Fig. 2, the dashed vertical line falls through the point of inflection of the SBT-CO2 curve. The areas  and
and  represents the following.
 |
The alveolar dead space can be defined using Area- and Area-
 [1], [4]
 |
Refer to the Appendix for a clinical trial on the measurement of airway deadspace and alveolar deadspace of a mechanically ventilated patient in the Intensive Care Unit (ICU) at the Royal Melbourne Hospital (RMH).
Fig. 2. SBT-CO2 plot and the partition of regions  and
and  .
.
III. Arterial CO2 Tension Estimation
This section describes two algorithms [5] that can estimate arterial CO2 tension of mechanically ventilated patients. The continuous estimation of arterial CO2 tension is based on instantaneous, correlated measurements of ventilatory flow, airway pressure, and CO2 tension of exhaled air measured by a capnograph. Although end tidal CO2 tension may approximately follow the variations in arterial CO2 tension, various studies have shown that utilization of end tidal CO2 as a noninvasive monitoring substitute for trends in arterial CO2 tension in critically ill patients may be misleading [6], [7]. The algorithms described here are based on the efficiency of gas mixing in the lung as oppose to an algorithm based on end tidal CO2 tension. The efficiency of gas exchange may be defined using Bohr's equation
 |
where  is the dead space,
  is the tidal volume,
  is the arterial CO2 tension, and
  is the average CO2 tension of exhaled air. The term
  represents how well the inhaled tidal volume is used in the lungs for the purpose of gas exchange, and hence the term may be referred to as the efficiency of gas mixing
 |
Experiments carried out on human subjects [5], [8] have found that the efficiency of gas mixing stays relatively constant for various levels of ventilation. Hence, if the efficiency of gas mixing is calculated upon performing a blood test and assumed constant in an individual patient for subsequent breaths following the blood test, the only unknown in (7) is the blood CO2 tension, provided that the average partial pressure of CO2 in exhaled air is known. Using basic gas laws,  can be expressed as follows:
 |
where  is the partial pressure of CO2 in exhaled air,
  is mouth pressure,
  is the flow,
  is the tidal volume,
  is the exhalation time,
  is the barometric pressure, and
  is the saturated water vapor pressure.
It should be noted that the accuracy of estimation can be affected by possible variations in efficiency of gas mixing that may occur. The problem of changes in efficiency can be overcome by incorporating a monitoring module to detect such changes and to request the operator to perform a new blood test to calculate the new efficiency of gas mixing thereby improving the accuracy of CO2 estimation. The efficiency of gas mixing is considered to change if any of the following events occur three times.
-
•
If minute volume increases by 800 ml/min or more and end-tidal CO2 tension3. does not drop by at least 2 mmHg.
-
•
If minute volume decreases by 800 ml/min or more and end-tidal CO2 tension does not increase by at least 2 mmHg.
-
•
If minute volume increases by 800 ml/min or more and estimated CO2 tension does not drop by at least 2 mmHg.
-
•
If minute volume decreases by 800 ml/min or more and estimated CO2 tension does not increase by at least 2 mmHg.
-
•
If inspiratory time changes by more than 0.5 s.
-
•
If peak airway pressure changes more than 10 cm H2 O.
-
•
If previous PEEP4. is less than 10 cm H2 O and changes by more than 5 cm H2 O.
-
•
If previous PEEP is greater than or equal to 10 cm H2 O and changes by more than 2 cm H2 O.
Equations (7) and (8) together with a monitoring module for detecting changes in efficiency of gas mixing provide a framework for estimating arterial CO2 tension. Algorithm 1 outlines a technique for estimating arterial CO2 tension.
 |
Efficiency of gas mixing can also be defined using the areas of SBT-CO2 curve [9]
 |
The algorithm proposed by [5] for CO2 estimation is based on the efficiency expression derived by Fletcher. The method of estimation is shown in Algorithm 2.
 |
It should be noted that the efficiency expression resulting from Fletcher's equation includes only alveolar dead space and alveolar tidal volume as opposed to total dead space and total tidal volume incorporated in the efficiency expression resulting from Bohr's equation. It has been reported that efficiency defined by Fletcher's equation is less sensitive to changes in ventilation than the efficiency defined using Bohr's equation [5]. Hence, it may be expected that incorporating the efficiency expression derived using Fletcher's equation for arterial CO2 estimation produces more accurate readings of arterial CO2 than incorporating the efficiency expression derived using Bohr's equation. The algorithm implemented by [5] claims an accuracy of ±4 mmHg.
IV. Control of  By Regulating
The level of arterial CO2 tension is dependent on the CO2 production in cells and the magnitude of effective alveolar ventilation. A disturbance in CO2 production or the magnitude of effective alveolar ventilation will alter the level of arterial CO2 tension. The relationship between these variables are given by the alveolar air equation [10]
 |
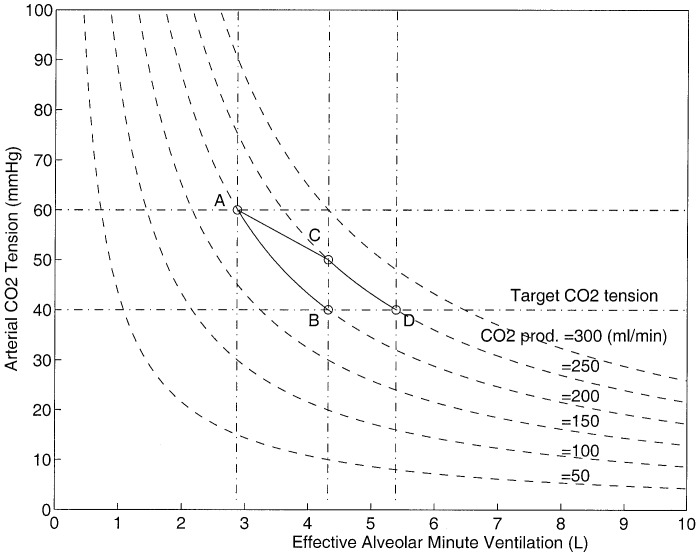
Fig. 3 shows the inverse relationship between the blood carbon dioxide tension and the effective alveolar minute ventilation for various CO2 production values.
Fig. 3. One-step-ahead control performance.
A one-step-ahead control strategy may be adopted in the regulation of blood CO2 tension. A one-step-ahead controller by definition attempts to push the control variable (i.e.,  ) from the current value to the desired value in one step. The CO2 controller takes corrective action every five minutes, which is also the sampling time of the controller. The performance of the controller can be explained by referring to the details of Fig. 3.
A patient with an unacceptable blood CO2 tension of 60 mmHg with an alveolar minute ventilation of 2.8 l/min and CO2 production of 200 ml/min can be represented at point A on the diagram. The controller in an attempt to push the patient's blood CO2 tension from the present value to the desired value of 40 mmHg calculates a desired alveolar ventilation of 4.3 l. If the CO2 production remains constant until the next sample (i.e., 5 min into the future), the patient descends down line AB and reaches the desired CO2 level in one step. The one-step-ahead control law can be written as
 |
where  is the current effective alveolar ventilation,
  is the current arterial CO2 tension,
  is the desired arterial CO2 tension, and
  is the calculated new effective alveolar ventilation to correct the current arterial CO2 tension. The above control strategy is derived using (10) and assuming that
  is constant between sampling periods. However, if the CO2 production changes (e.g., it increases from 200 mL/min to 250 mL/min), the patient instead of descending from point A to point B moves from point A to point C. In this situation, the target value is not reached in one step due to the disturbance in the CO2 production; the controller again attempts to push the patient from point C to the new desired point D by calculating a new alveolar ventilation of 5.4 L. It is clear that desired performance of the controller can be guaranteed even under sudden changes in CO2 production, provided it remains stable after the change. However, if the CO2 production is unstable and oscillates about a mean CO2 production value of
  with an amplitude of
  , then from (10) it is clear that blood CO2 tension oscillates about the desired CO2 tension with an amplitude of
  where
where
 |
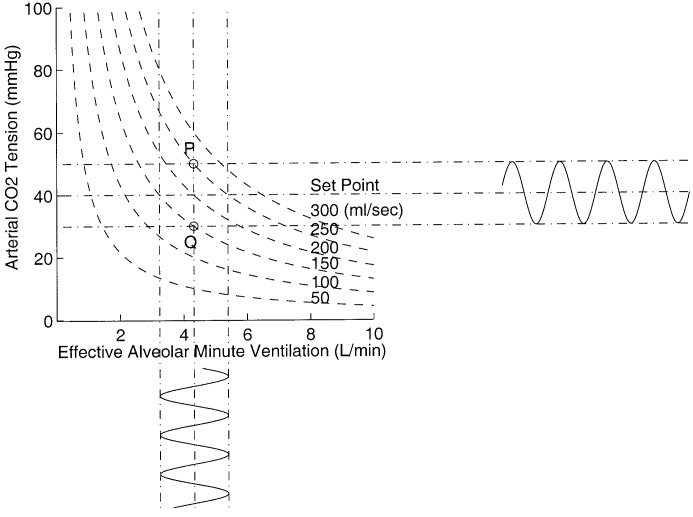
provided that alveolar ventilation is unchanged. Fig. 4 shows this scenario, as the CO2 production oscillates between 150 to 250 mL/min for a constant effective alveolar minute ventilation of 4.3 L represents an oscillatory movement of a point between  and
and  . It is clear that arterial CO2 tension will oscillate between 30 to 50 mmHg as shown in the horizontal oscillations. If the magnitude and direction of CO2 production oscillations areknown, the controller can then suppress the oscillations in CO2 tension by oscillating the alveolar minute ventilation with an amplitude of
  where
where
 |
The suppression only occurs when the CO2 production oscillations are in phase with the effective alveolar minute ventilation oscillations. The vertical oscillations in Fig. 4 indicates how effective alveolar minute ventilation should oscillate in order to suppress the CO2 tension oscillations. If the CO2 production oscillations and the  oscillations are out of phase then from (10) it is clear that the blood CO2 tension will oscillate with amplitude
 |
which is greater than the CO2 tension oscillations when there is no CO2 control action present.
Fig. 4. Oscillations of CO2 production, arterial CO2, and effective alveolar minute ventilation.
Since the disturbance in CO2 production depends on body metabolism, it cannot be predicted, though it can be continuously measured. Controlling CO2 tension when oscillatory disturbances are present in CO2 production may intensify the existing oscillations. When consistent oscillations are present in the CO2 production, the best performance the controller can achieve is by regulating the CO2 tension using a running mean CO2 production value instead of regulating it using the single CO2 production value at the time of sampling.
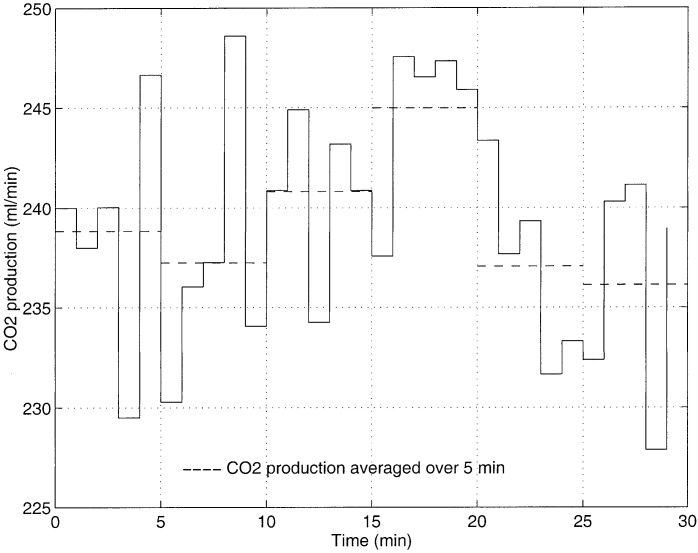
From the above discussion it is clear that to control the arterial CO2 level, it is necessary that the assumption the CO2 production is relatively constant be valid and regulation of effective alveolar minute ventilation be possible. Fig. 5 shows a typical variation of CO2 production over a period of 30 min. Here the average CO2 production varies within a band of 10 mL and from (12)it is clear that this will cause the arterial CO2 tension to oscillate with an amplitude  provided that effective alveolar minute ventilation is left unaltered. For
  in the range of 4 to 8 L, the expected arterial CO2 tension oscillations have amplitudes ranging from 1.1 mmHg to 0.5 mmHg. Since the target
  tension is generally set around 40 mmHg, a control system that can regulate the
  level with in a band of 1.1 mmHg can be considered entirely acceptable. Such typical variation in CO2 production is, therefore, not a performance limiting factor of the control system.
Fig. 5. Variation of carbon dioxide production over time. The online estimation was performed in ICU at RMH.
The minute ventilation for a mechanically ventilated patient depends on the patient's own respiratory drive and the number of mandatory breaths the operator specifies. The mandatory breaths contribute to a certain mandatory minute ventilation and the patient's respiratory drive contributes to a certain spontaneous minute volume. Both the spontaneous and mandatory minute volumes contain respiratory dead space volume, and subtraction of the two gives the effective minute volume carried by spontaneous and mandatory breaths. The controlling of  assumes that regulating
  is possible. The effective alveolar minute ventilation is composed of the effective minute volume contributed by the spontaneous breaths (i.e.,
  ) and also the effective minute volume contributed by the mandatory breaths (i.e.,
  )
)
 |
The regulation of  can only be done by adjusting
  . To be able to set any desired
  by adjusting
  it is necessary that these two quantities are directly related, any changes to
  must be reflected in
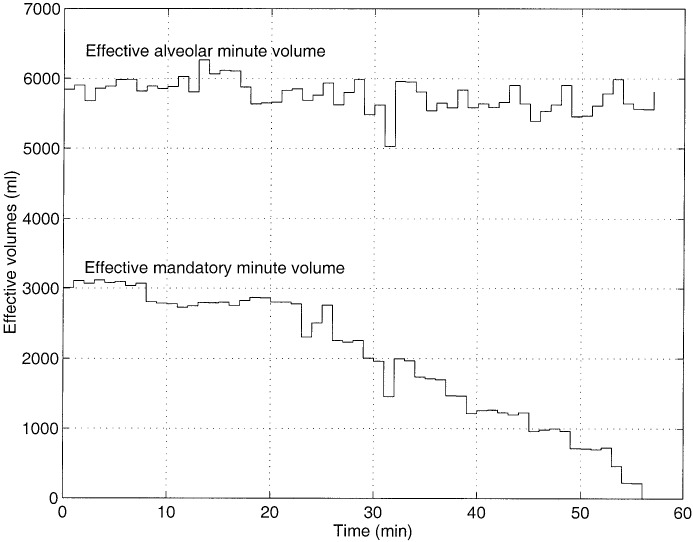
  . Fig. 6 shows an example of changes in
  and the corresponding changes in
  . From this it is clear that the variations in
  does not necessarily follow the those in
  . A change in
  may alter both the
  and
and  . There is no direct relationship between
  and
and  , since alterations in
  does not get reflected in
  . Hence, controlling the
  level about a target value is not possible in such circumstances.
Fig. 6. Pattern of changes in effective mandatory minute volume and the corresponding changes in effective alveolar minute ventilation. All measurements were carried out at RMH.
However, if a patient receives a certain number of mandatory breaths, then this ensures that the patient is guaranteed a certain level of effective alveolar minute ventilation, i.e.,
 |
From (10) and (16), the following can be written:
 |
From (17), it is clear that using  as the control signal and (11) as the control law can only maintain arterial CO2 level below a certain maximum level (i.e.,
  ). Similarly, (16) and (17) can be rewritten for a patient ventilated in the MMV mode as
 |
where  is the deadspace volume corresponding to MMV and
 |
It is clear that in this situation using the MMV setting as the control signal and (11) as the control law, again can only maintain arterial CO2 tension below a certain maximum level (i.e.,  ). Hence, it may be stated that, while arterial CO2 tension cannot be controlled about a set target level, it is possible to maintain it below a certain maximum level.
V. VMMV Algorithm
To maintain arterial CO2 tension below  ,
,  must be regulated according to (11) periodically. The periodic implementation of
  can be done in the MMV mode by periodically selecting a MMV setting as follows:
 |
where  is the deadspace volume corresponding to
  . The new minute dead space volume can be estimated by assuming that minute dead space volume varies proportionally to minute volume [8]
 |
Therefore
 |
Using (20) and (22) the expression for  can be rewritten as
 |
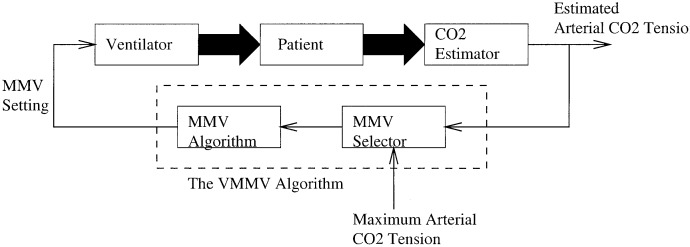
Fig. 7 is a schematic of a patient ventilated in VMMV mode. Arterial CO2 tension (rather than minute ventilation) serves as the input to the VMMV algorithm. The periodic MMV selection is based on (23). Based on the arterial CO2 tension and minute ventilation, both averaged over 5–min intervals, the MMV selector outputs a new MMV setting every 5 min. The following is a clinical trial of a patient ventilated in the new VMMV mode.
Fig. 7. Implementation of the VMMV algorithm.
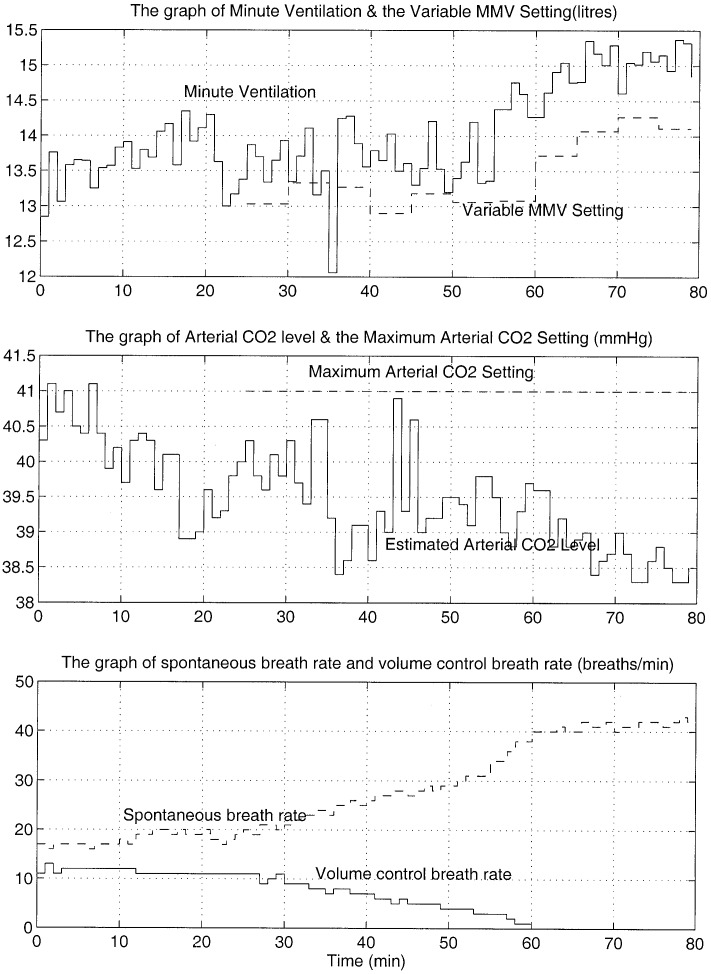
A patient who had been receiving mechanical ventilation for the past 72 hs was chosen to trial on the VMMV mode. The patient was on a rate of 12 volume control breaths per minute, each carrying a tidal volume of 600 mL. A blood test was performed 4 min into the trial, and it revealed an arterial CO2 tension of 41 mmHg. Based on the arterial CO2 tension in this minute, a blood gas efficiency of 0.646 was calculated (refer to Section III for details of this calculation). The VMMV mode was not engaged until the 21st minute, until then only the CO2 estimator was in operation. Within this time span, arterial CO2 tension varied between 38.9–41.1 mmHg. When the VMMV mode was engaged a maximum arterial CO2 tension setting of 41 mmHg was chosen as the input to the algorithm.
The minute volume, MMV settings, estimated arterial CO2 tension, and spontaneous and volume control breaths per minute are shown in Fig. 8. By the 61st minute, the patient was receiving no volume control breaths and was breathing spontaneously. The minute ventilation then remained above the MMV setting constantly for another 20 min at which point the trial was terminated. A blood gas performed in the 78th minute revealed an arterial CO2 tension of 36.7 mmHg. The estimated arterial CO2 tension was 1.6 mmHg different from the value obtained from gas analysis. It is noted that throughout the trial, the MMV setting has changed at every 5-min interval, and the arterial CO2 tension has remained below the set maximum limit. The new ventilation mode has demonstrated the ability to encourage patient's spontaneous breathing while ensuring that the arterial CO2 tension remained below the prescribed maximum settings as determined by the clinician.
Fig. 8. Variations of minute volume, the MMV setting, the arterial CO2 tension, spontaneous, and volume control breaths per minute. This VMMV trial was carried out in ICU at RMH.
The control system cannot raise the arterial CO2 tension above the level achieved during spontaneous ventilation. In situations where arterial CO2 tension needs to be increased, patient's spontaneous ventilation needs to be suppressed through sedative medication allowing the mechanical ventilator to “take over” in regulating effective alveolar ventilation and thereby controlling the arterial CO2 tension. Tighter control of arterial CO2 tension is possible if spontaneous breathing is suppressed and ventilation is controlled entirely by a ventilator.
VI. Conclusion
When a patient is ventilated in the VMMV mode, the clinician decides the maximum arterial CO2 level. Once this decision is made, the ventilation scheme calculates a new MMV setting every 5 min (hence the name variable MMV) to ensure that arterial CO2 level stays below the set limit. The ventilation mode while providing all features of the MMV mode can ensure that arterial CO2 remains below a set limit.
Acknowledgment
The authors would like to thank the clinical and technical staff at the Intensive Care Unit at the Royal Melbourne Hospital for their assistance in conducting clinical trials.
Biographies
Tyrone Fernando received the B.E. (Hon.) and Ph.D. degrees from the University of Melbourne, Melbourne, Australia, in 1990 and 1996, respectively.
In 1995, he was a Visiting Lecturer in the Department of Electrical and Computer Engineering, Monash University, Melbourne. Since 1996, he has been with the Department of Electrical and Electronic Engineering, University of Western Australia, Crawley, where he is a Senior Lecturer. His main research interests include biomedical engineering, multidimensional systems theory, and robust control.
John Cade received the M.D. degree in 1968 and the Ph.D. degree in 1970, both from the University of Melbourne, Melbourne, Australia.
He has been the Director of Intensive Care at the Royal Melbourne Hospital, a University teaching hospital in Melbourne, Australia, for over 20 years. He is a Professorial Fellow in the Department of Medicine in the University of Melbourne. He has had a long-term interest in clinical, teaching, and research aspects of biomedical engineering, thromboembolism, infections, and ethics.
John Packer received the undergraduate degree in electrical engineering and the M.E. degree from the University of Adelaide, Adelaide, Australia.
He was with the Aeronautical Research Laboratories, Melbourne, Australia, in the field of aircraft and missile control systems. He was with the University of Melbourne until he retired in 1996. He was Chairman of the Department of Electrical and Electronic Engineering from 1978 to 1984 and Deputy Dean of the Faculty of Engineering from 1991 to 1994.
Appendix
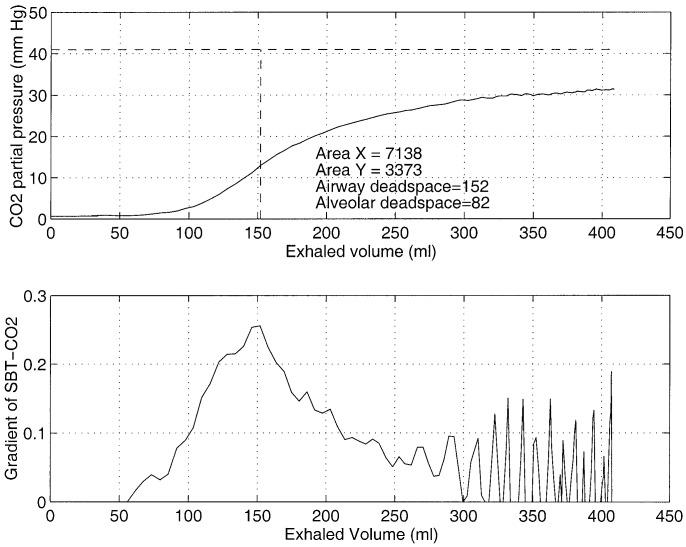
To form a SBT-CO2 trace, it is necessary to access the inspiratory flow waveform and CO2 partial pressure of exhaled air. The inspiratory flow waveform was accessed from an analog port in the PB-7200a ventilator and the CO2 partial pressure of exhaled air was accessed from an analog port of the HP-78 356A capnograph. Both analog signals were sampled at a frequency of 100 Hz and processed in an IBM-386 PC. The top graph of Fig. 9 shows a SBT-CO2 trace. The gradient of this curve is shown in the lower graph of Fig. 9. The maximum peak in the gradient of SBT-CO2 plot corresponds to the point of inflection of the SBT-CO2 plot. The maximum peak in the gradient of SBT-CO2 plot in this patient occurs when the exhaled volume is 152 ml. This point corresponds to the point of inflection of the SBT-CO2 plot and, therefore, represents the airway dead space. The tidal volume of this breath is 408 ml and hence the alveolar tidal volume is 408 − 152 = 256 ml. A blood test performed within this time revealed an arterial CO2 tension of 41 mmHg. The Area- and Area-
 for this breath was calculated to be 7138 ml mmHg and 3373 ml mmHg, respectively. Using (5) alveolar dead space is (256 × 3373)/(7138 + 3377)
  mL. The total dead space of the respiratory system is the sum of alveolar dead space and airway dead space, 82 + 152 = 234 mL.
Fig. 9. SBT-CO2 plot and the gradient of SBT-CO2. The CO2 partial pressure signal was obtained from a Hewlett Packard 78 356A capnograph and the flow signal was obtained from a PB-7200a ventilator. The flow signal was integrated to obtain volume. The measurements were made in ICU at RMH.
Funding Statement
Manuscript accepted November 5, 2001. This work was supported by a grant from the PuritanBennett Corporation, Carlsbad, CA.
Footnotes
A volume control breath delivers a fixed volume specified by an operator.
Single breath test of carbon dioxide.
End-tidal CO2 tension is the partial pressure of CO2 in a sample of exhaled air taken at the end of exhalation.
PEEP stands for positive end expiratory pressure.
Contributor Information
Tyrone Fernando, Email: tyrone@ee.uwa.edu.au.
John Packer, Email: jsp@ee.mu.oz.au.
References
- [1].Fletcher R., Jonson B., Cumming G. and Brew J., “The concept of deadspace with special reference to the single breath test,” Brit. J. Anaesth., pp. 74–90, vol. 53, 1981. [DOI] [PubMed] [Google Scholar]
- [2].Flower W. S., “Lung function studies,” Amer. J. Physiol., p. 405, vol. 154, 1948. [DOI] [PubMed] [Google Scholar]
- [3].Nunn J. F., Appl. Respiratory Physiol., London, U.K.: Butterworths, p. 178 1977. [Google Scholar]
- [4].Fletcher R., The single breath test for carbon dioxide, Ph.D. dissertation Univ. Lund Lund, Sweden, 1986. [Google Scholar]
- [5].Law E. B., An intelligent Pa CO 2 estimator and controller for ventilation control, Masters thesisElect. Eng. Dept., Univ. Melbourne Melbourne, Australia, 1990. [Google Scholar]
- [6].Hoffman R. A., Krieger B. P., Kramer M. R., Segel S., Bizousky F., Gazeroglu H. and Sackner M. A., “End-tidal carbon dioxide in critically ill patients during changes in mechanical ventilation,” Amer. Rev. Respir. Dis., pp. 1265–1268, vol. 140, 1989. [DOI] [PubMed] [Google Scholar]
- [7].Raemer D. B., Francis D., Philip J. H. and Grabel R. A., “Variation in PCO2 between arterial blood and peak expired gas during anesthesia,” Anesth. Analg., pp. 1065–1069, vol. 62, 1983. [PubMed] [Google Scholar]
- [8].Nunn J. F., “Elimination of carbon dioxide by the lung,” Anesthesiology, pp. 620–633, vol. 21, no. 6, 1960. [DOI] [PubMed] [Google Scholar]
- [9].Fletcher R., “Deadspace, invasive and noninvasive,” Brit. J. Anaesth., pp. 102–107, vol. 57, 1985. [DOI] [PubMed] [Google Scholar]
- [10].Cade J. F. and Pain M. C., Essentials of Respiratory Medicine, Oxford, U.K.: Blackwell, 1988. [Google Scholar]


