Abstract
It has been hypothesized that the Neolithic transition towards an agricultural and pastoralist economy facilitated the emergence of human adapted pathogens. Here, we recovered eight Salmonella enterica subsp. enterica genomes from human skeletons of transitional foragers, pastoralists, and agro-pastoralists in western Eurasia that were up to 6,500 years old. Despite the high genetic diversity of S. enterica all ancient bacterial genomes clustered in a single previously uncharacterized branch that contains S. enterica adapted to multiple mammalian species. All ancient bacterial genomes from prehistoric (agro-)pastoralists fall within a part of this branch that also includes the human-specific S. enterica Paratyphi C, illustrating the evolution of a human pathogen over a period of five thousand years. Bacterial genomic comparisons suggest that the earlier ancient strains were not host specific, differed in pathogenic potential, and experienced convergent pseudogenization that accompanied their downstream host adaptation. These observations support the concept that the emergence of human adapted S. enterica is linked to human cultural transformations.
Keywords: Salmonella enterica, ancient DNA, pathogen emergence, epidemiologic transition, parallel evolution, ancient Eurasian super branch, ancient infectious disease convergent evolution, domesticated animals, animal husbandry, hunter-gatherers, forager, pastoralists, farmer, Neolithic revolution, zoonosis, phoN
The transition in human lifestyle from foraging to agriculture and pastoralism during the Neolithic revolution represents possibly the biggest cultural change in human history. The transition began in the Near Eastern fertile crescent around 10,000 years ago and subsequently Neolithic economies spread across western Eurasia1. This Neolithization process was accompanied by a change in mobility, introduction of domesticated animals, and increased contact to animal and human excrements, which facilitated a more constant and recurrent exposure to pathogens and possibly the emergence of zoonotic disease2–5. However, direct molecular evidence, like ancient DNA, in support of this hypothesis is currently missing. Microbial paleogenomics provides a unique window into the past human infectious disease burden, and promises to elucidate the deep evolutionary history of clinically relevant pathogens6,7. Recently, ancient DNA analysis identified the human-specific bacterial pathogen Salmonella enterica Paratyphi C in 450 year old skeletons from Mexico and 800 year old skeletons from Norway8,9. However, Salmonella enterica is largely absent from the historical record because it has nonspecific clinical symptoms and does not cause distinctive skeletal lesions.
The bacterial pathogen Salmonella enterica encompasses over 2,500 serovars. Today 99% of the cases of salmonellosis in mammals, including up to 200,000 annual fatal human infections are associated with S. enterica subsp. enterica (S. enterica) comprising 60% of all serovars10,11. S. enterica that cause systemic infection are often restricted to single host species, or have a narrow host range, while S. enterica causing gastroenteritis are host generalists, and only rarely cause systemic infections12,13. S. enterica Paratyphi C causes systemic disease specifically in humans but is a member of a phylogenetic lineage (“Para C Lineage”) that also includes serovars invasive for pigs (Typhisuis, Choleraesuis). Choleraesuis also rarely infects humans, and previous analyses posit that Paratyphi C arose as a zoonosis in Europe within the last 4,000 years, possibly by a host jump of Choleraesuis from domesticated pigs to humans9,14. The evolution of ancient Salmonella genomes might thus have been influenced by shifts in human cultural practices during the Neolithization process.
Transect of eight ancient S. enterica across western Eurasia
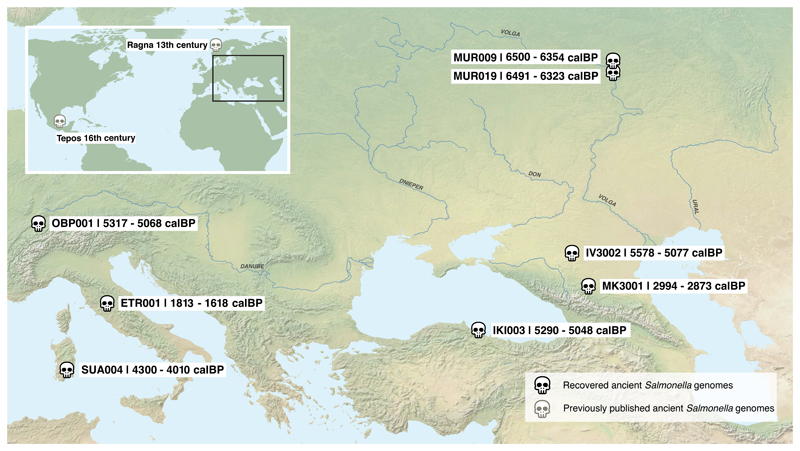
In order to investigate these changes, we screened for S. enterica DNA in 2,739 ancient metagenomes extracted from human skeletons spanning primarily the Eurasian Neolithization process until the Middle Ages. Twenty-four metagenomes yielded multiple reads mapping to different S. enterica serovars. Each sample was enriched for DNA using a targeted in-solution S. enterica-specific hybridization capture assay, which allowed the reconstruction of eight genomes with a coverage of 0.7- to 24-fold (Table 1). The human teeth from which these genomes were assembled were up to 6,500 years old, and their locations ranged from Russia to Turkey to Switzerland (Figure 1). Teeth are vascularized during life, and the successful retrieval of S. enterica DNA suggests bacteria were present in high levels in the blood at the time of death15. Thus, our results suggest systemic S. enterica infections were geographically widespread across prehistoric western Eurasia.
Table 1. Overview of S. enterica positive samples.
| Sample | Site | Country | Date (cal BP) | Mapped Reads | % endog. DNA | Coverage | % Reference covered |
|---|---|---|---|---|---|---|---|
| MUR009 | Murzihinskiy | Russia | 6500 - 6350 | 783,054 | 2.8 | 8.8 | 88.9 |
| MUR019 | Murzihinskiy | Russia | 6490 - 6320 | 1,405,983 | 7.8 | 16.5 | 90.1 |
| IV3002 | Ipatovo | Russia | 5580 - 5080 | 761,643 | 8.9 | 7.0 | 88.9 |
| OBP001 | Oberbipp | Switzerland | 5320 - 5070 | 138,083 | 0.5 | 1.2 | 59.3 |
| IKI003 | Ikiztepe | Turkey | 5290 - 5050 | 840,560 | 2.7 | 8.3 | 90.0 |
| SUA004 | Seulo | Italy | 4300 - 4010 | 2,517,870 | 11.5 | 24.0 | 93.2 |
| MK3001 | Marinskaja | Russia | 2990 - 2870 | 79,534 | 0.8 | 0.7 | 37.8 |
| ETR001 | Chiusi | Italy | 1810 – 1620 | 1,977,148 | 24.5 | 17.8 | 93.7 |
Date is in calibrated years before present (95% confidence interval), based on direct AMS dating. Number of mapped reads, percent endogenous DNA (% endog. DNA), mean coverage, and percent bases covered at least once (% Reference covered) are based on the alignment to Paratyphi C RKS4594.
Figure 1. Geographic location and radiocarbon age of ancient human individuals infected with S. enterica.
Previously published ancient genomes from 13th century Norway (Ragna) and 16th century Mexico (Tepos) are also shown.
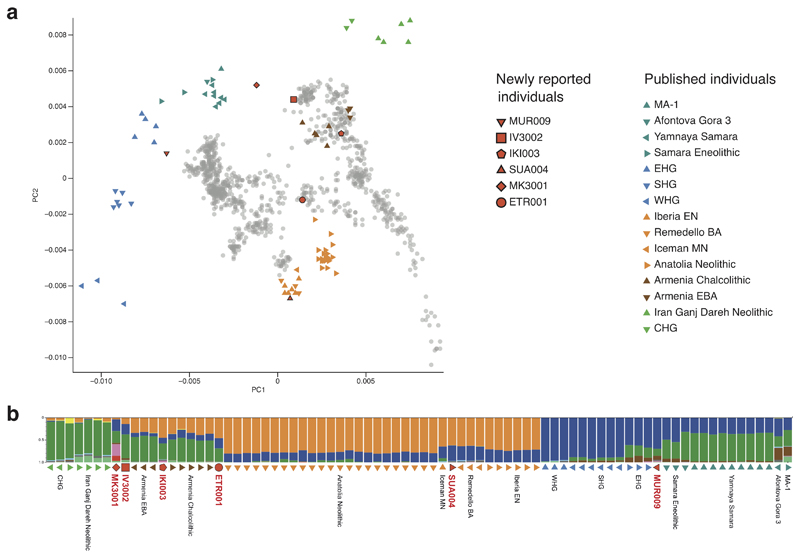
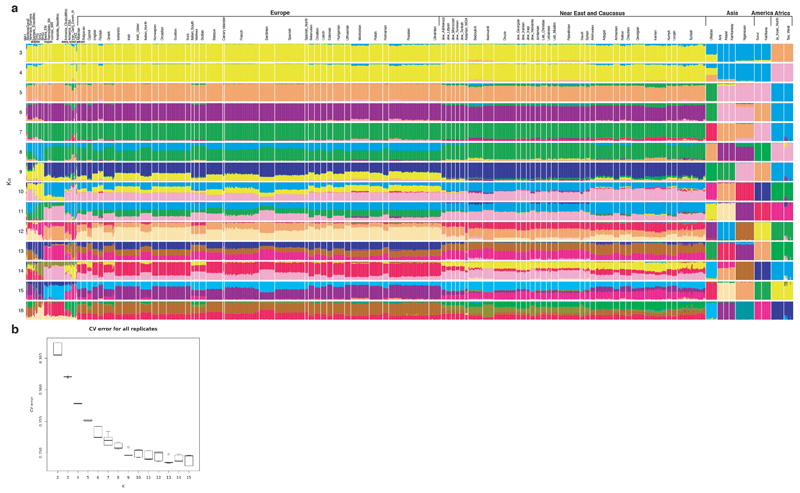
During the last 8,000 years the Neolithic lifestyle spread across western Eurasia and adapted to regionally different conditions16. We investigated differences in human subsistence practices and genomic ancestry of the ancient S. enterica positive individuals using the archaeological information as well as human ancient DNA (see also Supplementary Note 1). The oldest burial site in Milicejskiy (western Russia), with two 6,500 year old individuals (MUR009 and MUR019) is archeologically assigned to the local Eneolithic, a transitional period dominated by a foraging economy that relied on hunting, with first evidence for the adoption of pastoralism17. In addition, genomic ancestry components of MUR009 and the mitochondrial DNA from MUR019 resemble those of previously sequenced eastern European foragers (Supplementary Table 1, Extended Data Fig. 1 and 2). In contrast, the 5,500 year old individuals IV3002 (southern Russia) and IKI003 (Turkey) were from a regional Bronze Age culture that primarily practiced a pastoralist economy linked to the use of domesticated sheep, goat and cattle. The other individuals from the Neolithic (OBP001) in Switzerland, the Bronze Age (SUA004) in Sardinia, the Iron Age (MK3001) in Russia, and the late Roman Empire (ETR001) from Italy were associated with archaeological evidence for an agro-pastoralist economy (Supplementary Note 1). Ancient human DNA analysis for these individuals (except OBP001 with insufficient recoverable DNA) infers genomic compositions consistent with (agro-)pastoralist economies based on previously published populations with similar ancestries (Supplementary Note 1, Extended Data Fig. 1 and 2).
In conclusion, the eight bacterial genomes transect 4,700 years of S. enterica infections during the spread of an (agro-)pastoralist subsistence, and can provide an unprecedented view into the diversity and evolution of S. enterica during this transformative time.
Ancient S. enterica genomes form a previously uncharacterized super branch
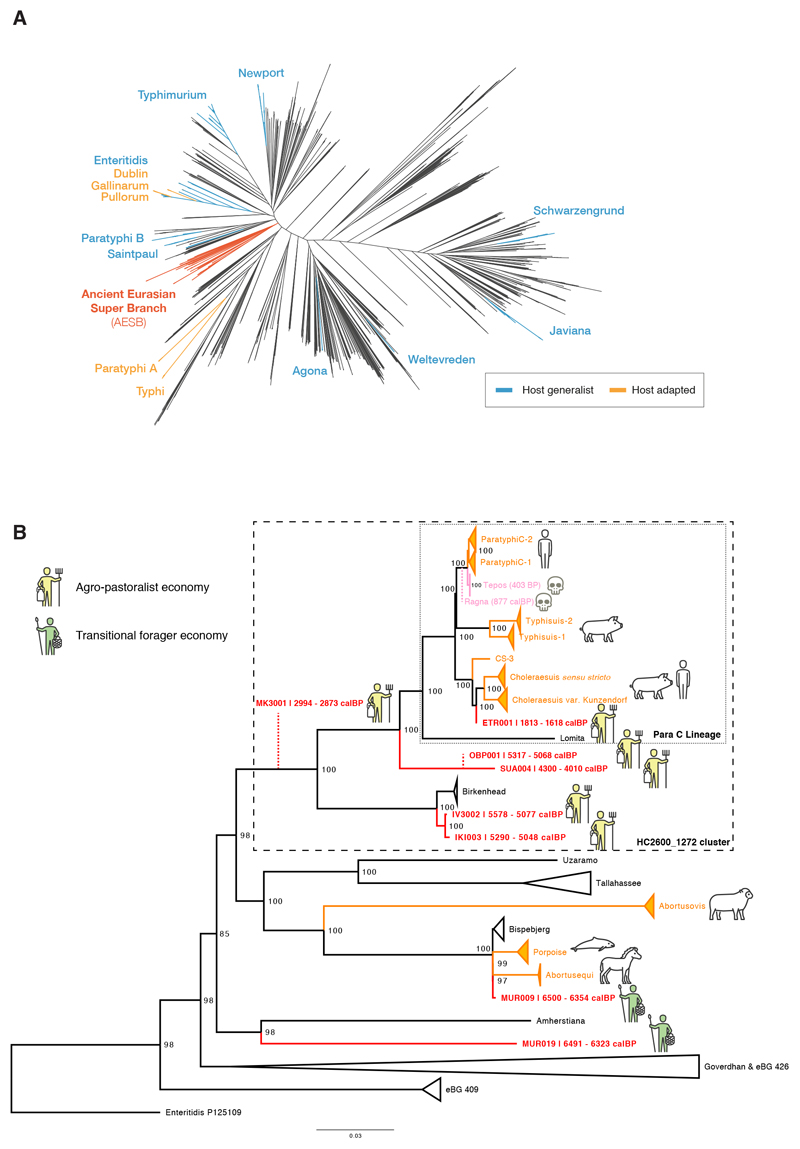
We assessed the relationships of the ancient S. enterica genomes to the modern diversity by leveraging a representative set of 2,961 genomes from EnteroBase9,10. For phylogenetic reconstruction, we built a multi-sequence alignment against Paratyphi C, a close relative to several ancient genomes in our screen. To minimize any reference bias we retained only positions covered across all genomes and excluded ancient genomes with less than 5-fold coverage to ensure reliable SNP calling. Surprisingly, all the ancient genomes clustered in a single phylogenetic branch containing a limited number of serovars (Figure 2A), which we designate the Ancient Eurasian Super Branch (AESB). Only 60 out of the 2,961 representative, modern S. enterica genomes are part of the AESB (Figure 2A) and the majority of the representative genomes belong to multiple other branches9,10 that were not found among the ancient genomes. Those results suggest that all detected prehistoric S. enterica infections across western Eurasia were caused by a sub-group of serovars within the much larger S. enterica diversity known today.
Figure 2. Phylogenetic relationships of reconstructed ancient and modern S. enterica core genomes.
(a) Maximum likelihood tree of the ancient genomes (>5X coverage) and 2,961 modern S. enterica genomes, including 182,645 SNP positions in the core genome. Selected branches are identified based on predicted serotype provided by EnteroBase and coloured according to host specificity (blue/orange), if they include ancient genomes (red), or not specified (black). (b) Maximum likelihood tree of the AESB including the ancient genomes (>5X coverage) and 463 S. enterica genomes, considering 37,040 SNP positions in the core genome. New ancient genomes are shown in red, and previously reported ancient genomes (Ragna, Tepos) in pink. Ancient human economy is indicated for all newly presented genomes based on archaeological and ancient human genetic information. Low coverage ancient genomes (coverage <5X) are phylogenetically placed (red dashed line) based on all SNP positions covered once: MK3001: 17,324; OBP001: 26,657; and Ragna: 35,465. Modern genomes are collapsed based on their predicted serovar, eBurst group (closely related sequence types), or available metadata in EnteroBase. Host adapted serovars are coloured orange (incl. a pictogram of the host species). Bootstrap values are shown in black at each node (1,000 bootstraps). Black dashed rectangles show extends of Para C Lineage and hierarchical cluster HC2600_1272. Enteritidis P125109 is used as the outgroup.
Emergence of S. enterica cluster HC2600_1272 during the Neolithization process
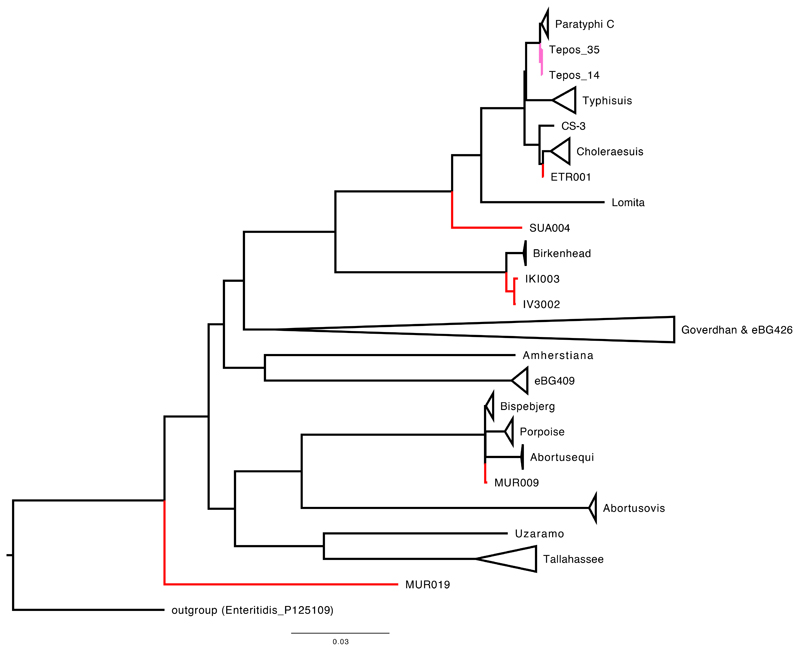
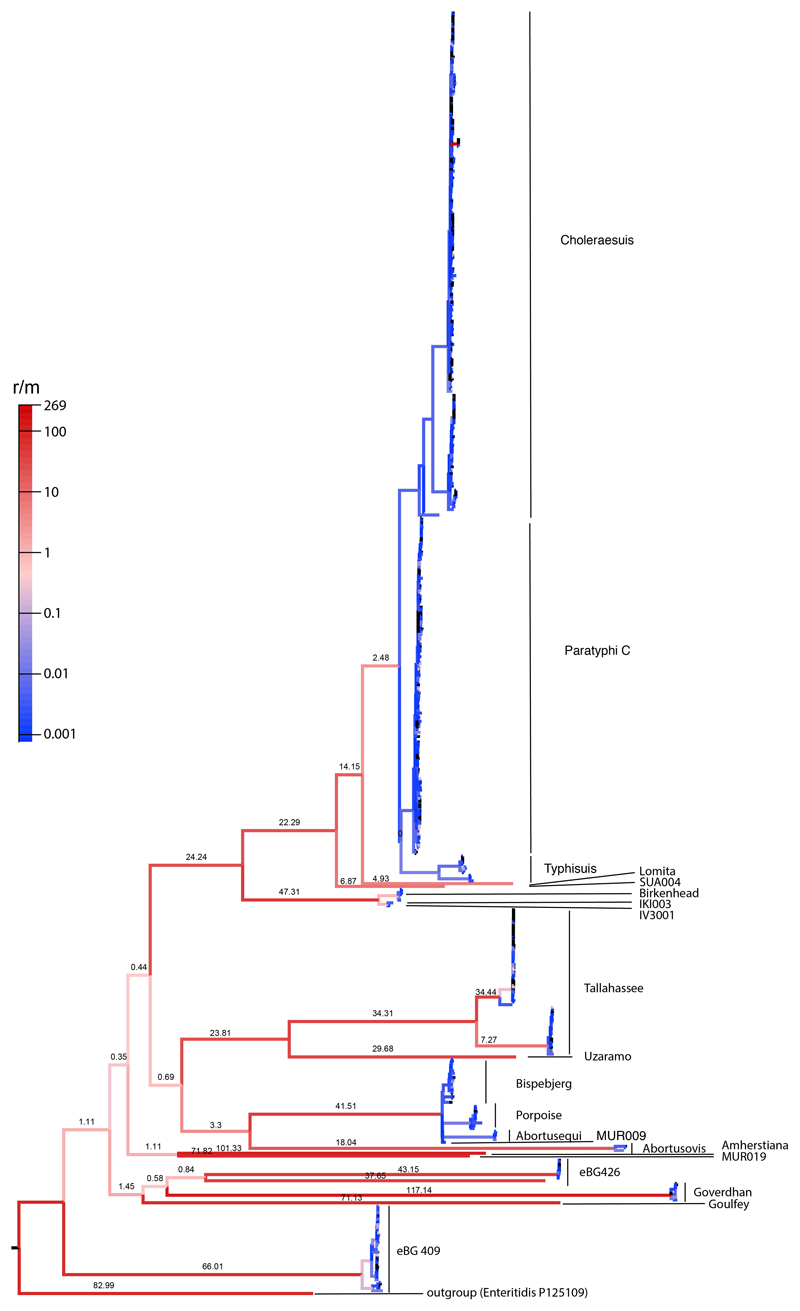
In order to provide greater statistical power for detailed analyses of the AESB, we identified 403 additional modern genomes within EnteroBase that belong to the AESB, and included them in subsequent analyses. A stringent phylogenetic analysis of the AESB was performed with 37,040 SNPs, which could be called in all 460 modern and six ancient genomes. The results demonstrate that the ancient genomes fall on multiple distinct lineages within the AESB (Figure 2B). The same topology for the ancient genomes was found with a more relaxed phylogenetic analysis based on 130,036 SNPs that could be called from at least 95% of the genomes, except for MUR019 and a few modern clades whose topological associations varied (Extended Data Fig. 3). Such variable topological assignments might result from homologous recombination, which is common in S. enterica18. Indeed, we detect high levels of recombination for multiple deep lineages within the AESB, including the sub-branch on which MUR019 is located (Extended Data Fig. 4), suggesting that recombination might cause the topological differences between the stringent and relaxed phylogenies. The topology of the other ancient genomes did not differ between the two analyses, and only these were used for further phylogenetic analyses. However, excluding MUR019 reduces our observation of ancient S. enterica genomes from a transitional forager economy to a single example, MUR009.
The MUR009 S. enterica genome from an individual associated to a transitional forager economy is most closely related to a rare lineage containing diverse isolates (Figure 2B). That lineage includes serovar Abortusequi, which can cause miscarriage in horses14, as well as a group of ST416/417 strains which are possibly adapted to marine mammals as they were exclusively recovered from the lungs of stranded harbour porpoises19. The branch also includes serovar Bispebjerg, which has been isolated from turtles and humans, and serovar Abortusovis, which can cause miscarriage in sheep14.
All S. enterica genomes from ancient (agro-)pastoralists are phylogenetically related to the previously designated “Para C Lineage”9. This lineage includes the invasive serovars Paratyphi C, Typhisuis, Choleraesuis, as well as the rare serovar Lomita (Figure 2B)9. Of these serovars, Choleraesuis and Typhisuis are adapted to pigs. However, Paratyphi C is a major cause of enteric fever in humans, and Choleraesuis and Lomita can also cause systemic diseases in humans20. The previously described “Tepos”8 (Mexico, 500 BP) and Ragna9 (Norway, 800 BP) genomes are at the base of modern Paratyphi C. Of the newly reported ancient genomes, the 1,700 BP genome from Italy (ETR001) defines a novel fourth sub-branch of Choleraesuis. The early Bronze Age genomes SUA004 (Italy; 4,200 BP) and Neolithic OBP001 (Switzerland; 5,200 BP) define a new branch that is basal to the entire Para C Lineage. The other ancient genomes from (agro)-pastoralists (IV3002, IKI003 and MK3001) fall instead outside the Para C Lineage.
The original description9 of the Para C Lineage noted that genomes most closest related to that lineage were in serovar Birkenhead, a rare pathogen of humans21. Hierarchical clustering of core-genome MLST sequence types shows that the Para C Lineage and Birkenhead are both in cluster HC2600_1272, which also includes all ancient genomes from (agro-)pastoralists. Among those the oldest genomes IV3002 (Caucasus; 5,300 BP; early Bronze Age) and IKI003 (Turkey; 5,200 BP; late Chalcolithic) define a novel branch closely related to Birkenhead (Fig. 2B). Notably, despite the large geographic distance between both archaeological sites, the genomes differ by only 170 SNPs (out of 2.4M aligned positions), suggesting a relatively fast dissemination during the Bronze Age, which is also confirmed by other aspects of the archaeological record (Supplementary Note 1). Finally, a low coverage ancient S. enterica genome from southern Russia, MK3001 (2,900 BP), falls basal to the branch subtending the HC2600_1272 cluster (Figure 2B). These data show that S. enterica strains that are part of the HC2600_1272 cluster have been infecting human pastoralists and agro-pastoralists for more than 5,000 years across western Eurasia.
Molecular dating of the ancient S. enterica HC2600_1272 cluster
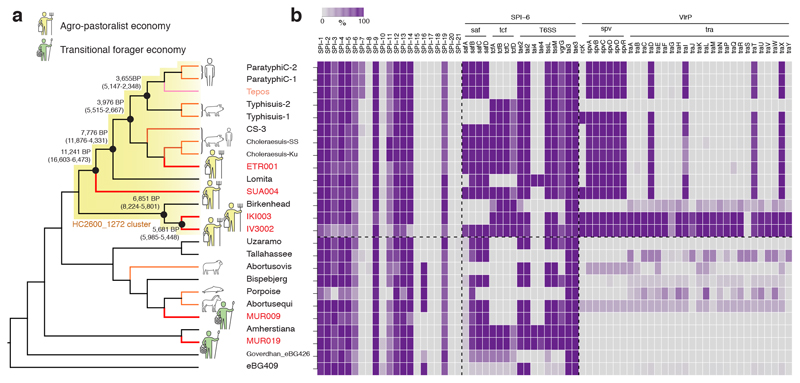
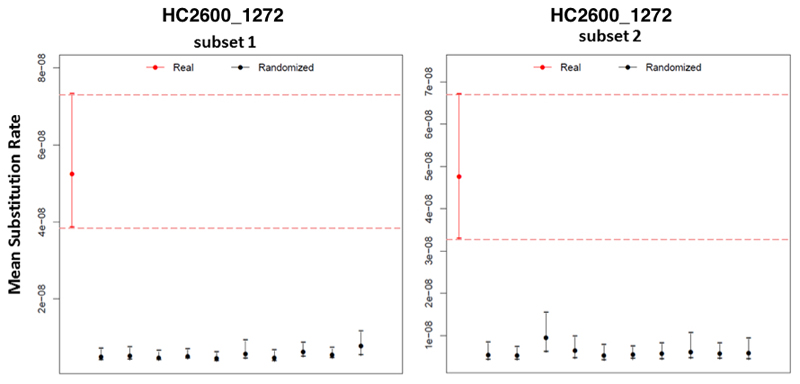
The broad temporal transect of ancient bacterial genomes presented here has the potential to yield a better understanding of the evolutionary timing of S. enterica diversification. Overall, the AESB represents a very deep split within the S. enterica diversity (Figure 2A), possibly even corresponding to a time to the most recent common ancestor (tMRCA) pre-dating the arrival of humans in Eurasia. We did not attempt to date the entire AESB due to a weak temporal signal22 (correlation coefficient R2 between phylogenetic distance and sampling times = 0.04). This may be due to problems in distinguishing single step mutations from homoplasies across the long timescale of the AESB. In addition, our analyses revealed high levels of recombination on several internal branches of the AESB, which may affect branch lengths and can interfere with molecular dating23 (Extended Data Fig. 4). Hence, we restricted our dating analysis to the HC2600_1272 cluster, which yielded a higher correlation, a significant degree of temporal signal (R2 = 0.16), and successfully passed a date randomization test24 (Extended Data Fig. 5). Bayesian phylogenetic molecular dating with BEAST225 confirmed the close relationship of IV3002 and IKI003 with a tMRCA of 5,680 (5,990 – 5,450) years ago (Supplementary Table 2, Figure 3A). The split between SUA004 and the Para C Lineage was estimated around 11,000 (16,600 – 6,470). We also confirm the prior estimates9 of around 4,000 years ago for the emergence of the direct progenitors of Paratyphi C. We note, however, that these estimates have large confidence intervals and that we did not date the entire HC2600_1272 as estimates are potentially affected by non-identified recombination events.
Figure 3. AESB topology, divergence times and gain-loss events.
(a) Topology of the AESB highlighting the hierarchical cluster HC2600_1272 (yellow), with symbols indicating ancient human economy of S. enterica positive samples. Selected divergence time estimates for the HC2600_1272 cluster are shown in years BP (95% highest posterior density intervals, see also Supplementary Table 2). (b) Gain-loss results for all SPI’s and selected genes. For SPI’s, colour gradient relates to the average of %-genes covered over 95% across all strains per branch. For genes, colour gradient according to mean percentage covered across all strains per branch. Tepos: 16th century Mexican.
Genomic architecture differentiates transitional forager and (agro-)pastoralist strains
Differences in S. enterica disease manifestation and virulence are not fully understood and have been linked to variation in genomic content, such as Salmonella pathogenicity islands (SPI) and the virulence plasmid (virP)14. The ancient and modern strains forming the AESB largely show genomic stability, with consistency in SPI presence or absence (Figure 3B, Supplementary Note 2).
One exception is SPI-6, which encodes several putative virulence factors like fimbriae gene clusters saf and tcf, or the Type 6 Secretion System (T6SS)26. Those show variable gene content across different modern and ancient serovars (Figure 3B, Supplementary Note 2). Further, the virulent phenotype of virP is conferred by the spv locus, which is involved in bacteremia27,28 and is present primarily in the HC2600_1272 cluster (Figure 3B, Supplementary Note 2). IV3002 and IKI003 carry in addition the conjugal transfer operon tra, which likely facilitated the original horizontal transfer of virP into the HC2600_1272 cluster29. Lastly, the virulence gene rck, which confers complement resistance30, is present in the ancient S. enterica genomes IV3002, IKI003, and SUA004 but is absent in most modern genomes possibly due to natural selection. Overall, the differential mobile gene content likely contributed to variation in pathogenicity between the HC2600_1272 cluster and other S. enterica within the AESB, as well as between ancient and modern S. enterica within the HC2600_1272 cluster.
Host range of ancient S. enterica strains and evolution of host specificity
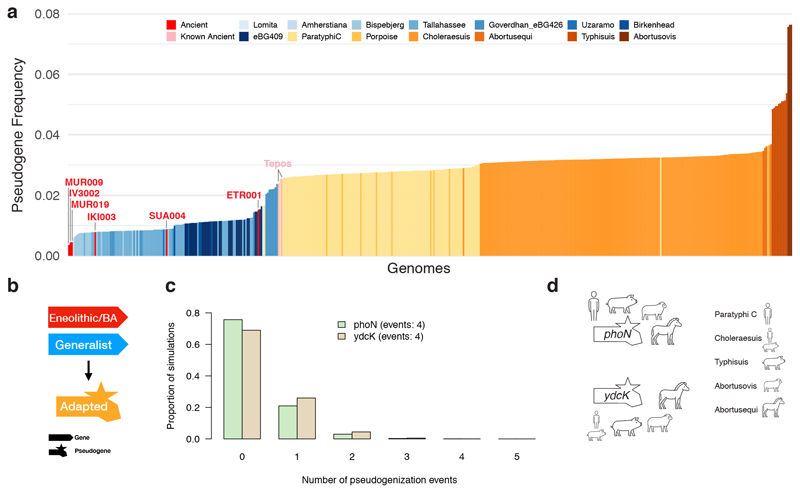
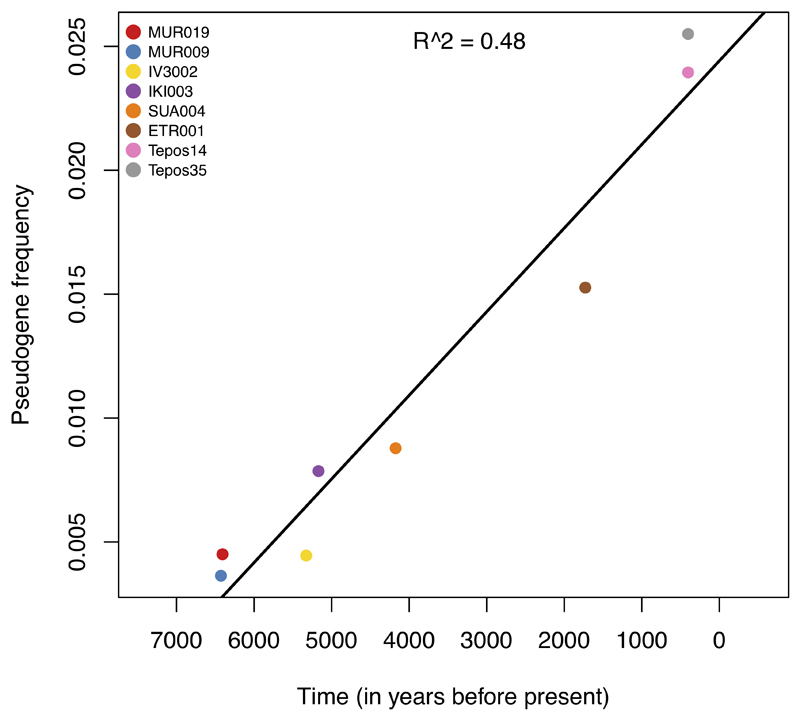
Understanding the host range of the ancient S. enterica is informative about different evolutionary trajectories towards human and mammalian host adaptation across the AESB. Among all ancient S. enterica, only ETR001 is phylogenetically confined within a group of host adapted modern S. enterica (pig/human adapted Choleraesuis), whereas all other ancient genomes are basal to S. enterica adapted to different hosts or basal to non-adapted lineages, suggesting that also those early ancient strains were non-host adapted (host generalists). Accumulation of pseudogenes has been linked to host adaptation in various S. enterica serovars, including Paratyphi C and Choleraesuis31–34. Thus, the pseudogene frequency observed in the ancient S. enterica can provide additional evidence about their host range even though we cannot predict definitely host specificity from genomes alone. We used an unbiased set of over 8,000 S. enterica pan genes to infer pseudogenes and observed, as expected, an increase in pseudogenization from host generalists to host adapted serovars on the AESB (Figure 4A; Supplemental Data 1). Strikingly, all newly reported ancient genomes are in the range of host generalists and the oldest genomes, MUR009 (14), IV3002 (15), and MUR019 (18) have the lowest pseudogene frequency within the entire AESB (Figure 4A). Among the ancient genomes, ETR001 has in accordance with its archaeological age and phylogenetic placement the highest pseudogene frequency, which is close to the frequency of Paratyphi C strains and indicates it might have been host adapted. Interestingly, the accumulation of pseudogenes correlates with archaeological age (R2 = 0.48, Extended Data Fig. 6). Using linear regression we calculate the rate of pseudogenization across the ancient samples to be approximately one gene per 75 years, which extrapolates towards frequencies observed today in human adapted Paratyphi C. Taken together, the phylogenetic placement and low frequency of pseudogenes in early ancient genomes suggests that prehistoric systemic S. enterica infections in humans were caused by host generalists.
Figure 4. Pseudogenes and evolution of host adaptation across the AESB.
(a) Relative frequency of pseudogenes for each strain of the AESB. Ancient genomes are identified and host generalists are shown in blue and host adapted in orange. (b) Illustration of model used to infer evolution towards host adaptation. (c) Simulated expectation of candidate genes (phoN in green, ydcK in beige) to harbour randomly distributed pseudogenization events using 10,000 simulations. (d) Host adapted S. enterica serovars that harbour a phoN or ydcK pseudogene. BA: Bronze Age, Tepos: 16th century Mexican.
The AESB harbours six different host adapted S. enterica serovars, several serovars that are host unrestricted, and the predicted host unrestricted ancient strains older than 3,000 years. This provides an opportunity to study the evolution of bacterial host adaptation within the last six millennia. Notably, all modern host adapted serovars carry largely distinct sets of pseudogenes irrespective of relatedness (Extended Data Fig. 7), which is in line with previous results in S. enterica and suggests a primarily independent evolution of pseudogenes31,32. However, shared pseudogenes that are formed independently likely represent key changes necessary for host adaptation. Here we harness the vast serovar diversity present on the AESB to test for pseudogenization events that may have facilitated the adaptation towards different mammalian hosts (Figure 4B). We identified 29 candidate genes that harbour two or more independent pseudogenization events, which have different functional roles including metabolism, transcription, and biofilm formation (Supplementary Table 3). Out of those, two genes harbour an excess of pseudogenization events based on random simulations (Bonferroni corrected p-value of 0.006 (phoN) and 0.02 (ydcK); Figure 4C; Supplementary Table 4) and are lost in four host adapted serovars (Figure 4D). Notably, the top candidate phoN is regulated by PhoPQ and can induce a strong antibody response during systemic Salmonella infections in humans and mice, even though its exact role is not yet understood35. Altogether, the results indicate that convergent evolution in terms of pseudogene formation contributed to S. enterica host adaptation.
Discussion
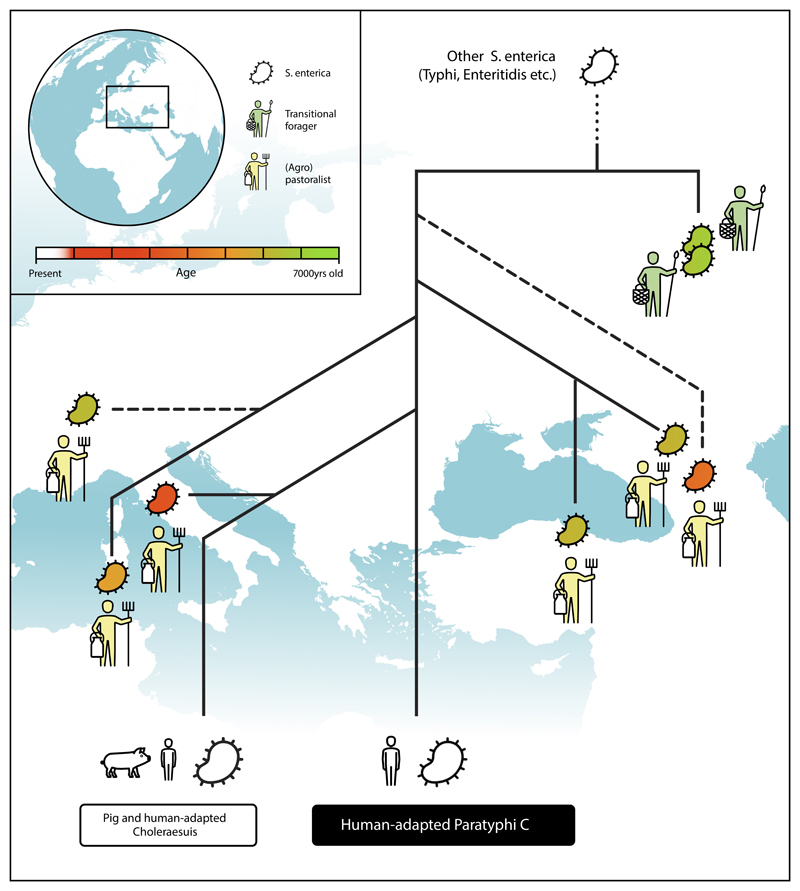
Here we elucidate the evolutionary history of S. enterica interwoven with the dramatic changes in human lifestyle during the spread of Neolithic economies1 (graphical abstract in Extended Data Fig. 8). Therefore we harness ancient bacterial and human DNA obtained from fossils together with their archaeological record. We present eight ancient Salmonella genomes from as early as 6,500 years ago isolated from ancient pastoralists, agro-pastoralists, and transitional foragers. All are phylogenetically confined within the AESB, suggesting it represented a common yet diverse group of S. enterica that infected humans in prehistory. Apart from the ancient genomes, the AESB contains the human adapted serovar Paratyphi C and the majority of known animal adapted S. enterica serovars.
All ancient genomes were recovered from the pulp chamber of human teeth. The pulp chamber is supplied by blood during life and after death well insulated from environmental conditions, which allows to conclude that human pathogenic bacteria found in the pulp chamber likely originate from systemic disease present at time of death15. Thus, our findings highlight systemic S. enterica infection from strains part of the AESB as a human health concern during the last six millennia of human prehistory. It is notable that none of the current predominant causes of invasive salmonellosis in humans were found, such as serovars Typhi and Paratyphi A. Possibly these were less common causes of systemic human disease across western Eurasia in the past.
The newly reported ancient Salmonella strains most likely caused systemic salmonellosis despite their lack of SPI-7, a pathogenicity island contributing36 to paratyphoid fever by Paratyphi C and typhoid fever by Typhi. Moreover, the early S. enterica older than 3,000 years were possibly host generalists and were not specifically adapted to humans. The suggestion that they were generalists is supported by the ability of the modern descendants of some of their phylogenetic neighbours to cause disease in a variety of mammals, and by the relatively low frequency of pseudogenes, which are thought to increase in number upon host adaptation31–34.
The Neolithization process has caused the first epidemiological transition, where the introduction of domesticated animals, intensification of human-animal co-residence, and changes in mobility are thought to have led to the emergence of new zoonotic diseases in humans through increased exposure to pathogens2,3,5,37,38. We reconstructed two S. enterica genomes from ancient transitional foragers excavated in a single site in Russia but are only able to confidently place one of them in the phylogeny, which precludes general conclusions about the diversity of S. enterica infections in transitional forager populations and its geographic spread. However, we reconstructed six ancient S. enterica genomes from (agro-)pastoralists spanning over five millennia of human cultural evolution across western Eurasia and all are within the HC2600_1272 cluster that includes human adapted Paratyphi C. This suggests that progenitors to Paratyphi C evolved within pastoral and agro-pastoral societies during the Neolithization process and provides evidence that the first epidemiological transition facilitated the emergence of human-specific Paratyphi C. However, we note that our ancient metagenomic data screened for S. enterica is biased towards human samples from the Neolithization process and that the HC2600_1272 cluster emerged possibly before the Neolithic transition in a currently unknown context. In order to better understand the origin and range of hosts infected with early strains from the HC2600_1272 cluster, more ancient metagenomic data from early human groups as well as faunal remains are necessary.
The origin of human-specific Paratyphi C9 was previously thought to be a result of a spillover event from pigs to humans around 4,000 years ago due to the close relationship between human- and pig-adapted lineages. Our identification of putative host generalist strains in humans as early as 5,500 years ago (IV3002, IKI003, SUA004), that are phylogenetically basal to human- and pig-adapted serovars, renders the pig-origin hypothesis unlikely. Our results rather support two different hypotheses: (i) that pig-adapted serovars resulted from an anthroponosis, i.e. a spillover from humans to pigs39, or (ii) that adaptations to humans and pigs occurred via independent processes during the Neolithization within a permissive environment that led to continuous S. enterica exposure and subsequent infection40. An independent adaptive history is further supported by the observed small overlap of pseudogenes between host-adapted serovars. Ultimately, additional sampling, including ancient animal remains, will be required to lend credence to either hypothesis and to further elucidate the evolutionary history of S. enterica and other pathogens.
Materials and Methods
Sequencing library preparation
Sample processing took place in dedicated ancient DNA facilities in the Max Planck Institute for the Science of Human History in Jena and the Palaeogenetics laboratory at the University of Tübingen. Teeth were cut at the enamel-dentin junction and sampled in the pulp chamber with a dentist drill. Tooth powder was extracted41 and the resulting DNA extract was transformed in either double or single stranded (only IKI003) genetic libraries with the use of full, partial or no UDG (uracil DNA-glycosylase) treatment in order to fully, partially or not remove the characteristic C to T substitutions towards both ends of ancient DNA molecules, respectively42–45. Genetic libraries were double indexed and amplified before shotgun sequencing. Those libraries identified as positive for S. enterica after screening were further captured using an in-solution target enrichment of Salmonella enterica subsp. enterica DNA8. The same libraries were used for a human genome-wide capture that targeted ~390,000 SNPs for ETR001 and ~1.2 million SNPs for all the other samples46. In addition, negative controls were taken along initial library preparation and S. enterica capture. All sequencing runs were performed on Illumina platforms in either single or paired-end mode.
Detection, authentication and genome reconstruction
For screening we used the software package HOPS47, which utilizes MALT8, a software that aligns sequencing data to a custom-made reference database of all 6,247 complete bacterial genomes from NCBI (obtained December 2016) using spaced seeds. Reads were mapped with at least 85% nucleotide identity, and for taxonomic placement via the LCA (lowest common ancestor) algorithm we retained only alignments within the top 1% of all alignments per read (max. 100). For candidate detection, we interrogated the Salmonella enterica subsp. enterica taxonomic node, and required a minimum of 10 assigned sequencing reads, which show no or only few mismatches (a declining edit distance distribution). This step is crucial to avoid false positives due to incomplete genomic representation of unknown environmental bacteria in our database7. Further, we required presence of typical ancient DNA damage48, i.e. C to T or G to A mismatches at the end of sequencing reads. We screened 2,739 ancient metagenomic datasets obtained from human remains excavated in Eurasia and South America that were preliminary archeologically classified into the following coarse groups: Eneolithic/Chalcolithic (95), Iron Age (61), Late Neolithic Bronze Age (1,027), Medieval (382), Mesolithic (135), Neolithic (548), Paleolithic (183), Post-Columbian (46), Pre-Columbian (127) and other (135). From those, 24 candidates had positive hits on the Salmonella enterica subsp. enterica taxonomic node.
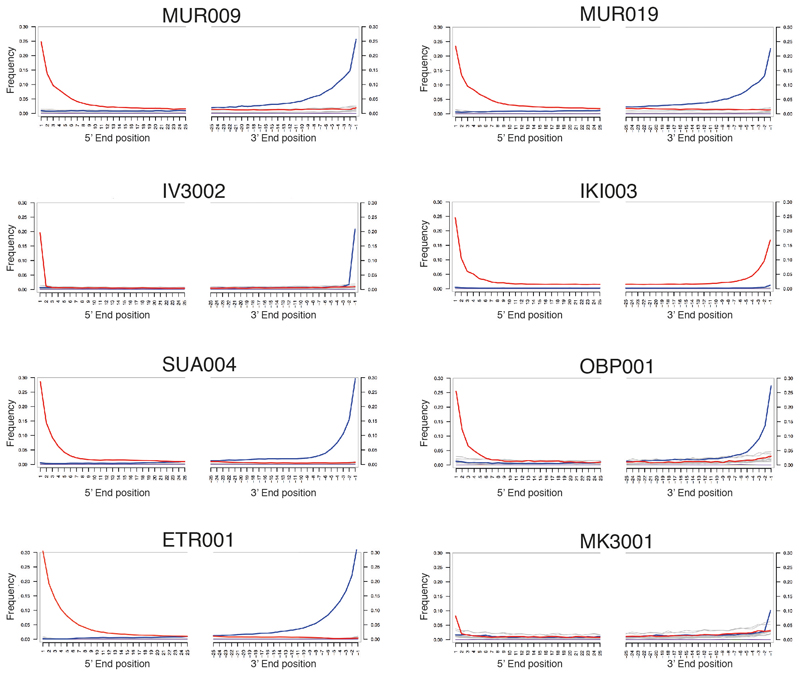
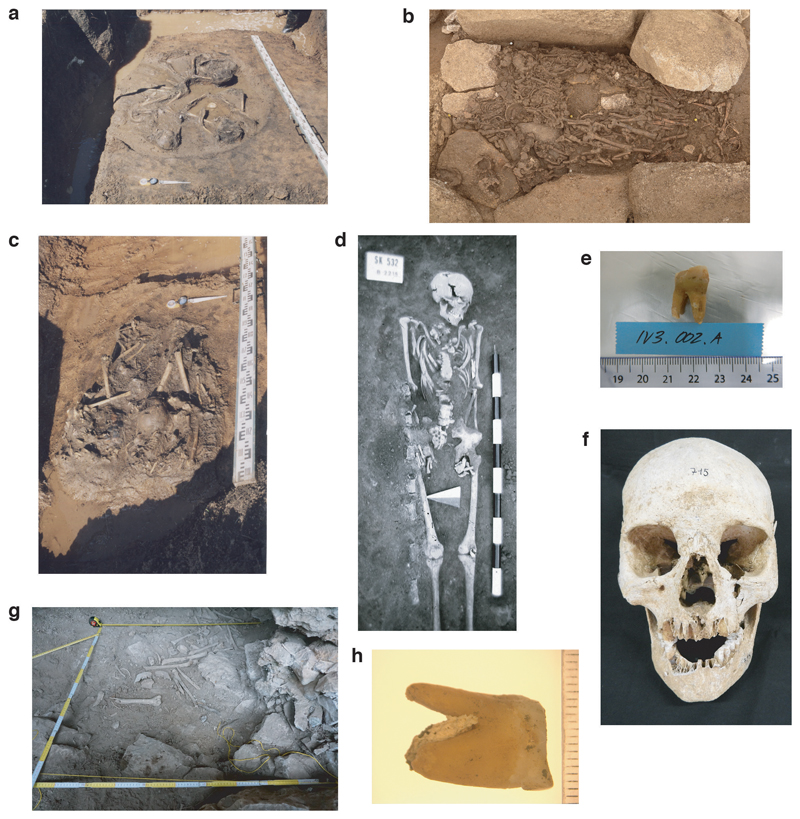
We enriched all candidate libraries for S. enterica DNA using a previously presented in-solution capture reagent based on 67 S. enterica reference genomes8. Each library was sequenced for about 5M reads and mapped to the Paratyphi C RKS4594 genome (Acc#: NC_012125) using BWA49 with non-stringent criteria (-n 0.01) within the software package EAGER50. We use the Paratyphi C RKS4594 reference, because it regularly occurred among the top hits in the screening analysis, and the overall little divergence (max. 1.3% genome-wide) among S. enterica reference core genomes suggests no major effects by reference bias. The resulting data was evaluated for a minimum genome-wide coverage of 0.3X with 15% of the reference covered. For samples with higher genome-wide coverage the %-reference covered scaled up linearly. In addition, DNA damage (>10% C>T mismatches at 3’ end) had to be observable, which led to eight samples positive for S. enterica (Extended Data Fig. 9). All eight archaeological specimen are shown in Extended Data Figure 10. The remaining 16 libraries had either too little endogenous S. enterica DNA or were false positives due to the presence of closely related species harbouring genomic elements aligned to the Salmonella enterica subsp. enterica node by MALT. All negative controls were negative. For all positive samples (except IKI003), we generated two UDG full treated libraries (removing damage) from the initial ancient DNA extracts, which provides high quality data for further analysis.
Library preparation of IKI003 was performed in the clean room facilities dedicated to ancient DNA work at the MPI EVA in Leipzig. Two single-stranded Illumina sequencing libraries44 were generated from 30 µl extract each according to an automated version of the protocol on an Agilent Technologies Bravo NGS Workstation without previous uracil-DNA-glycosylase (UDG) treatment. Both libraries were double-indexed with a unique combination of 7 base pair indices51.
An in-solution S. enterica capture was repeated for each library and all libraries were sequenced to exhaustion (between 23 to 133M reads). For ETR001, SUA004, OBP001, MUR009, MUR019 only the UDG-treated data was used for downstream analysis. In order to maximize genome-wide coverage we merged for IV3002 and MK3001 the UDG data with the initial UDG-half capture data trimmed at the 3’ and 5’ tail by two bases in order to cleave ancient DNA damage. IKI003 underwent single-stranded library preparation without any UDG treatment, and each sequencing read was trimmed by two bases to minimize impact of ancient DNA damage in all subsequent analyses. Through this approach we generated high quality data with as few as possible alignment mismatches due to ancient DNA damage. We reconstructed all genomes through a mapping strategy to the Paratyphi C reference genome. Again, all data was processed through EAGER, but with stringent BWA mapping parameters (-n 0.1) leading to eight reconstructed genomes, with six of them having an average coverage of 7X and above.
Modern S. enterica genomes and phylogenetic analysis
For initial phylogenetic placement of the ancient genomes we used a recently published set of 2,961 S. enterica genome assemblies from EnteroBase9,10, where each genome assembly represents a random pick of a unique ribosomal sequence type (rST). The rST is a multilocus sequence type based on 53 genes encoding ribosomal proteins, used to efficiently capture S. enterica diversity52. EnteroBase contains over 140,000 S. enterica genomes and this approach allows a drastic reduction in the number of genomes, and hence a reduction in computational resources necessary for a comprehensive analysis.
Each genome was split into kmers of 100 bases with a step size of 1 base, and mapped against the Paratyphi C RKS4594 reference following the same stringent criteria used for the ancient genomes (see above). In addition, we include two previously published 16th century Mexican (Tepos) and one medieval Norwegian (Ragna) genome using the publicly available raw reads8,9. An alignment of all variable sites was built for all modern and ancient genomes using the tool multivcfanalyzer (v. 0.87-alpha)53. Repetitive and highly conserved regions of the Paratyphi C RKS4594 reference were excluded from SNP calling to avoid spurious read mapping8. In order to avoid spurious SNP calls every site reported per genome had to have at least 5-fold coverage and a genotype support of at least 90%. We define the core genome of all alignments by using only sites shared across all genomes (complete deletion), which requires to remove ancient genomes with a genome-wide coverage below 5-fold (MK3001, OBP001, and Ragna) to avoid excessive loss of positions, leading to an alignment with overall 182,645 SNPs. A maximum-likelihood tree was built with RAxML54 using the GTRCAT model and 100 bootstraps (Figure 2A). We use the CAT approximation of rate heterogeneity compared to GAMMA as it is computational much more tractable with large datasets and produces comparable results55.
The ancient genomes are phylogenetically placed in the AESB, which harbours merely 60 out of the 2,961 genomes. Notably, we observe uncertainty for very deep lineages based on bootstrap support and high levels of recombination, including MUR019, which thus cannot be placed with high confidence within the vast S. enterica genomic diversity. For detailed analysis, we obtained from the 140,000 genomes available on EnteroBase (late March 2018) all genome assemblies that have one of the unique rST’s identified on the AESB, leading to a total of 469 genome assemblies from EnteroBase (http://enterobase.warwick.ac.uk/species/senterica/search_strains?query=workspace:12971, which represents the known genetic diversity of the AESB. Those include several host generalists recovered from various animal species (Tallahassee, Uzaramo, Goverdhan) and/or by food safety surveillance laboratories (e.g. eBG 409 and 426)56–61. In addition, we add the Enteritidis P125109 reference genome as an outgroup, because it is phylogenetically close to the AESB. Data processing and filtering followed the same guidelines as above leading to a SNP alignment with 37,040 positions. A maximum-likelihood tree was built with RAxML54 using the GTRCAT model and 1000 bootstraps (Figure 2B). Due to their ambiguous placement, we removed two genomes: FDA00002391 and FDA00002392. We estimated the phylogenetic placement of the three ancient genomes filtered due to coverage (MK3001, OBP001, and Ragna) by adding them to the existent SNP alignment with relaxed SNP calling criteria. We required only 1X per site to call a genotype, which lead to the following number of callable sites: MK3001 - 17,324; OBP001 - 26,657; and Ragna - 35,465 out of the 37,040 SNPs. Missing or ambiguous sites were typed as N. In addition, we used a more relaxed filtering approach by using all SNPs shared by at least 95% of all sequences, which led to 130,036 SNPs and is shown in Extended Data Fig. 3.
Hierarchical clustering of core-genome MLST sequence types at multiple levels of pair-wise linkage distances was done using EnteroBase62.
Quantification of recombination across the AESB
The alignment based on all SNPs shared by at least 95% of all sequences were used for recombination detection, which covered 83% of the sites in the Paratyphi C RKS4594 reference genome. A total of 130,597 SNPs were identified in these relaxed core genomic sites, and assigned using the EToKi-phylo62 onto branches in the tree using a maximum likelihood method with a symmetric transition model63. We found 49,101 sites (38%) were mutated on multiple independent occasions (homoplasies) resulting in a total of 241,275 substitution events. RecHMM64 was then applied on these substitutions to estimate the number of recombination events per substitution (Extended Data Fig. 4).
Human genetic analysis
Using EAGER50, all sequencing reads from the human genome-wide capture data were trimmed, paired-end data merged, and mapped against the human reference genome, using a mapping quality filtered (MQ>30) and duplicates removed. Typical ancient DNA damage pattern was assessed using mapDamage2.065.
Individual mitochondrial consensus sequences were reconstructed using schmutzi (base quality > 20)66, and mitochondrial DNA haplogroups were assigned using HaploGrep67, and further used for mitochondrial DNA contamination estimation. Nuclear contamination for male individuals was estimated based on heterozygosity at X-chromosome SNPs using ANGSD68. Sex determination was by comparing the coverage at targeted SNPs on X- and Y-chromosomes relative to SNPs on the autosomes (Supplementary Table 1).
For nuclear DNA analyses (all samples except IKI003) we minimized spurious SNP calls by minimizing the amount of ancient DNA damage in the data. Sequencing reads of fully UDG treated libraries were kept untrimmed, sequencing reads from partially UDG treated libraries were trimmed by 2bp on both ends, and sequencing reads from non-UDG treated libraries were trimmed of 10bp on both ends. The targeted set of SNPs was genotyped by pseudohaploid calls with PileupCaller (https://github.com/stschiff/sequenceTools/tree/master/src-pileupCaller). For IKI003, the only single stranded libraries, genotyping was performed on both, 10bp trimmed and untrimmed sequences retaining calls deriving from untrimmed data except for C to T mutations, which presence was inspected in the trimmed data to avoid mistaking DNA damage as real mutations. The genotype data was merged with the Human Origins dataset69 comprising ~7000 ancient and modern individuals. For nuclear DNA analysis, we require at least 15,000 SNPs overlapping with the Human Origins dataset in each sample, which was not fulfilled for two individuals (OBP001 and MUR019), and thus excluded for nuclear DNA analyses. A principal component analyses (PCA) was performed using smartpca70. Principal components were computed on 65 present-day West Eurasian populations69 onto which ancient individuals were projected (parameters lsqproject: yes, shrinkmode: yes). Model-based clustering analysis using ADMIXTURE71 was done using the complete dataset (parameters: –s time –cv) with K=3 to K=16 and each repeated five times (Extended Data Fig. 2). The run with highest likelihood was reported for each K (Extended Data Fig. 2).
Molecular dating
The temporal signal of the full AESB was evaluated with the software TempEst22, which employs a root to tip regression of genetic distances on sampling times. Due to the lack of a signal on the entire AESB, further analyses were done using a reduced datasets9. In total, we analyse two subsets of reduced replicates of the agro-pastoralist branch. Both contain ETR001, CS-3, the two 16th century Mexican samples (Tepos), Lomita, IV3002, IKI003, SUA004, all five sequences from the serovar Birkenhead, 38 randomly sampled sequences, and a sequence from the serovar Bispebjerg as the outgroup. All major lineages of the HC2600_1272 cluster were represented in the subsets
The TempEst analysis yielded a temporal signal for the pastoralist subsets (R2 = 0.17 and 0.16). The presence of temporal signal in the subsets was further evaluated with a date randomization test72. We generated 10 replicates with randomized sampling dates for each alignment, and the substitution rates were estimated with the software BEAST225, using a relaxed lognormal molecular clock, a general time reversible model of nucleotide substitution with six gamma categories (GTR+γ6) and a Bayesian birth-death tree prior73 with constant-through-time birth and death rates and an upper bound of 100,000 years. This tree prior allowed explicit modelling of the fact that the proportion of samples is lower in the past than near the present. Through a monophyly constraint the respective outgroup was enforced to be an outgroup in the analysis.
The two subsets of the agro-pastoralist branch passed the date randomization test (Extended Data Fig. 5), and the dating analysis was conducted with BEAST2 as described above. As only SNP alignments were used, we corrected for ascertainment bias by specifying the number of invariable sites per base in relation to the Paratyphi C RKS4594 reference genome. For each dataset, multiple BEAST replicates with 400 million MCMC steps were done and subsequently combined with the software LogCombiner, after removing a 10% burn-in. This yielded effective sample sizes above the standard threshold of 200 for all parameters. The posterior estimates for the main internal node dates and branch rates are summarized in Supplementary Table 2. The files specifying the BEAST2 analysis, the posterior distributions of all parameters and the maximum clade consensus trees are are available on figshare, with a link provided in the Data Availability Statement for this paper.
14C Dating
Collagen was extracted from the bone or tooth sample, purified by ultrafiltration (fraction >30kD) and freeze-dried. Collagen was combusted to CO2 in an Elemental Analyzer and converted catalytically to graphite. Accelerator Mass Spectrometry dating was performed to estimate the 14C age of each sample. The 14C ages are given in BP (before present) meaning years before 1950. In order to provide absolute calendar ages the 14C ages need to be calibrated. The calibration was done using the dataset INTCAL1374 und the software SwissCal 1.0 (L. Wacker, ETH-Zürich). The results of the calibration were reported as “Cal 1-sigma” and “Cal 2-sigma” using the 1-sigma and 2-sigma uncertainty of the 14C ages, respectively. We report all ages in the format: “Cal 2-sigma start – end BP (uncalibrated radiocarbon years, laboratory number).
Genomic architecture
GenBank files for SPI-1 to SPI-12 and SGI-1/2 were obtained from PAIDB75, and all annotated CDS sequences extracted. Additional sequences for SPI-13 to SPI-21 were obtained from respective references76–80, as well as a SPI-6 annotation from the Para C Lineage9. GenBank files for plasmid annotations were obtained from NCBI. We mapped each genome (fragmented in kmer of 50b with step-size 1) and the capture probes to each reference using BWA mem81, and filtered all alignments using picard tools (CleanSam, MarkDuplicates). For each annotation, we obtained the number of bases covered at least once using bedtools (genomecov -1)82. For analysis we considered only genes that were covered by at least 95% with the DNA capture probe set.
Pseudogene analysis
Pseudogenes were inferred based on premature stop codons or frameshift mutations relative to an intact gene across the S. enterica pan genome. The previously published pan genome of S. enterica (http://enterobase.warwick.ac.uk/schemes/Salmonella.wgMLST/exemplar.alleles.fasta.gz) is based on all CDS from 537 representative genomes, which were grouped based on sequence identity and cleaned for paralogs yielding 21,065 genes10. We filtered the complete pan genome for genes that were 100% covered by the probe set used for DNA capture, leading to 8,726 genes used for inference. For each strain present on the AESB, we aligned the genome to the refined pan gene set using BWA mem81, which allows for overhang alignments (soft clipping) at the end of the reference, which is necessary for correct alignment to single genes. All alignments were filtered for duplicates, a mapping quality of 37 or above, and realigned (indel realignment) before SNPs and insertion/deletion were called using GATK v3.583. For each strain and each gene, we built a consensus sequence using GenConS (-total_coverage 2, -major_allele_coverage 2, -consensus_ratio 0.75, -punishment_ratio 0.8)84 and inferred pseudogenes as genes with premature stop mutation or frame-shift mutation. For each genome, we consider only genes that were covered by at least 90% for analysis. We report in Figure 4A the frequency of pseudogenes relative to the absolute number of genes analysed in each respective genome.
To test for signatures of convergent evolution in host adapted serovars we assess for each gene all observed independent pseudogenization events. We select candidate pseudogenes associated with convergent evolution towards host adaptation on the AESB by filtering pseudogenes for the following criteria: (i) having at least two fixed parallel (independent) pseudogenization events across the host adapted serovars (Abortusovis, Abortusequi, Porpoise, Typhisuis, Choleraesuis, Paratyphi C), and (ii) it is not a pseudogene in the ancient host generalist from the Eneolithic and Bronze Age (MUR019, MUR009, IV3002, IKI003, SUA004) as well as modern host generalist groups (Bispebjerg, Goverdhan_eBG426, eBG409, Tallahassee, Birkenhead). The probability to observe the respective number of pseudogenization events (or more) per gene with length L was simulated (N = 10,000) by randomly distributing the observed number of pseudogenization mutations in host-adapted serovars (1,432) across the average pan-genome (size 3,828,459 bp (σ = 69,974), results shown in Supplementary Table 3). Bonferroni correction was applied to all simulation-derived probabilities to correct for multiple testing.
Extended Data
Extended Data Fig. 1. Ancient human population genetic analysis.
(a) PCA of newly reported ancient individuals with sufficient data (in red) and selected published ancient and modern individuals are projected onto principal components built with present-day West Eurasian populations (grey dots). (b) ADMIXTURE analysis (K=10) of newly reported ancient individuals and relevant published ancient and modern individuals sorted by genetic clusters. Overview ancient human genetic data Supplementary Table 1 and further analysis Extended Data Fig. 4. EHG, Eastern hunter gatherer; E, Early; M, Middle; HG, hunter–gatherer; N, Neolithic; C, Caucasus; S, Scandinavian; W, Western; BA, Bronze Age.
Extended Data Fig. 2. Summary human genetic analysis.
(a) ADMIXTURE analysis (K = 3 - 16) of newly reported ancient individuals (bold horizontal text) and published ancient and modern individuals sorted by genetic clusters and geographic origin (Europe, Near East and Caucasus, Asia, America, Africa). Each K was run five times and the replicate with the highest likelihood is reported. Ancient MK3001 shows Asian genetic ancestry components represented by Nganasan, Kankanaey, Atayal, and Ami. (b) Box plot of five cross-validations (CV) values for every K calculated in ADMIXTURE. EHG, Eastern hunter gatherer; E, Early; M, Middle; HG, hunter–gatherer; N, Neolithic; C, Caucasus; S, Scandinavian; W, Western; BA, Bronze Age.
Extended Data Fig. 3. Maximum likelihood phylogeny of the AESB based on SNPs in positions present in 95% of strains.
Maximum likelihood tree of the AESB including the high coverage ancient genomes and 463 S. enterica genomes, considering all SNPs covered in at least 95% of strains (130,036 SNPs). New ancient genomes are shown in red, and previously reported ancient genomes (Tepos) in pink.
Extended Data Fig. 4. Recombination rate estimates for the AESB.
Estimated recombination rate is shown as recombination event per mutation event (r/m) and indicated on top of branch and by branch color. Recombination events have been inferred using all positions shared by 95% of strains from the AESB and are here reported for the SNPs shared by all strains on the AESB (correspond to maximum likelihood phylogeny shown in Figure 2B). Maximum likelihood tree including all SNPs shared by at least 95% of strains from the AESB is shown in Extended Data Fig. 3.
Extended Data Fig. 5. Temporal signal analysis.
Results of the date randomization test for two subsets of the HC2600_1272 cluster (agro-pastoralist branch). Circles represent mean substitution rate estimations with error bars representing 95% highest posterior density (HPD) intervals. For each subset 10 date randomizations were done. Significant temporal signal is indicated by non-overlapping HPD intervals between real data (red) and the randomizations (black), which is the case for both subsets.
Extended Data Fig. 6. Correlation between pseudogene frequency and time for all ancient genomes with mean genome-wide coverage above 5X.
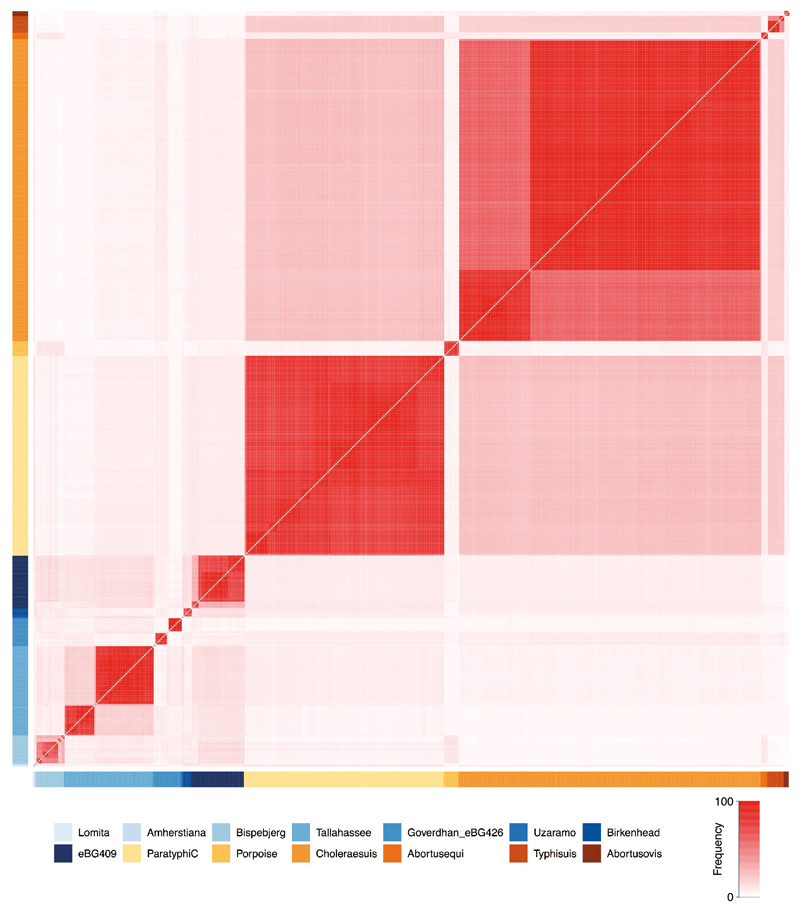
Extended Data Fig. 7. Proportion of shared pseudogenes between strains across the AESB.
Proportion of pseudo Temporal signal analysis.gene-sharing (0-100%) between strains on the AESB is shown in tones of red. Strains are ordered by phylogenetic branch and coloured accordingly.
Extended Data Fig. 8. Graphical abstract.
Extended Data Fig. 9. Mismatch distribution along positions at the 5’- and 3’- end of mapped sequencing reads.
C to T changes indicated in red and G to A changes in blue, all other substitutions in grey. IV3002 and MK3001 are UDG-half treated, which leads to observable damage only in the terminal positions. Plots generated with mapDamage2 (Jónsson H. et al, Bioinformatics 2013).
Extended Data Fig. 10. Photographs of archaeological specimens that harboured ancient S. enterica DNA.
(a) MUR009; (b) OBP001; (c) MUR019; (d) IKI003; (e) IV3002; (f) ETR001; (g) SUA004; (h) MK3001.
Supplementary Material
Acknowledgements
We thank the Pathogenomics group at MPI SHH, and the Lieberman lab at MIT for critical discussion. We thank M. O’Reilly for support in graphical design.
Funding
Funding for this study came from the Max Planck Society and the European Research Council (grant agreement n° 771234 PALEoRIDER). F.M.K. was supported by the DFG grant KE 2408/1-1, and a generous MPI EVA guest office. I.S. is supported by the SNF grant CR31I3L_157024. EnteroBase was supported by BBSRC BB/L020319/1. N-F.A., Z.Z. and M.A. were supported by Wellcome Trust grant 202792/Z/16/Z.
Footnotes
Author Contributions
Conceptualization: F.M.K., A.He., J.K.; Writing – Original Draft: F.M.K.; Writing – Review & Editing: F.M.K., C.P., K.B., S.R., D.K., W.H., M.A., A.He., J.K.; Formal Analysis: F.M.K., C.P., L.R.E-G., D.K.; Investigation: F.M.K., C.P., M.A.S., G.U.N., A.F., S.S., M.B., A.W., M.M., S.N., R.T., Z.Z.; Resources: F.M.K., R.H., Å.J.V., A.K.L., A.Kh., A.C., S.H., A.B.B., A.Ka., A.R.K., V.E.M., P.W.S., S.V., M.Z., A.R., D.C., R.S., J.B., M.G.G., N.S., A.Ha., M.R., I.S., S.L., Y.S.E., N-F.A., Z.Z., M.A., S.R., W.H.; Supervision: A.He., J.K.
Data availability
Raw metagenomic data used to reconstruct ancient S. enterica genomes as well as unpublished ancient human DNA are available from the European Nucleotide Archive (Accession number: PRJEB35216, see also Supplemental Data 2). Molecular dating archive containing files specifying the BEAST analysis of the two 50-taxon (argo-)pastoralist data sets, as well as the thinned posterior distributions of all parameters and the maximum clade consensus trees. Available here: https://doi.org/10.6084/m9.figshare.10052084.v1
Competing interests
The authors declare no competing financial interests.
References
- 1.Fowler C, Harding J, Hofmann D. The Oxford Handbook of Neolithic Europe. OUP Oxford; 2015. [Google Scholar]
- 2.Cockburn TA. Infectious diseases in ancient populations. Current Anthropology. 1971;12:45–62. doi: 10.1086/201168. [DOI] [PubMed] [Google Scholar]
- 3.Armelagos GJ, Cohen MN. Paleopathology at the Origins of Agriculture. Academic Press Orlando, FL; 1984. [Google Scholar]
- 4.Larsen CS, et al. Bioarchaeology of Neolithic Çatalhöyük reveals fundamental transitions in health, mobility, and lifestyle in early farmers. Proceedings of the National Academy of Sciences. 2019;116 doi: 10.1073/pnas.1904345116. 12615. [DOI] [PMC free article] [PubMed] [Google Scholar]
- 5.Barrett R, Kuzawa CW, McDade T, Armelagos GJ. EMERGING AND RE-EMERGING INFECTIOUS DISEASES: The Third Epidemiologic Transition. Annual Review of Anthropology. 1998;27:247–271. [Google Scholar]
- 6.Spyrou MA, Bos KI, Herbig A, Krause J. Ancient pathogen genomics as an emerging tool for infectious disease research. Nature Reviews Genetics. 2019:1. doi: 10.1038/s41576-019-0119-1. [DOI] [PMC free article] [PubMed] [Google Scholar]
- 7.Key FM, Posth C, Krause J, Herbig A, Bos KI. Mining Metagenomic Data Sets for Ancient DNA: Recommended Protocols for Authentication. Trends in Genetics. 2017;33:508–520. doi: 10.1016/j.tig.2017.05.005. [DOI] [PubMed] [Google Scholar]
- 8.Vågene AJ, et al. Salmonella enterica genomes from victims of a major sixteenth-century epidemic in Mexico. Nature ecology & evolution. 2018 doi: 10.1038/s41559-017-0446-6. [DOI] [PubMed] [Google Scholar]
- 9.Zhou Z, et al. Pan-genome analysis of ancient and modern Salmonella enterica demonstrates genomic stability of the invasive para C lineage for millennia. Current Biology. 2018;28:2420–2428. e2410. doi: 10.1016/j.cub.2018.05.058. [DOI] [PMC free article] [PubMed] [Google Scholar]
- 10.Alikhan N-F, Zhou Z, Sergeant MJ, Achtman M. A genomic overview of the population structure of Salmonella. PLOS Genetics. 2018;14:e1007261. doi: 10.1371/journal.pgen.1007261. [DOI] [PMC free article] [PubMed] [Google Scholar]
- 11.Kirk MD, et al. World Health Organization estimates of the global and regional disease burden of 22 foodborne bacterial, protozoal, and viral diseases, 2010: a data synthesis. PLoS medicine. 2015;12:e1001921. doi: 10.1371/journal.pmed.1001921. [DOI] [PMC free article] [PubMed] [Google Scholar]
- 12.Kingsley RA, Bäumler AJ. Host adaptation and the emergence of infectious disease: the Salmonella paradigm. Molecular Microbiology. 2000;36:1006–1014. doi: 10.1046/j.1365-2958.2000.01907.x. [DOI] [PubMed] [Google Scholar]
- 13.Kingsley RA, et al. Epidemic multiple drug resistant Salmonella Typhimurium causing invasive disease in sub-Saharan Africa have a distinct genotype. Genome Research. 2009;19:2279–2287. doi: 10.1101/gr.091017.109. [DOI] [PMC free article] [PubMed] [Google Scholar]
- 14.Barrow PA, Methner U. Salmonella in domestic animals. CABI; 2013. [Google Scholar]
- 15.Drancourt M, Aboudharam G, Signoli M, Dutour O, Raoult D. Detection of 400-year-old Yersinia pestis DNA in human dental pulp: An approach to the diagnosis of ancient septicemia. Proceedings of the National Academy of Sciences. 1998;95 doi: 10.1073/pnas.95.21.12637. 12637. [DOI] [PMC free article] [PubMed] [Google Scholar]
- 16.Anthony DW. The horse, the wheel, and language: how Bronze-Age riders from the Eurasian steppes shaped the modern world. Princeton University Press; 2010. [Google Scholar]
- 17.Schulting RJ, Richards MP. Stable isotope analysis of Neolithic to Late Bronze Age populations in the Samara Valley. A Bronze Age landscape in the Russian steppes. The Samara Valley Project. 2016:127–149. [Google Scholar]
- 18.Didelot X, et al. Recombination and Population Structure in Salmonella enterica. PLOS Genetics. 2011;7:e1002191. doi: 10.1371/journal.pgen.1002191. [DOI] [PMC free article] [PubMed] [Google Scholar]
- 19.Haase JK, et al. Population Genetic Structure of 4,12:a:− Salmonella enterica Strains from Harbor Porpoises. Applied and Environmental Microbiology. 2012;78:8829–8833. doi: 10.1128/AEM.02310-12. [DOI] [PMC free article] [PubMed] [Google Scholar]
- 20.Uzzau S, et al. Host adapted serotypes of Salmonella enterica. Epidemiology and infection. 2000;125:229–255. doi: 10.1017/s0950268899004379. [DOI] [PMC free article] [PubMed] [Google Scholar]
- 21.Taylor J, Douglas SH. Salmonella birkenhead: A New Salmonella Type Causing Food-Poisoning in Man. Journal of Clinical Pathology. 1948;1:237–239. doi: 10.1136/jcp.1.4.237. [DOI] [PMC free article] [PubMed] [Google Scholar]
- 22.Rambaut A, Lam TT, Max Carvalho L, Pybus OG. Exploring the temporal structure of heterochronous sequences using TempEst (formerly Path-O-Gen) Virus evolution. 2016;2 doi: 10.1093/ve/vew007. vew007. [DOI] [PMC free article] [PubMed] [Google Scholar]
- 23.Hedge J, Wilson DJ. Bacterial phylogenetic reconstruction from whole genomes is robust to recombination but demographic inference is not. MBio. 2014;5:e02158–02114. doi: 10.1128/mBio.02158-14. [DOI] [PMC free article] [PubMed] [Google Scholar]
- 24.Duchêne S, Duchêne D, Holmes EC, Ho SY. The performance of the date-randomization test in phylogenetic analyses of time-structured virus data. Molecular Biology and Evolution. 2015;32:1895–1906. doi: 10.1093/molbev/msv056. [DOI] [PubMed] [Google Scholar]
- 25.Bouckaert R, et al. BEAST 2: a software platform for Bayesian evolutionary analysis. PLoS computational biology. 2014;10:e1003537. doi: 10.1371/journal.pcbi.1003537. [DOI] [PMC free article] [PubMed] [Google Scholar]
- 26.Rhen M, Mastroeni P. Salmonella: molecular biology and pathogenesis. Horizon Scientific Press; 2007. [Google Scholar]
- 27.Guiney DG, Fierer J. The role of the spv genes in Salmonella pathogenesis. Frontiers in microbiology. 2011;2:129. doi: 10.3389/fmicb.2011.00129. [DOI] [PMC free article] [PubMed] [Google Scholar]
- 28.Gulig PA, et al. Molecular analysis of spv virulence genes of the salmonella virulence plasmids. Molecular Microbiology. 1993;7:825–830. doi: 10.1111/j.1365-2958.1993.tb01172.x. [DOI] [PubMed] [Google Scholar]
- 29.Rotger R, Casadesús J. The virulence plasmids of Salmonella. International Microbiology. 1999;2:177–184. [PubMed] [Google Scholar]
- 30.Hackett J, Wyk P, Reeves P, Mathan V. Mediation of serum resistance in Salmonella typhimurium by an 11-kilodalton polypeptide encoded by the cryptic plasmid. Journal of Infectious Diseases. 1987;155:540–549. doi: 10.1093/infdis/155.3.540. [DOI] [PubMed] [Google Scholar]
- 31.Langridge GC, et al. Patterns of genome evolution that have accompanied host adaptation in Salmonella. Proceedings of the National Academy of Sciences. 2015;112:863. doi: 10.1073/pnas.1416707112. [DOI] [PMC free article] [PubMed] [Google Scholar]
- 32.Liu WQ, et al. Salmonella paratyphi C: genetic divergence from Salmonella choleraesuis and pathogenic convergence with Salmonella typhi. PLoS One. 2009;4:e4510. doi: 10.1371/journal.pone.0004510. [DOI] [PMC free article] [PubMed] [Google Scholar]
- 33.Thomson NR, et al. Comparative genome analysis of Salmonella Enteritidis PT4 and Salmonella Gallinarum 287/91 provides insights into evolutionary and host adaptation pathways. Genome Research. 2008;18:1624–1637. doi: 10.1101/gr.077404.108. [DOI] [PMC free article] [PubMed] [Google Scholar]
- 34.Parkhill J, et al. Complete genome sequence of a multiple drug resistant Salmonella enterica serovar Typhi CT18. Nature. 2001;413:848. doi: 10.1038/35101607. [DOI] [PubMed] [Google Scholar]
- 35.Lee S-J, et al. Identification of a common immune signature in murine and human systemic Salmonellosis. Proceedings of the National Academy of Sciences. 2012;109:4998–5003. doi: 10.1073/pnas.1111413109. [DOI] [PMC free article] [PubMed] [Google Scholar]
- 36.Seth-Smith HM. SPI-7: Salmonella’s Vi-encoding pathogenicity island. The Journal of Infection in Developing Countries. 2008;2:267–271. doi: 10.3855/jidc.220. [DOI] [PubMed] [Google Scholar]
- 37.Omran AR. The epidemiologic transition: a theory of the epidemiology of population change. The Milbank Quarterly. 2005;83:731–757. doi: 10.1111/j.1468-0009.2005.00398.x. [DOI] [PMC free article] [PubMed] [Google Scholar]
- 38.Pinhasi R, Stock JT. Human bioarchaeology of the transition to agriculture. John Wiley & Sons; 2011. [Google Scholar]
- 39.Miller L, Hurley K. Infectious disease management in animal shelters. John Wiley & Sons; 2009. p. 349. [Google Scholar]
- 40.Schuster CJ, et al. Infectious disease outbreaks related to drinking water in Canada, 1974-2001. Canadian Journal of Public Health/Revue Canadienne de Sante'e Publique. 2005:254–258. doi: 10.1007/BF03405157. [DOI] [PMC free article] [PubMed] [Google Scholar]
- 41.Dabney J, et al. Complete mitochondrial genome sequence of a Middle Pleistocene cave bear reconstructed from ultrashort DNA fragments. Proceedings of the National Academy of Sciences. 2013;110:15758–15763. doi: 10.1073/pnas.1314445110. [DOI] [PMC free article] [PubMed] [Google Scholar]
- 42.Rohland N, Harney E, Mallick S, Nordenfelt S, Reich D. Partial uracil-DNA-glycosylase treatment for screening of ancient DNA. Philos Trans R Soc Lond B Biol Sci. 2015;370 doi: 10.1098/rstb.2013.0624. 20130624. [DOI] [PMC free article] [PubMed] [Google Scholar]
- 43.Meyer M, Kircher M. Illumina sequencing library preparation for highly multiplexed target capture and sequencing. Cold Spring Harb Protoc. 2010;2010 doi: 10.1101/pdb.prot5448. pdb.prot5448. [DOI] [PubMed] [Google Scholar]
- 44.Gansauge M-T, et al. Single-stranded DNA library preparation from highly degraded DNA using T4 DNA ligase. Nucleic acids research. 2017;45 doi: 10.1093/nar/gkx033. e79–e79. [DOI] [PMC free article] [PubMed] [Google Scholar]
- 45.Briggs AW, et al. Removal of deaminated cytosines and detection of in vivo methylation in ancient DNA. Nucleic Acids Res. 2010;38:e87. doi: 10.1093/nar/gkp1163. [DOI] [PMC free article] [PubMed] [Google Scholar]
- 46.Haak W, et al. Massive migration from the steppe was a source for Indo-European languages in Europe. Nature. 2015;522:207–211. doi: 10.1038/nature14317. [DOI] [PMC free article] [PubMed] [Google Scholar]
- 47.Huebler R, et al. HOPS: Automated detection and authentication of pathogen DNA in archaeological remains. bioRxiv. 2019 doi: 10.1186/s13059-019-1903-0. 534198. [DOI] [PMC free article] [PubMed] [Google Scholar]
- 48.Briggs AW, et al. Patterns of damage in genomic DNA sequences from a Neandertal. Proceedings of the National Academy of Sciences of the United States of America. 2007;104:14616–14621. doi: 10.1073/pnas.0704665104. [DOI] [PMC free article] [PubMed] [Google Scholar]
- 49.Li H, Durbin R. Fast and accurate short read alignment with Burrows–Wheeler transform. Bioinformatics. 2009;25:1754–1760. doi: 10.1093/bioinformatics/btp324. [DOI] [PMC free article] [PubMed] [Google Scholar]
- 50.Peltzer A, et al. EAGER: efficient ancient genome reconstruction. Genome biology. 2016;17:60. doi: 10.1186/s13059-016-0918-z. [DOI] [PMC free article] [PubMed] [Google Scholar]
- 51.Kircher M. Analysis of high-throughput ancient DNA sequencing data. Ancient DNA: methods and protocols. 2012:197–228. doi: 10.1007/978-1-61779-516-9_23. [DOI] [PubMed] [Google Scholar]
- 52.Jolley KA, et al. Ribosomal multilocus sequence typing: universal characterization of bacteria from domain to strain. Microbiology. 2012;158:1005–1015. doi: 10.1099/mic.0.055459-0. [DOI] [PMC free article] [PubMed] [Google Scholar]
- 53.Bos KI, et al. Pre-Columbian mycobacterial genomes reveal seals as a source of New World human tuberculosis. Nature. 2014;514:494–497. doi: 10.1038/nature13591. [DOI] [PMC free article] [PubMed] [Google Scholar]
- 54.Stamatakis A. RAxML version 8: a tool for phylogenetic analysis and post-analysis of large phylogenies. Bioinformatics. 2014;30:1312–1313. doi: 10.1093/bioinformatics/btu033. [DOI] [PMC free article] [PubMed] [Google Scholar]
- 55.Price MN, Dehal PS, Arkin AP. FastTree 2 – Approximately Maximum-Likelihood Trees for Large Alignments. PLOS ONE. 2010;5:e9490. doi: 10.1371/journal.pone.0009490. [DOI] [PMC free article] [PubMed] [Google Scholar]
- 56.Moran AB, Edwards P. Three New Salmonella Types: S. richmond, S. daytona and S. tallahassee. Proceedings of the Society for Experimental Biology and Medicine. 1946;62:294–296. doi: 10.3181/00379727-62-15455. [DOI] [PubMed] [Google Scholar]
- 57.Van der Walt ML, Huchzermeyer F, Steyn HC. Salmonella isolated from crocodiles and other reptiles during the period 1985-1994 in South Africa. Onderstepoort Journal of Veterinary Research. 1997;64:277–283. [PubMed] [Google Scholar]
- 58.Paton J, Mirfattahi M. Salmonella meningitis acquired from pet snakes. Archives of disease in childhood. 1997;77:91. doi: 10.1136/adc.77.1.e91. [DOI] [PMC free article] [PubMed] [Google Scholar]
- 59.Pedersen K, Sørensen G, Szabo I, Hächler H, Le Hello S. Repeated isolation of Salmonella enterica Goverdhan, a very rare serovar, from Danish poultry surveillance samples. Veterinary microbiology. 2014;174:596–599. doi: 10.1016/j.vetmic.2014.09.024. [DOI] [PubMed] [Google Scholar]
- 60.Sharma V, Rohde R, Garg D, Kumar A. Toads as natural reservoir of salmonella. Zentralblatt fur Bakteriologie, Parasitenkunde, Infektionskrankheiten und Hygiene. Erste Abteilung Originale. Reihe A: Medizinische Mikrobiologie und Parasitologie. 1977;239:172–177. [PubMed] [Google Scholar]
- 61.Sharma V, Singh C. Salmonella goverdhan, a new serotype from sewage. International Journal of Systematic and Evolutionary Microbiology. 1967;17:41–42. [Google Scholar]
- 62.Zhou Z, Alikhan N-F, Mohamed K, Achtman M. The user’s guide to comparative genomics with EnteroBase. Three case studies: micro-clades within Salmonella enterica serovar Agama, ancient and modern populations of Yersinia pestis, and core genomic diversity of all Escherichia. bioRxiv. 2019 613554. [Google Scholar]
- 63.Pagel M. Detecting correlated evolution on phylogenies: a general method for the comparative analysis of discrete characters. Proceedings of the Royal Society of London Series B: Biological Sciences. 1994;255:37–45. [Google Scholar]
- 64.Zhou Z, et al. Transient Darwinian selection in Salmonella enterica serovar Paratyphi A during 450 years of global spread of enteric fever. Proceedings of the National Academy of Sciences. 2014;111:12199. doi: 10.1073/pnas.1411012111. [DOI] [PMC free article] [PubMed] [Google Scholar]
- 65.Jónsson H, Ginolhac A, Schubert M, Johnson PL, Orlando L. mapDamage2. 0: fast approximate Bayesian estimates of ancient DNA damage parameters. Bioinformatics. 2013;29:1682–1684. doi: 10.1093/bioinformatics/btt193. [DOI] [PMC free article] [PubMed] [Google Scholar]
- 66.Renaud G, Slon V, Duggan AT, Kelso J. Schmutzi: estimation of contamination and endogenous mitochondrial consensus calling for ancient DNA. Genome biology. 2015;16:224. doi: 10.1186/s13059-015-0776-0. [DOI] [PMC free article] [PubMed] [Google Scholar]
- 67.Vianello D, et al. HAPLOFIND: A New Method for High-Throughput mtDNA Haplogroup Assignment. Human mutation. 2013;34:1189–194. doi: 10.1002/humu.22356. [DOI] [PubMed] [Google Scholar]
- 68.Korneliussen TS, Albrechtsen A, Nielsen R. ANGSD: Analysis of Next Generation Sequencing Data. BMC Bioinformatics. 2014;15:356. doi: 10.1186/s12859-014-0356-4. [DOI] [PMC free article] [PubMed] [Google Scholar]
- 69.Lazaridis I, et al. Ancient human genomes suggest three ancestral populations for present-day Europeans. Nature. 2014;513:409. doi: 10.1038/nature13673. [DOI] [PMC free article] [PubMed] [Google Scholar]
- 70.Patterson N, Price AL, Reich D. Population structure and eigenanalysis. PLoS genetics. 2006;2:e190. doi: 10.1371/journal.pgen.0020190. [DOI] [PMC free article] [PubMed] [Google Scholar]
- 71.Alexander DH, Novembre J, Lange K. Fast model-based estimation of ancestry in unrelated individuals. Genome research. 2009 doi: 10.1101/gr.094052.109. [DOI] [PMC free article] [PubMed] [Google Scholar]
- 72.Ramsden C, et al. High Rates of Molecular Evolution in Hantaviruses. Molecular Biology and Evolution. 2008;25:1488–1492. doi: 10.1093/molbev/msn093. [DOI] [PubMed] [Google Scholar]
- 73.Stadler T, Kühnert D, Bonhoeffer S, Drummond AJ. Birth–death skyline plot reveals temporal changes of epidemic spread in HIV and hepatitis C virus (HCV) Proceedings of the National Academy of Sciences. 2013;110:228–233. doi: 10.1073/pnas.1207965110. [DOI] [PMC free article] [PubMed] [Google Scholar]
- 74.Reimer PJ, et al. IntCal13 and Marine13 radiocarbon age calibration curves 0–50,000 years cal BP. Radiocarbon. 2013;55:1869–1887. [Google Scholar]
- 75.Yoon SH, Park Y-K, Kim JF. PAIDB v2. 0: exploration and analysis of pathogenicity and resistance islands. Nucleic acids research. 2014;43:D624–D630. doi: 10.1093/nar/gku985. [DOI] [PMC free article] [PubMed] [Google Scholar]
- 76.Fuentes JA, Villagra N, Castillo-Ruiz M, Mora GC. The Salmonella Typhi hlyE gene plays a role in invasion of cultured epithelial cells and its functional transfer to S. Typhimurium promotes deep organ infection in mice. Research in microbiology. 2008;159:279–287. doi: 10.1016/j.resmic.2008.02.006. [DOI] [PubMed] [Google Scholar]
- 77.Vernikos GS, Parkhill J. Interpolated variable order motifs for identification of horizontally acquired DNA: revisiting the Salmonella pathogenicity islands. Bioinformatics. 2006;22:2196–2203. doi: 10.1093/bioinformatics/btl369. [DOI] [PubMed] [Google Scholar]
- 78.Blondel CJ, Jiménez JC, Contreras I, Santiviago CA. Comparative genomic analysis uncovers 3 novel loci encoding type six secretion systems differentially distributed in Salmonella serotypes. BMC genomics. 2009;10:354. doi: 10.1186/1471-2164-10-354. [DOI] [PMC free article] [PubMed] [Google Scholar]
- 79.Elder JR, et al. The Salmonella pathogenicity island 13 contributes to pathogenesis in streptomycin pre-treated mice but not in day-old chickens. Gut pathogens. 2016;8:16. doi: 10.1186/s13099-016-0098-0. [DOI] [PMC free article] [PubMed] [Google Scholar]
- 80.Shah DH, et al. Identification of Salmonella gallinarum virulence genes in a chicken infection model using PCR-based signature-tagged mutagenesis. Microbiology. 2005;151:3957–3968. doi: 10.1099/mic.0.28126-0. [DOI] [PubMed] [Google Scholar]
- 81.Li H. Aligning sequence reads, clone sequences and assembly contigs with BWA-MEM. arXiv preprint arXiv: 1303.3997. 2013 [Google Scholar]
- 82.Quinlan AR, Hall IM. BEDTools: a flexible suite of utilities for comparing genomic features. Bioinformatics. 2010;26:841–842. doi: 10.1093/bioinformatics/btq033. [DOI] [PMC free article] [PubMed] [Google Scholar]
- 83.McKenna A, et al. The Genome Analysis Toolkit: a MapReduce framework for analyzing next-generation DNA sequencing data. Genome research. 2010 doi: 10.1101/gr.107524.110. [DOI] [PMC free article] [PubMed] [Google Scholar]
- 84.Fellows Yates JA, et al. Central European Woolly Mammoth Population Dynamics: Insights from Late Pleistocene Mitochondrial Genomes. Scientific Reports. 2017;7 doi: 10.1038/s41598-017-17723-1. 17714. [DOI] [PMC free article] [PubMed] [Google Scholar]
Associated Data
This section collects any data citations, data availability statements, or supplementary materials included in this article.


